Abstract
This study had two objectives. First, to determine the prevalence of hollow (high-arched) and flat foot among primary school children in Cracow (Poland). Second, to evaluate the relationship between the type of medial longitudinal arch (MLA; determined by the Clarke’s angle) and degree of fatness. The prevalence of underweight, overweight, and obesity was determined by means of IOTF cut-offs with respect to age and gender. A sample of 1,115 children (564 boys and 551 girls) aged between 3 and 13 years was analyzed. In all age groups, regardless of gender, high-arched foot was diagnosed in the majority of children. A distinct increase in the number of children with high-arched foot was observed between 7- and 8-year olds. Regardless of the gender, high-arched foot was more common among underweight children. In the group of obese children, the biggest differences were attributed to gender. High-arched foot was the most frequently observed among boys. In all gender and obesity level groups, the flat foot was more common among boys than among girls. Conclusions: High-arched foot is the most common foot defect among children 3–13 years old regardless of gender. Flat foot is least frequently observed in children 3–13 years old. A statistic correlation between MLA and adiposity is observed. Stronger correlation is observed among girls.
Keywords: Flat foot, High-arched foot, MLA, Adiposity, Children
Introduction
Human foot has been an object of interest of various specialists. Leonardo da Vinci, a Renaissance genius, painter, and architect, remarked that it was a most brilliantly structured machine and a true piece of art. The foot consists of 26 bones and more than 30 articulations enabling three fundamental functions: supporting, shock absorbing, and weight bearing. Many factors influence the structure and functioning of the foot, one of them being body weight. The problem of overweight and obesity and their influence on foot arches has been frequently dealt with, particularly in the context of an influence of excessive weight on flat foot incidence [4, 19, 21, 26]. Over the past decades, the number of overweight and obese children has risen worldwide [1, 2, 17, 20]. Overweight is reported to be one of the most serious health problems of the twenty-first century [14, 15, 29]. At the same time, there are not enough surveys carried out concerning the influence of underweight on foot structure. It seems, however, that underweight does not pose such a serious problem as overweight because it refers to a small percentage of the population of children and adolescents. In the study carried out by Mauch et al. [18], 5 % of the examined group of children were diagnosed as underweight, whereas about 16 % of children were diagnosed as overweight.
There are many techniques that have been used to assess the medial longitudinal arch (MLA). We can divide them into two groups: indirect and direct methods. Indirect methods include ink or digital footprints which can be static (standing) or dynamic (walking) and photographic techniques. Direct methods are somatometric measurements, clinical assessment, radiographic evaluation, and ultrasonography quantification. One of the most popular and widely used methods of assessing MLA is the footprint. On the base of this technique, we can measure the MLA by using different sorts of indexes like Clark`s angle (footprint angle), Chippaux–Simirak index, arch index, and Sztriter–Godunow index (Ky) [6, 23].
Over the years, it has been believed that flat foot, perceived as the lowering or complete collapse of the MLA, is the most frequently occurring foot condition among children and adolescents [11]. The study performed towards the end of the twentieth century introduced an analysis of the influence of age and gender on the development of the MLA. It was reported that flexible flat foot is not an orthopedic problem because this defect disappears with age [13]. The surveys performed by many study centers have shown that incidence of flat foot among children decreases with age and the MLA develops naturally with age. According to Pfeiffer [21], its most remarkable development occurs between the ages of 2 and 6 years. Rao and Joseph [22] observed that flat foot incidence diminished with age. A decrease after the age of 9 years was slower. El et al. [11] described the decrease in flat foot incidence up to the age of 9. Villeroya et al. [25] established the age of 9 years to be the moment of full development of the MLA.
The majority of studies concerning foot and MLA structure distinguish properly arched feet from feet with lowered or completely collapsed MLA. As far as the foot structure is concerned, one can observe an increased height of the MLA which leads to the shortening of the distance between the heel bone and the metatarsals and a secondary contracture of the plantar fascia. Such a foot is described as a high-arched foot. High-arched foot can be affected by muscle imbalance caused by developmental anomalies in the lower segments of the spinal cord. Focusing on the problem of flat foot resulted in the fact that the majority of study lacks data and the results of the analyses concerning high-arched foot incidence. Few surveys, which take into account the occurrence of high-arched foot, show that this condition is relatively frequent [22–24]. In the following study, the incidence of high-arched foot ranges from 14.6 to 25.8 %.
The purpose of this paper was to evaluate foot arching in the population of children and adolescents depending on gender and age of the examined subjects and to assess the impact of underweight, overweight, and obesity on foot arches.
Materials and methods
The study was carried out on the group of 1,115 primary school children (564 boys and 551 girls) in Cracow, the capital city of the Małopolskie voivodship (Poland). The age of examined children ranged from 3 to 13 years. In our study, the selection of schools and children was randomized. The persons who conducted study (AB and RW) were trained and headmasters, and parents were informed about the aims and time lasting of the study and about study methods. The study was conducted by approval of headmasters and parents. All carried measurements were repetitive. The number of children in all age groups is shown in Table 1.
Table 1.
Number of children according to age
| Age (years) | Number |
|---|---|
| Girls | |
| 4–6 | 63 |
| 7 | 50 |
| 8 | 90 |
| 9 | 64 |
| 10 | 74 |
| 11 | 95 |
| 12 | 73 |
| 13 | 42 |
| Total | 551 |
| Boys | |
| 3–6 | 68 |
| 7 | 55 |
| 8 | 82 |
| 9 | 80 |
| 10 | 59 |
| 11 | 78 |
| 12 | 99 |
| 13 | 43 |
| Total | 564 |
The children with congenital structural disorders affecting the areas below the ankle joint as well as those with pathological flat foot caused by cerebral palsy, surgical treatment, genetic conditions, and neurological or muscle pathologies were not included in the researched group.
A Martin-type anthropometer was applied to measure body height. Body mass was measured with electronic scales. The measurement of body weight and height allowed the calculation of body mass index (BMI) for every examined child:
 |
A podoscopic examination was applied to determine foot arching. Each time, both feet were subjected to examination and they were scanned twice. The first scan was done to calibrate the equipment while the other one was to conduct the measurement. Based on the picture obtained during the second scan, foot arching parameters were calculated (Clark angle and Ky index), the researcher marked by hand points in computer and next the computer calculated the Clark angle on the basis of those points. All footprints were calculated by the same person. The scans of samples of flat, normal, and hollow feet are shown in Figs. 1, 2, and 3.
Fig. 1.
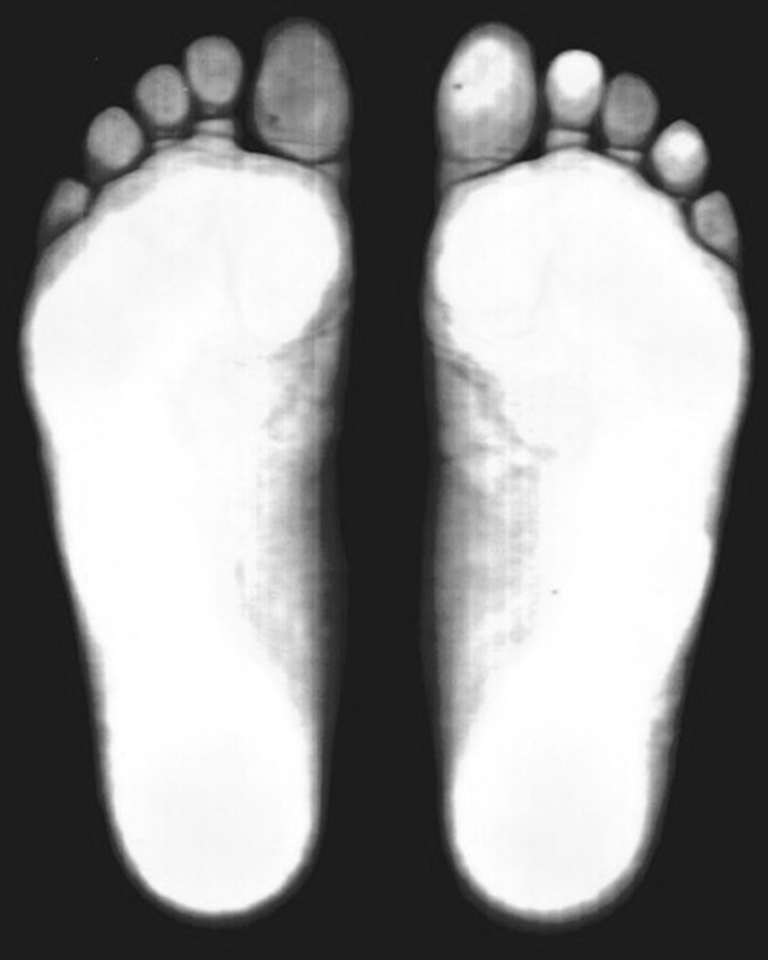
Scan of flat foot
Fig. 2.
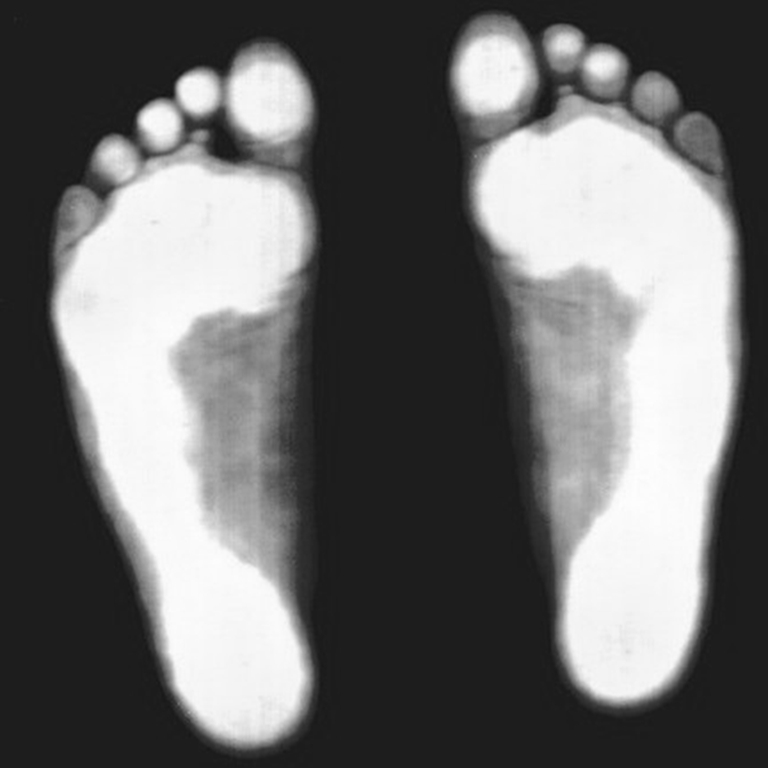
Scan of normal foot
Fig. 3.
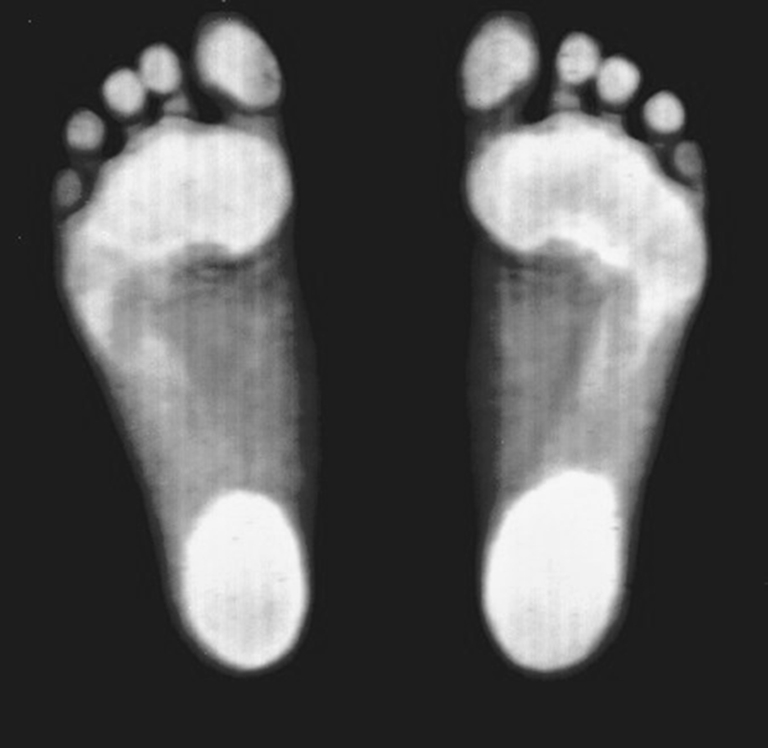
Scan of high-arched foot
In this study, authors refer to the standards for the population of children and adolescents in Cracow [16]. Clark angle (α) cut-offs were calculated by means of regression method and percentile girds on the basis of 3,923 children from Cracow aged 3 to 15 years old (2,028 girls and 1,895 boys) in terms of gender and age [15]. On the basis of pointed cut-offs, the definitions of MLA types are as follow: Clark angle values below lower range of norm are described as a flatfoot, Clark angle values above higher range of norm are defined as a high-arched foot. Standards for children ages 8–13 years are shown in Table 2.
Table 2.
Standards based on linear regression for Clarke’s angle considering gender and age [15]
| Age (years) | Clarke’s angle (deg) | |
|---|---|---|
| Girls | Boys | |
| 8 | 33–45 | 27–42 |
| 9 | 33–45 | 28–43 |
| 10 | 32–46 | 30–44 |
| 11 | 32–46.5 | 31–45 |
| 12 | 32–47 | 32–46 |
| 13 | 40–48 | 33–47 |
Separate standards of Clarke’s angle for gender groups are important because in the development of the longitudinal arch a sexual dimorphism is observed. The Clarke’s angle rate grows faster in girls than in boys. Differences in MLA between right and left feet are small and statistically insignificant. Therefore there is no need to refer to the separate standards for right and left feet. Authors often do not consider the occurrence of a high-arched foot. In addition, the values of standards adopted by Villarroya [26], take a higher Clarke’s angle value for a flat foot, comparing to the standards for the population of Cracow, used in this paper. Furthermore, those standards do not consider the age or gender of the children, which affects the final results.
Clarke’s angle (footprint angle α) is a widely used method of assessing the longitudinal foot arch [22, 25, 26]. It is constructed by drawing a tangent to the medial edge of the foot (the prints) and a line connecting the deeper part of the footprint with the most medial point of the forefoot (Fig. 4).
Fig. 4.
The Clark angle (α) and the Sztriter–Godunow index–Ky (bc/ac)
Results
In all age groups, regardless of gender of the examined subjects, high-arched foot is diagnosed in majority of children and flat foot is the least frequently observed deformity with the exception of the 4- to 6-year-old group in which flat foot is more common than normally arched one. After the age of 7, flat foot occurs in fewer than ten cases in individual age groups while high-arched foot is observed several times more frequently (Tables 3 and 4). The most children with high-arched foot were observed among boys 8, 9, 11, and 12 years old and among girls 8, 10, and 11 years old. A distinct increase in the number of children with high-arched foot was observed between 7 and 8 years old. The number of children with high-arched foot was twice as high in the group of 8-year-olds than in the group of 7-year olds. This condition is more frequent among girls.
Table 3.
Number of subjects with various types of longitudinal arching depending on age and gender among girls
| Age (years) | Girls | |||||
|---|---|---|---|---|---|---|
| Clark L | Clark R | |||||
| h | n | f | h | n | f | |
| 4–6 | 41 | 10 | 12 | 37 | 15 | 11 |
| 7 | 30 | 17 | 3 | 32 | 15 | 3 |
| 8 | 67 | 20 | 3 | 71 | 17 | 2 |
| 9 | 45 | 15 | 4 | 47 | 14 | 3 |
| 10 | 51 | 20 | 3 | 57 | 12 | 5 |
| 11 | 59 | 32 | 4 | 61 | 31 | 2 |
| 12 | 44 | 27 | 2 | 47 | 21 | 5 |
| 13 | 20 | 18 | 4 | 25 | 14 | 3 |
L left foot, R right foot, h number of high arched feet, n number of normal feet, f number of flat feet
Table 4.
Number of subjects with various types of longitudinal arching depending on age and gender among boys
| Age (years) | Boys | |||||
|---|---|---|---|---|---|---|
| Clark L | Clark R | |||||
| h | n | f | h | n | f | |
| 3–6 | 33 | 15 | 20 | 36 | 14 | 18 |
| 7 | 34 | 11 | 10 | 36 | 8 | 11 |
| 8 | 49 | 23 | 10 | 56 | 18 | 8 |
| 9 | 50 | 25 | 5 | 54 | 22 | 4 |
| 10 | 35 | 16 | 8 | 36 | 14 | 9 |
| 11 | 45 | 27 | 6 | 54 | 18 | 6 |
| 12 | 56 | 36 | 7 | 65 | 28 | 6 |
| 13 | 26 | 15 | 2 | 27 | 13 | 3 |
L left foot, R right foot, h number of high arched feet, n number of normal feet, f number of flat feet
The assessment of MLA was also done by means of Ky (see Fig. 4). Received results depending on age and gender are shown in Tables 5 and 6.
Table 5.
Number of subjects with various types of longitudinal arching depending on age and gender among girls (Ky index)
| Age (years) | Girls | |||||
|---|---|---|---|---|---|---|
| Ky L | Ky R | |||||
| h | n | f | h | n | f | |
| 4–6 | 43 | 7 | 13 | 41 | 11 | 11 |
| 7 | 34 | 9 | 7 | 37 | 8 | 5 |
| 8 | 77 | 11 | 2 | 81 | 7 | 2 |
| 9 | 45 | 16 | 3 | 47 | 15 | 2 |
| 10 | 50 | 19 | 5 | 60 | 8 | 6 |
| 11 | 62 | 31 | 2 | 65 | 27 | 2 |
| 12 | 48 | 24 | 1 | 53 | 20 | 0 |
| 13 | 18 | 22 | 2 | 21 | 19 | 2 |
L left foot, R right foot, h number of high-arched feet, n number of normal feet, f number of flat feet
Table 6.
Number of subjects with various types of longitudinal arching depending on age and gender among boys (Ky index)
| Age (years) | Boys | |||||
|---|---|---|---|---|---|---|
| Ky L | Ky R | |||||
| h | n | f | h | n | f | |
| 3–6 | 31 | 18 | 19 | 34 | 16 | 18 |
| 7 | 37 | 7 | 11 | 38 | 7 | 10 |
| 8 | 52 | 24 | 6 | 60 | 15 | 7 |
| 9 | 42 | 33 | 5 | 52 | 21 | 6 |
| 10 | 33 | 15 | 11 | 32 | 17 | 10 |
| 11 | 51 | 21 | 6 | 55 | 18 | 5 |
| 12 | 62 | 30 | 7 | 66 | 29 | 4 |
| 13 | 21 | 18 | 4 | 22 | 17 | 4 |
L left foot, R right foot, h number of high-arched feet, n number of normal feet, f number of flat feet
In order to analyze the influence of BMI on MLA, the study group was divided into three subgroups: underweight, overweight, and obese children. The division was carried out on the basis of the BMI calculated for each child and compared against the IOTF norms with respect to age and gender [7, 8]. Seventy-four children (6.6 %) were classified as underweight. This condition was more frequent in girls and concerned 42 of them (7.6 % of examined girls). In the group of boys, 32 were underweight (5.7 %). Overweight condition was diagnosed in 245 children (22 %), and obesity was observed in 64 cases (5.7 % of the study group). Overweight and obesity incidences were more frequent in the group of boys and equaled 153 (27.1 %) overweight cases and 44 (7.8 %) obese ones, while in the group of girls the numbers were 92 (16.7 %) and 20 (3.6 %), respectively.
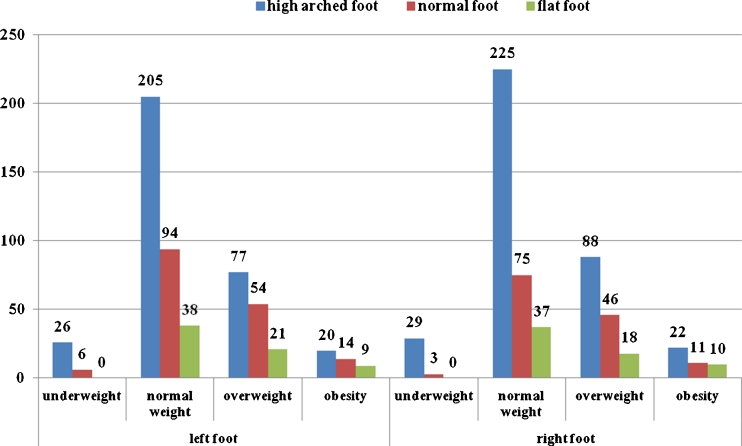
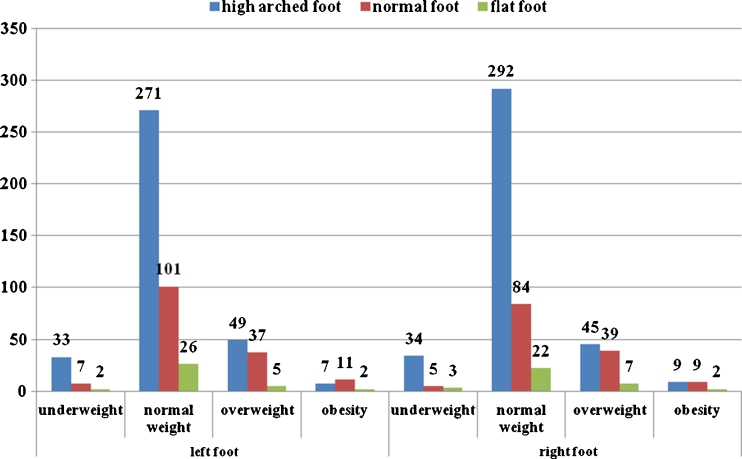
Figures 5 and 6 present the distribution of the types of foot arching depending on gender and obesity level. High-arched foot was more common in underweight children, regardless of their sex. There was not a single instance of flat foot among underweight boys. In the case of overweight children, high-arched foot was also the most common type of arching. However, the difference in the number of children with raised and normal foot arches was distinctly smaller than among underweight children. In the group of overweight children, flat foot was more common among boys than among girls but still occurred among the smallest percentage of the examined subjects. In the group of obese children, the biggest distinctions observed were due to gender. High-arched foot was the most frequent in the group of boys, while in the group of girls it was on the same level as normal right foot. In the left foot, high-arched foot was diagnosed in a smaller number of children than the normal one. In the group of obese children, flat foot was the least frequent condition. Similarly to the group of overweight children, it was more common among boys than girls.
Fig. 5.
Type of MLA depending on gender and obesity level among boys
Fig. 6.
Type of MLA depending on gender and obesity level among girls
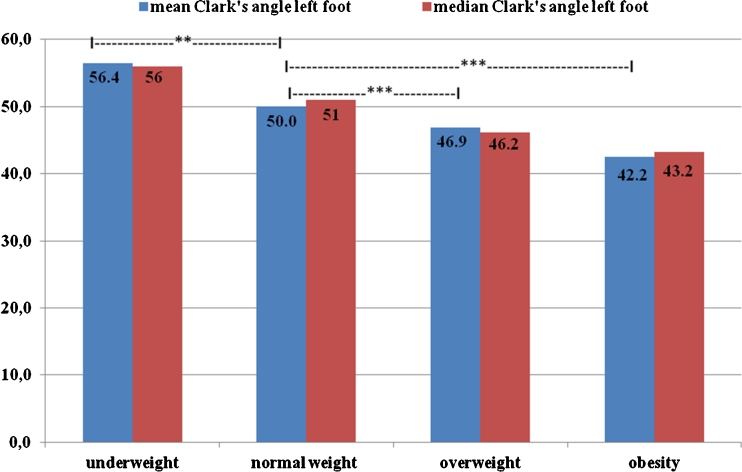
Comparing mean values of the Clarke’s angle in normal weight children with those in underweight, overweight, and obese children, statistically significant differences were observed (p < 0.001). Only in the left foot the difference between normal weight and underweight children was statistically significant at p < 0.01 (Figs. 7 and 8).
Fig. 7.
Mean and median values of Clarke’s angle in adipose groups in right foot
Fig. 8.
Mean and median values of Clarke’s angle in adipose groups in left foot
A Chi-square test for independence was applied to evaluate the strength of correlation between obesity level (determined on the basis of the BMI value) and the MLA height (determined by the Clarke’s angle). The BMI categories were subcategorized into: underweight, normal weight, overweight, and obese. The MLA categories included: low arch, normal arch, and high arch and were determined on the basis of the Clarke’s angle.
The correlations between both variables proved statistically significant in both groups of girls and boys. In the group of girls, the significance level was p < 0.001 for both feet, and in the group of boys, the significance level was p < 0.01 in the right foot and p < 0.05 in the left foot. The strength of the relationship between the variables presented in the individual categories was evaluated following two correlation coefficients: conditional Gamma coefficient (γ) and Pearson’s correlation coefficient (r). Both indices make it possible to determine the sign of the direction of those relationships. A stronger relationship was noticed among girls: γ = 0.313; r = 0.134 in the left foot and γ = 0.429; r = 0.179 in the right foot. Among boys, the coefficient values equaled: γ = 0.222; r = 0.128 in the left foot and γ = 0.229; r = 0.130 in the right foot, respectively. The relationships observed were positive which implies that an increase of BMI values corresponded with average higher values of the Clarke’s angle characteristic of flat feet.
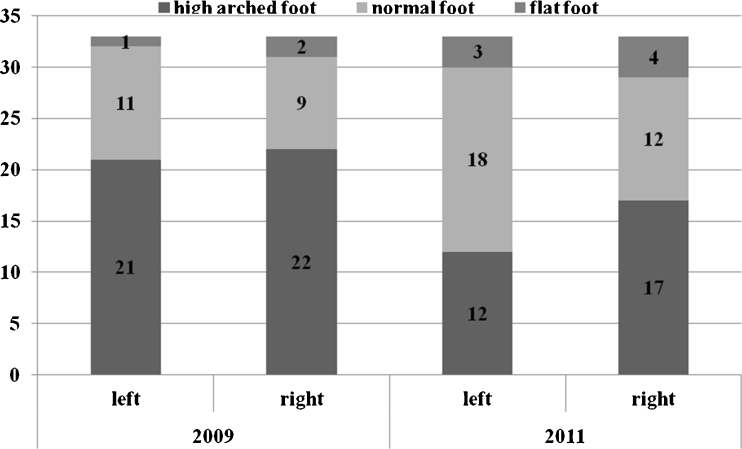
Foot arch changes with age. In the majority of published surveys, the conclusion has been reached on the basis of a cross-sectional examination of children of various ages. This paper provides an attempt to evaluate those changes on the basis of a repeated examination of 68 subjects (33 girls and 35 boys) after 2.5 years. The repeated examination included the group of children who were 9 or 10 years old at the time of their first examination (mean, 9.4; range, 8.7–10.3). The studies after 2 years were carried out by the same persons and the same person assessed the footprints. First, new material was assessed and next results were compared. Many authors assume that at this age foot arches become fully developed or the changes that they undergo have significantly slowed down [11, 26]. Figures 9 and 10 illustrate the number of children and their MLA types depending on gender in both study series.
Fig. 9.
Comparison of number of foot types in repeated studies in boys
Fig. 10.
Comparison of number of foot types in repeated studies in girls
The mean value of the Clark’s angle in the left foot in the first examination equalled 46.79 and in the right foot it was 46.17. In the right foot, the difference was bigger: 51.1 in the first examination and 46.74 in the second one. In the right foot the difference was statistically significant (p < 0.05).
The BMI changes (median, mean values and standard deviation) are shown in Table 7.
Table 7.
BMI changes between 2009 and 2011 in study group
| 2009 | 2011 | |||||
|---|---|---|---|---|---|---|
| Boys | Girls | All | Boys | Girls | All | |
| Median | 18.0 | 17.3 | 17.8 | 18.5 | 18.5 | 18.7 |
| Mean | 18.9 | 17.5 | 18.2 | 19.5 | 18.6 | 19.2 |
| SD | 3.1 | 2.6 | 2.9 | 3.6 | 3.2 | 3.5 |
Discussion
The results of our investigation clearly point to a higher prevalence of high-arched feet in children and adolescents 4 to 13 years old. High-arched foot was observed in 66.5 % of children in the right foot and in 61.4 % in the left foot. An overly high arch was more common among girls than boys. High-arched foot was the most frequent type of the MLA in all age groups. It is difficult to compare the results obtained with the ones achieved in other studies because few authors take into consideration high-arched foot in their analyses. In the study dealing with high-arched foot incidence, various methods of footprint evaluation are applied in order to determine the MLA. In the survey done by Stavlas et al. [23], concerning children 6–17 years old in the Mediterranean population, the Grives method was applied to determine the MLA. The percentage of children with hollow left foot equalled 16.7 % in the group of boys and 17.9 % in the group of girls. A higher MLA in the right foot was observed in 15.3 % of boys and 16.3 % of girls. Although high-arched foot values were lower than in this/our study, this type of MLA was observed more frequently among girls than boys. In the study performed on the group of children from India, Rao and Joseph [22] diagnosed high-arched foot in 25.8 % of examined children. The authors evaluated the influence of footwear on foot arches. Another study that analyses the frequency of high-arched foot incidence comes from Riga. Umbrasko et al. [24] observed the incidence of high-arched foot in 26.3 % of rural children and in 14.6 % of urban children. The Ky index was applied to determine the height of MLA.
Flat foot epidemiology and the reasons for lower MLA values are the most prevalent problems dealt with in the literature. The influence of gender and age on flat foot incidence has also been analyzed. In the present study flat foot was observed in 6.2 % of girls in both feet and in 12.1 % of boys in the left foot and in 11.5 % in the right foot. In all examined groups regardless of gender, flat foot reaches the level of 14.5 % in the left foot and 8.9 % in the right one. These results are similar to those found in the literature. Mauch et al. [18] report the percentage of flat foot to be at the level of 14.5 %, Stavlas et al. [23] presented lower results: 5.1 % in the group of boys and 3.7 % in the group of girls. Similarly, low level of flat foot (2.7 %) was reported in the survey carried out by Garcia-Rodriguez et al. [13]. In the study performed by Rao and Joseph [22], flat foot was diagnosed in 6.7 % of children. A higher percentage of flat foot was observed by Chen et al. [5]; on average, flat foot reached the level of 28 % of the examined cases (35 % of boys and 20 % of girls). The majority of the results of the analyses that address the diversity of flat foot occurrence depending on gender proves that this dysfunction is more prevalent among boys than girls [3, 5, 23, 27]. Such a tendency can already be observed in preschool children. Pfeiffer et al. [21] reported flat foot incidence to be higher by 2.2 among boys than girls 3–6 years old. The influence of age on decreased or collapsed MLA shows that the number of children with flat foot diminishes with age. This is confirmed by the surveys carried out by many study centers [4, 5, 26].
The fact that obese children display a stronger tendency to flat foot is expected and documented in the literature [4, 10, 13, 21]. The opposite result was obtained by Evans [12] in the examination of 140 children aged 7–10. Besides, a connection was observed between the increase in body weight and the increase in flat foot incidence [4, 5, 18]. The above survey showed that the increase in body weight influences foot arches. In both gender groups, the relationship between the MLA and BMI was positive and statistically significant. The relationship was more distinct among girls (p < 0.001) than among boys (p < 0.01 in the right foot and p < 0.05 in the left foot).
In preschool children, a high incidence of flat foot results from, among other reasons, a fat pad of the plantar side of the foot. This pad diminishes after reaching the age of 4–5 years. For some time, a notion prevailed that a greater number of children with flat foot in the group of obese subjects is connected with the existence of a larger fat pad, whereas the study carried out by Mickle et al. [19] showed that the fat pad thickness in obese and non-obese children in preschool age were the same. Therefore, a thicker fat pad cannot explain flat foot in overweight and obese children. Excessive body weight borne by each leg leads to flat foot. The changes in the MLA may be caused by structural changes in foot anatomy. This hypothesis seems to be confirmed by the study performed by Villaroya et al. [26] on the group of 58 obese children aged 9 to 16.5. Their Clark`s angle values were significantly lower depending on the decrease in the height of MLA. The decrease in MLA was substantiated with X-ray images which showed that the established parameters reached the values indicative of a fallen arch.
Weight-bearing influences the anatomic structure of the foot as well as the MLA height. Therefore, the question arises whether a lack of weight-bearing or its decrease will bear an influence on an increase of the MLA’s height. A high percentage of children with high-arched foot may result from the fact that physical activity among children and adolescents is rapidly decreasing. The problem has been observed by many authors in the context of a growing number of overweight and obese children [9, 28].
Acknowledgments
Conflict of interest
The authors declare no conflict of interest.
References
- 1.Aekplakorn W, Mo-Suwan L. Prevalence of obesity in Thailand. Obes Rev. 2009;10(6):589–592. doi: 10.1111/j.1467-789X.2009.00626.x. [DOI] [PubMed] [Google Scholar]
- 2.Bac A, Woźniacka R, Matusik S, Golec J, Golec E. Prevalence of overweight and obesity in children aged 6–13 years—alarming increase in obesity in Cracow, Poland. Eur J Pediatr. 2012;171:245–251. doi: 10.1007/s00431-011-1519-1. [DOI] [PMC free article] [PubMed] [Google Scholar]
- 3.Bordin D, De Giorgi G, Mazzocco G, Rigon F. Flat and cavus foot, indexes of obesity and overweight in a population of primary-school children. Minerva Pediatr. 2001;53:7–13. [PubMed] [Google Scholar]
- 4.Chang JH, Wang SH, Kuo CL, Shen HC, Hong YW, Lin LC. Prevalence of flexible flatfoot in Taiwanese school-aged children in relation to obesity, gender, and age. Eur J Pediatr. 2010;169:447–452. doi: 10.1007/s00431-009-1050-9. [DOI] [PubMed] [Google Scholar]
- 5.Chen JP, Chung MJ, Wang MJ. Flatfoot prevalence and foot dimensions of 5- to 13-year-old children in Taiwan. Foot Ankle Int. 2009;30(4):326–332. doi: 10.3113/FAI.2009.0326. [DOI] [PubMed] [Google Scholar]
- 6.Chen CH, Huang MH, Chen TW, Weng MC, Lee CL, Wang GJ. The correlation between selected measurements from footprint and radiograph of flatfoot. Arch Phys Med Rehab. 2006;87:235–240. doi: 10.1016/j.apmr.2005.10.014. [DOI] [PubMed] [Google Scholar]
- 7.Cole TJ, Bellizzi MC, Flegal KM, Dietz WH. Establishing a standard definition for child overweight and obesity worldwide: international survey. BMJ. 2000;320:1240–1243. doi: 10.1136/bmj.320.7244.1240. [DOI] [PMC free article] [PubMed] [Google Scholar]
- 8.Cole TJ, Flegal KM, Nicholls D, Jackson AA. Body mass index cut offs to define thinness in children and adolescents: international survey. BMJ. 2007;335(7612):194–202. doi: 10.1136/bmj.39238.399444.55. [DOI] [PMC free article] [PubMed] [Google Scholar]
- 9.De Bourdeaudhuij I, Van Cauwenberghe E, Spittaels H, Oppert JM, Rostami C, Brug J, Van Lenthe F, Lobstein T, Maes L. School-based interventions promoting both physical activity and healthy eating in Europe: a systematic review within the HOPE project. Obes Rev. 2011;12(3):205–216. doi: 10.1111/j.1467-789X.2009.00711.x. [DOI] [PubMed] [Google Scholar]
- 10.Dowling AM, Steele JR, Baur LA. Does obesity influence foot structure and plantar pressure patterns in prepubescent children? Int J Relat Metab Disord. 2001;25:845–852. doi: 10.1038/sj.ijo.0801598. [DOI] [PubMed] [Google Scholar]
- 11.El O, Akcali O, Kosay E, Kaner B, Arslan Y, Sagol E, Soylev S, Iyidogan D, Cinar N, Peker O. Flexible flatfoot and related factors in primary school children: a report of a screening study. Rheumatol Int. 2006;26:1050–1053. doi: 10.1007/s00296-006-0128-1. [DOI] [PubMed] [Google Scholar]
- 12.Evans AM. The paediatric flat foot and general anthropometry in 140 Australian school children aged 7–10 years. J Foot Ankle Res. 2011;4(12):1–7. doi: 10.1186/1757-1146-4-12. [DOI] [PMC free article] [PubMed] [Google Scholar]
- 13.Garcia-Rodriguez A, Martin-Jimenez F, Carnero-Varo M, Gomez-Gracia E, Gomez-Aracena J, Fernandez-Crehuet J. Flexible flat foot in children: a real problem? Pediatrics. 1999;103:e84. doi: 10.1542/peds.103.6.e84. [DOI] [PubMed] [Google Scholar]
- 14.Jebb SA, Lambert J. Overweight and obesity in European children and adolescents. Eur J Pediatr. 2000;159(Suppl 1):2–4. doi: 10.1007/PL00014362. [DOI] [PubMed] [Google Scholar]
- 15.Livingstone B. Epidemiology of childhood obesity in Europe. Eur J Pediatr. 2000;159(Suppl 1):14–34. doi: 10.1007/PL00014363. [DOI] [PubMed] [Google Scholar]
- 16.Lizis P. Kształtowanie się wysklepienia łuku podłużnego stopy i problem korekcji płaskostopia u dzieci i młodzieży w wieku rozwojowym (Formation of medial longitudinal arch and the problem of flat feet correction in children and youth) AWF Kraków Podręczniki Skrypty. 2000;10:65. [Google Scholar]
- 17.Lob-Corzilius T. Overweight and obesity in childhood—a special challenge for public health. Int J Hyg Environ Health. 2007;210:585–589. doi: 10.1016/j.ijheh.2007.07.019. [DOI] [PubMed] [Google Scholar]
- 18.Mauch M, Grau S, Krauss I, Maiwald C, Horstmann T. Foot morphology of normal, underweight and overweight children. Int J Obes. 2008;32:1068–1075. doi: 10.1038/ijo.2008.52. [DOI] [PubMed] [Google Scholar]
- 19.Mickle KJ, Steele JR, Munro BJ. The feet of overweight and obese young children: are they flat or fat? Obesity. 2006;14(11):1949–1953. doi: 10.1038/oby.2006.227. [DOI] [PubMed] [Google Scholar]
- 20.Ogden CL, Carroll MD, Curtin LR, McDowell MA, Tabak CJ, Flegal KM. Prevalence of overweight and obesity in the United States, 1999–2004. JAMA. 2006;295(13):1549–1555. doi: 10.1001/jama.295.13.1549. [DOI] [PubMed] [Google Scholar]
- 21.Pfeiffer M, Kotz R, Ledl T, Hauser G, Sluga M. Prevalence of flat foot in preschool-aged children. Pediatrics. 2006;118:634–639. doi: 10.1542/peds.2005-2126. [DOI] [PubMed] [Google Scholar]
- 22.Rao UB, Joseph B. The influence of footwear on the prevalence of flat foot. J Bone Joint Surg. 1992;74-B:525–527. doi: 10.1302/0301-620X.74B4.1624509. [DOI] [PubMed] [Google Scholar]
- 23.Stavlas P, Grivas TB, Constantinos M, Vasiliadis E, Polyzois V. The evaluation of foot morphology in children between 6 and 17 years of age: a cross-sectional study based on footprints in a Mediterranean population. J Foot Ankle Surg. 2005;44(6):424–428. doi: 10.1053/j.jfas.2005.07.023. [DOI] [PubMed] [Google Scholar]
- 24.Umbrasko S, Vetra J, Dulevska I, Boka S, Gavricenkova L, Zagare R. Specificities of foot growth among schoolchildren of Riga and Latvian regions. Pap Anthropol. 2007;XVI:283–292. [Google Scholar]
- 25.Villaroya MA, Esquivel JM, Tomas C, Buenafe A, Moreno LA. Foot structure in overweight and obese children. Int J Pediatr Obes. 2008;3:39–45. doi: 10.1080/17477160701520298. [DOI] [PubMed] [Google Scholar]
- 26.Villaroya MA, Esquivel JM, Tomas C, Moreno LA, Buenafe A, Bueno G. Assessment of the medial longitudinal arch in children and adolescents with obesity: footprints and radiographic study. Eur J Pediatr. 2009;168:559–567. doi: 10.1007/s00431-008-0789-8. [DOI] [PubMed] [Google Scholar]
- 27.Woźniacka R, Bac A, Matusik S. Feet defects, fatness and BMI in children aged 7–12 years. Pol J Environ Stud. 2008;17(4A):459–463. [Google Scholar]
- 28.Woźniacka R, Matusik S. The influence of sport training differentiation of BMI and sum of three skinfolds in boys and girls aged 9–10 years. Int J Obes. 2006;30((suppl2)):34. [Google Scholar]
- 29.Zimmermann MB, Gűbelli C, Pűntener C, Molinari L. Overweight and obesity in 6–12 years old children in Switzerland. Swiss Med Wkly. 2004;134:523–528. doi: 10.4414/smw.2004.10640. [DOI] [PubMed] [Google Scholar]


