

Abstract
Purpose
We used high-resolution spectral-domain optical coherence tomography (SD-OCT) with retinal segmentation to determine how ganglion cell loss relates to history of acute optic neuritis (ON), retinal nerve fiber layer (RNFL) thinning, visual function, and vision-related quality of life (QOL) in multiple sclerosis (MS).
Design
Cross-sectional study.
Participants
A convenience sample of patients with MS (n = 122; 239 eyes) and disease-free controls (n = 31; 61 eyes). Among MS eyes, 87 had a history of ON before enrollment.
Methods
The SD-OCT images were captured using Macular Cube (200×200 or 512×128) and ONH Cube 200×200 protocols. Retinal layer segmentation was performed using algorithms established for glaucoma studies. Thicknesses of the ganglion cell layer/inner plexiform layer (GCL+IPL), RNFL, outer plexiform/inner nuclear layers (OPL+INL), and outer nuclear/photoreceptor layers (ONL+PRL) were measured and compared in MS versus control eyes and MS ON versus non-ON eyes. The relation between changes in macular thickness and visual disability was also examined.
Main Outcome Measures
The OCT measurements of GCL+IPL and RNFL thickness; high contrast visual acuity (VA); low-contrast letter acuity (LCLA) at 2.5% and 1.25% contrast; on the 25-item National Eye Institute Visual Function Questionnaire (NEI-VFQ-25) and 10-Item Neuro-Ophthalmic Supplement composite score.
Results
Macular RNFL and GCL+IPL were significantly decreased in MS versus control eyes (P<0.001 and P = 0.001) and in MS ON versus non-ON eyes (P<0.001 for both measures). Peripapillary RNFL, macular RNFL, GCL+IPL, and the combination of macular RNFL+GCL+IPL were significantly correlated with VA (P≤0.001), 2.5% LCLA (P<0.001), and 1.25% LCLA (P≤0.001). Among OCT measurements, reductions in GCL+IPL (P<0.001), macular RNFL (P = 0.006), and the combination (macular RNFL+GCL+IPL; P<0.001) were most strongly associated with lower (worse) NEI-VFQ-25 and 10-Item Supplement QOL scores; GCL+IPL thinning was significant even accounting for macular RNFL thickness (P = 0.03 for GCL+IPL, P = 0.39 for macular RNFL).
Conclusions
We demonstrated that GCL+IPL thinning is most significantly correlated with both visual function and vision-specific QOL in MS, and may serve as a useful structural marker of disease. Our findings parallel those of magnetic resonance imaging studies that show gray matter disease is a marker of neurologic disability in MS.
Multiple sclerosis (MS) is an idiopathic, inflammatory–degenerative condition affecting the central nervous system. Optic neuritis (ON) is a common clinical manifestation of MS characterized by acute onset of visual acuity (VA) loss often accompanied by visual field loss, color desaturation, and pain with eye movement. Although most patients' VA recovers to baseline after an episode of ON, residual deficits in contrast sensitivity are common. Low-contrast letter acuity (LCLA) has been validated as a sensitive measure of visual impairment in MS clinical trials and detects residual disability in eyes of patients with a history of acute ON.
Optic atrophy and thinning of the peripapillary retinal nerve fiber layer (RNFL) are typical findings on ophthalmoscopic examination of patients with MS and a history of ON. Optical coherence tomography (OCT) has enabled measurement of peripapillary RNFL loss with micron-level resolution and excellent reproducibility.1–9 Cross-sectional and longitudinal studies of MS have demonstrated peripapillary RNFL thinning even among eyes with no history of acute ON. This retinal ganglion cell axonal loss correlates with worsening of visual function by LCLA and other tests of low-contrast vision.9–18
Neuronal loss is increasingly recognized as a correlate of disability in MS.19–24 Whereas investigations of time-domain OCT have shown reductions in total macular volume as a potential marker for neuronal loss in MS eyes, more specific measurement of the retinal ganglion cell layer (GCL) has only recently emerged after the introduction of high-resolution and high-speed spectral-domain (SD)-OCT techniques to study of MS.1–11,25–27 We used SD-OCT with a novel computerized retinal segmentation algorithm to determine how GCL neuronal loss relates to history of ON, RNFL thinning, visual function, and quality of life (QOL) in a heterogeneous MS cohort.
Materials and Methods
Subjects
We enrolled a convenience sample of patients with MS, diagnosed by standard clinical and neuroimaging criteria,28 from neuro-ophthalmology practices at the University of Pennsylvania. A detailed history and examination was performed to exclude patients with neurodegenerative diseases other than MS, as well as eyes with comorbid ocular conditions not related to MS (e.g., glaucoma). Healthy volunteers served as controls and were recruited from among staff, friends, and family members of patients. Control participants were excluded if they had a history of eye or neurologic disease (other than corrected, nonpathologic refractive error). Controls were also excluded if best-corrected high-contrast VA was <20/20 because this was considered evidence of an underlying comorbid ocular condition. Participants (patients and controls) with pathologic hyperopia or myopia (spherical refractive error greater than +8.00 or less than −8.00 diopters) were excluded. Institutional review board approval was obtained from the University of Pennsylvania for these studies. Written informed consent was obtained from all participants, and the research adhered to the tenets of the Declaration of Helsinki.
History of acute ON was assessed for each MS eye by patient self-report or physician report and confirmed by review of the patient's medical record. We excluded from these analyses patients with current or recent (<3 months before enrollment) attacks of ON to best capture the longer term effects of ON on retinal thickness.17 For this study, MS eyes with a history of ON were termed MS ON eyes, those without an ON history were MS non-ON eyes.
Visual Function Testing
All visual function testing was performed monocularly for each eye. Standard, high-contrast VA was assessed using Early Treatment Diabetic Retinopathy Study (ETDRS) charts at 3.2 m. The LCLA testing was performed at the 2.5% and 1.25% contrast levels using retroilluminated, low-contrast Sloan letter charts (Precision Vision, LaSalle, IL) at 2.0 m. Low-contrast Sloan letter and ETDRS charts have a similar standardized format with 5 letters per line. Numbers of letters identified (maximum of 70 per chart) were recorded for each eye. This scoring method provided continuous scale that is equivalent to the log minimal angle of resolution yet uses units that are more familiar to neurologists and that have been used in recent MS trials.13,29,30 Testing was performed by trained technicians experienced in research examinations. Standardized protocols, including written scripts and instructions, were followed. Snellen acuity equivalents were determined based on scores for ETDRS charts. Participants underwent detailed refractions to determine correlations with OCT that reflected best-corrected vision.
Clinically meaningful differences in visual function were summarized by determining whether the differences exceeded the amount that would be expected from repeated testing when there was no real change.31 For high-contrast VA, 2-line (10-letter) differences have been used traditionally as criteria for clinically meaningful change, based on studies of test–retest variability.31 However, recent studies have demonstrated that, in patients with relatively good VA, 5-letter or 1-line changes in high-contrast VA are unlikely to be due to testing error.32 Examination of our interrater reliability study data has revealed that 5 letters represents 2 standard deviations of interrater difference for VA in patients with MS. Correspondingly, 2 standard deviations of interrater difference for LCLA were equal to 7 letters.29 These values were used as criteria for visual loss in published studies involving OCT13 and are also used to determine clinically meaningful differences in the present study.
Quality of Life Assessment
Vision-related QOL was assessed using the 25-item National Eye Institute Visual Functioning Questionnaire (NEI-VFQ-25). This instrument has been validated as a reproducible metric of self-reported visual disability in patients with chronic eye diseases,10 including MS.33–37 The NEI-VFQ-25 was self-administered at the time of the study visit; when possible, participants completed all questionnaires before visual function testing. The NEI-VFQ-25 is the standard, vision-targeted QOL scale that is widely used in ophthalmologic research and clinical trials using established scoring methods.33 The NEI-VFQ-25 consists of 12 subscales; a composite (overall) score is generated as the unweighted average of all items, excluding the single item for general health. Scores for the NEI-VFQ-25 composite and subscales range from 0 to 100, with higher scores indicating better vision-specific QOL. The NEI-VFQ-25 has been used successfully to demonstrate reductions in QOL in patients with MS, ON, and other ophthalmologic disorders.33–38 Although some authors have suggested that 5-point changes in NEI-VFQ-25 scores are to be considered clinically significant,37 a more recent study of ophthalmologic clinical trial data demonstrated that 4-point differences in composite scores (and 5-point differences in subscale scores) are likely to represent clinically meaningful within-person changes for the NEI-VFQ-25.38 This level of difference in NEI-VFQ-25 score for the composite and several important subscales has been shown to correlate with clinically meaningful changes in VA and LCLA in patients with MS.36
A 10-item Neuro-Ophthalmic Supplement to the NEI-VFQ-25 was designed in a previous study by our group to target additional aspects of vision that may not be captured by the NEI-VFQ-25 in patients with MS and other neuro-ophthalmologic disorders.35,36 This new scale distinguished patients with MS from disease free controls to a significant degree in the prior study35,36 and demonstrated a capacity to capture self-reported visual dysfunction beyond that of the NEI-VFQ-25. Items and composite scores also showed appropriate degrees of internal consistency reliability. The 10-item supplement includes 10 items in a Likert scale format similar to that used in the NEI-VFQ-25, each of which is scored on a 0 to 100 scale. A composite (overall) score for the 10-item supplement is calculated as the unweighted average of the 10 items. Instructions and content for the 10-item supplement have been published35 and were designed based on survey and focus group data for patients with MS, ocular myasthenia gravis, and other disorders. In patients with MS, lower (worse) 10-item supplement overall and subscale scores are associated with reduced visual function by LCLA and VA.35,36
Optical Coherence Tomography
After patients completed visual function testing, OCT scanning was performed for both eyes of each participant using the Cirrus high-resolution SD-OCT system (Carl Zeiss Meditec, Dublin, CA). Scans were performed by trained technicians after visual function testing. An internal fixation target was used to improve reproducibility, and a patch was placed over the nontested eye. Scans were performed without flash photography to optimize patient comfort. If the pupils were large enough to permit adequate imaging (≥5 mm), scanning was completed without the use of mydriatic drops. Dilation has little impact on OCT values and reproducibility, and previous studies of MS patients have been performed without uniform use of mydriatics.12,13 Pupils were dilated with 1% tropicamide when necessary. Good quality scans were defined according to specifications in the user manual; criteria included signal strength ≥7 (maximum 10), centering of the scan, and uniform brightness.
Two OCT scanning protocols were performed on each eye. The ONH cube protocol computes the RNFL thickness along 2.4-mm diameter circles around the optic disc. The Macular Cube 200×200 and 512×128 scanning protocols were used to image a 6×6×2 mm3 cube of macular tissue centered on the fovea. The 512×128 protocol coregisters 128 horizontal line scans with 512 A-scans, providing greater horizontal sampling density at the expense of a modest decrease in vertical sampling density when compared with the Macular Cube 200×200 scan protocol. However, images from both protocols are processed frame to frame such that the segmentation performance and measurements are not affected by the protocol used.
Macular Segmentation Algorithm
Raw data files obtained from the Macular Cube scanning protocol were exported to an IBM-compatible computer and subjected to a segmentation algorithm developed by Drs Ishikawa and Schuman at the University of Pittsburgh. This algorithm was developed using an adaptive thresholding approach in the Xcode (Apple Computer, Cupertino, CA) software development environment as previously described.27 Briefly, the algorithm analyzes the OCT A-scan profile in a stepwise fashion to define borders between retinal substructures based on the reflectivity characteristics of the tissue. Incorporation of an automated integrity check improved the robustness of algorithm performance.
Using this algorithm, the macula was segmented into 4 retinal layers (Fig 1). Because the GCL cannot be reliably separated from the thin inner plexiform layer (IPL), even using the newer SD-OCT techniques, GCL thickness was estimated as GCL+IPL. In previous studies of glaucoma, the GCL and IPL have been combined because of relatively poor segmentation performance to define these individual layers.25,27 Macular RNFL and outer retinal layers (inner nuclear layer/outer plexiform layer [INL+OPL], outer nuclear layer/photoreceptor layer [ONL+PRL]) were also measured. The combination of macular RNFL+GCL+IPL was calculated because this has been a sensitive measure for detecting retinal thinning in other disorders such as glaucoma.25,27 Global average thickness was computed for each layer within the 6-mm diameter centered at the foveola. Average thicknesses were also calculated for each of the macular areas: A central 1-mm disc (representing the foveal area), as well as inner and outer rings (from 2 to 3 mm and 3 to 6 mm, respectively), subdivided into superior, nasal, inferior, and temporal quadrants.
Figure 1.
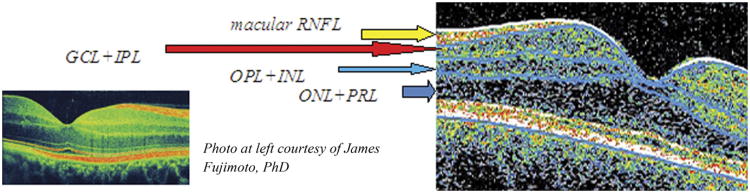
Vertical spectral-domain optical coherence tomography (OCT) section of right eye macula illustrating retinal segmentation techniques. The software algorithm delineates 4 macular layers: (1) Macular retinal nerve fiber layer (RNFL); (2) ganglion cell layer and inner plexiform layer (GCL+IPL); (3) outer plexiform layer and inner nuclear layer (OPL+INL); and (4) outer nuclear layer and photoreceptor layer (ONL+PRL). The software also calculates segmental thickness in 3 concentric circles with diameters of 1, 3, and 6 mm divided into equal quadrants in a diagonal orientation, similar to the pattern provided in commercial OCT.
Statistical Analysis
All data analyses were performed using Stata statistical software, version 11.1 (StataCorp, College Station, TX). Generalized estimating equation (GEE) models, accounting for age and adjusting for within-patient, intereye correlations, were used in primary analyses to determine the relation of GCL+IPL and other retinal layer thicknesses to visual function and QOL scores. The GEE regression models are generalized linear models that allow for specification of within-group correlations when examining the capacity of 1 or several independent variables to predict a dependent variable. The GEE models were used in this study to determine how well visual function or QOL (NEI-VFQ-25) scores predicted retinal layer thicknesses, accounting simultaneously for age. Because both eyes of each MS patient and control were included in this study, and because eyes of the same patient would be expected to have some degree of intercorrelation with respect to visual function and retinal thickness by OCT, GEE models allowed us to adjust for these within-patient, intereye correlations. The GEE models were also used to compare patient (MS eyes, MS ON eyes, and MS non-ON eyes) and disease-free control groups with respect to retinal thickness values. A type I error level of α = 0.05 was used for statistical significance.
Results
Patients with MS (n = 122; 239 eyes) and disease-free controls (n = 31; 61 eyes) underwent vision testing and OCT imaging. A few MS (n = 5) and control eyes (n = 1) were excluded because the macular OCT signal strength was <7. The demographic and clinical characteristics are presented in Table 1. Of these demographic variables, only age is known to influence retinal thickness parameters.39 Therefore, we included age as a covariate in our GEE regression models. Snellen equivalents for mean VA were ≥20/20 for both MS and disease-free control eyes (mean ETDRS VA scores ≥ 58; Table 1). The MS cohort was predominantly of the relapsing–remitting clinical disease subtype (n = 105 [207 eyes]; 87% of patients); 5 patients (10 eyes) had presented as clinically isolated syndromes and subsequently met McDonald criteria for MS (clinically isolated syndrome, 2 patients with a history of unilateral ON) and 12 patients (22 eyes) had secondary-progressive MS.
Table 1. Demographic and Clinical Characteristics for Patients and Disease-Free Controls.
| Disease-Free Controls Versus MS Patients | MS Eyes with ON Versus Non-ON | |||||
|---|---|---|---|---|---|---|
|
|
|
|||||
| Controls (n = 31; 61 eyes) | MS Patients(n = 122; 239 eyes) | MS ON(n = 87 eyes) | Non-ON(n = 150 eyes) | |||
| Age, yrs, mean (SD) | 40.7 (13.6) | 46.9 (10.7)* | 45.9 (11.5) | 47.5 (10.5) | ||
| Female (%) | 75.4 | 74.5 | 82.8 | 70.0 | ||
| Caucasian (%) | 87.5 | 92.2 | 94.7 | 91.4 | ||
| Age (yrs) at diagnosis of disease, mean (SD) | — | 38.1 (10.3) | 34.9 (9.9) | 39.9 (10.1) | ||
| Duration of disease, yrs, mean (SD) | — | 8.8 (7.8) | 11.0 (8.6) | 7.6 (7.1) | ||
| EDSS, median (range) | — | 1.5 (0.0–7.5) | 1.5 (1.0–7.5) | 1.5 (0.0–3.5) | ||
| High-contrast VA,† mean (SD) | 64.1 (5.1) | 58.9 (7.7) | 57.5 (9.4) | 59.9 (6.4) | ||
| 2.5% LCLA,‡ mean (SD) | 33.6 (7.5) | 26.2 (10.8) | 22.4 (12.4) | 28.3 (9.2) | ||
| 1.25% LCLA,‡ mean (SD) | 24.8 (7.4) | 15.6 (10.4) | 11.4 (10.6) | 18.0 (9.6) | ||
| NEI-VFQ-25 Composite, mean (SD) | 95.9 (3.8) | 88.3 (12.7) | 85.2 (14.2) | 89.6 (11.7) | ||
| 10-item Supplement, mean (SD) | 96.6 (3.3) | 86.7 (12.9) | 82.7 (14.4) | 88.4 (11.7) | ||
EDSS = Expanded Disability Status Scale; LCLA = low contrast letter acuity; MS = multiple sclerosis; NEI-VFQ-25 = 25-item National Eye Institute Visual Function Questionnaire; ON = optic neuritis; SD = standard deviation; VA = visual acuity; 10-item Supplement = 10-item Neuro-Ophthalmic Supplement to the NEI-VFQ-25.
Age was significantly greater in patients with MS compared with controls (P = 0.007), 2-sample t test. Age was therefore accounted for in all analyses.
Letters seen correctly on Early Treatment Diabetic Retinopathy Study charts at 3.2 m.
Letters seen correctly on Sloan LCLA charts at 2.0 m.
Peripapillary RNFL thickness was reduced in MS eyes (84.3 ± 12.8 μm) relative to eyes of disease-free controls (92.9 ± 10.0 μm; P<0.001; GEE models accounting for age and within-patient, intereye correlations). For the macula, RNFL and GCL+IPL were also significantly reduced in MS versus control eyes, as was the combination of macular RNFL+GCL+IPL (Fig 2; Table 2). There were no differences for the outer retinal layers (OPL+INL and ONL+PRL) between MS patient and control eyes.
Figure 2.

Spectral-domain optical coherence tomography thicknesses (in μm) for eyes of patients with multiple sclerosis (MS) versus disease-free controls. Mean values for peripapillary retinal nerve fiber layer (RNFL), macular RNFL, ganglion cell layer, and inner plexiform layer (GCL+IPL), and the combination of macular RNFL+GCL+IPL were significantly lower for MS eyes versus controls (P values are from generalized estimating equation models, accounting for age and within-patient, intereye correlations). INL = inner nuclear layer; ONL = outer nuclear layer; OPL = outer plexiform layer; PRL = photoreceptor layer.
Table 2. Retinal Layer Thickness Measurements by Optical Coherence Tomography for Multiple Sclerosis and Control Eyes.
| Disease-Free Controls Versus MS Eyes | MS Eyes with ON Versus Non-ON Eyes | |||||
|---|---|---|---|---|---|---|
|
|
|
|||||
| Controls(n = 31; 61 eyes) | MS Patients(n = 122; 239 eyes) | MS ON(n = 87 eyes) | Non-ON(n = 150 eyes) | |||
| Macular RNFL, mean (SD) | 29.6 (6.0) | 23.4 (8.2) | 19.9 (9.0) | 25.5 (7.1) | ||
| GCL+IPL, mean (SD) | 88.9 (6.9) | 84.1 (8.4) | 79.7 (9.1) | 86.8 (6.6) | ||
| Macular RNFL+GCL+IPL, | 118.5 (11.2) | 107.6 (15.3) | 99.6 (16.8) | 112.3 (12.2) | ||
| mean (SD) | ||||||
| OPL+INL, mean (SD) | 43.4 (4.5) | 44.9 (5.1) | 45.0 (5.6) | 44.9 (4.9) | ||
| ONL+PRL, mean (SD) | 142.3 (7.0) | 142.1 (6.2) | 142.7 (6.6) | 141.6 (6.0) | ||
| Peripapillary RNFL, mean (SD) | 92.9 (9.9) | 84.3 (12.8) | 78.4 (13.6) | 87.6 (11.1) | ||
GCL = ganglion cell layer; INL = inner nuclear layer; IPL = inner plexiform layer; MS = multiple sclerosis; ON= optic neuritis; ONL = outer nuclear layer; OPL = outer plexiform layer; PRL = photoreceptor layer; RNFL = retinal nerve fiber layer; SD = standard deviation;
Exploratory analyses of MS clinical subtype as a categorical variable showed evidence for thinner macular RNFL, GCL+IPL, and combination macular RNFL+GCL+IPL in relapsing-remitting clinical disease subtype and secondary-progressive MS compared with eyes of patients with clinically isolated syndromes (P≤ 0.01 for all comparisons; GEE models, accounting for age and within-patient, intereye correlations).
When comparing MS eyes with versus without a history of ON (Fig 3; Table 2), MS ON eyes (78.4±13.6 μm) had significant reductions in peripapillary RNFL thickness compared with MS non-ON eyes (87.6±11.1 μm; P<0.001). Macular RNFL (20.0±9.0 vs 25.5±7.1 μm), GCL+IPL (79.7±9.2 vs 86.8±6.6 μm) and the combination of macular RNFL+GCL+IPL thicknesses (99.6±16.8 vs 112.3±12.2 μm) were also significantly lower for MS ON versus non-ON eyes (P<0.001).
Figure 3.

Spectral-domain optical coherence tomography thicknesses (in μm) for eyes of patients with multiple sclerosis (MS) with a history of acute optic neuritis (ON) before study enrollment (MS ON eyes) versus MS eyes without an ON history (MS non-ON eyes). Mean values for peripapillary retinal nerve fiber layer (RNFL), macular RNFL, ganglion cell layer plus inner plexiform layer (GCL+IPL), and the combination of macular RNFL+GCL+IPL were significantly lower for MS ON eyes versus MS non-ON eyes (P values are from generalized estimating equation models, accounting for age and within-patient, intereye correlations). INL = inner nuclear layer; ONL = outer nuclear layer; OPL = outer plexiform layer; PRL = photoreceptor layer.
For every 10-μm reduction in peripapillary RNFL thickness (10.8% reduction from control mean), we found a corresponding loss in macular RNFL of 3.4 μm (11.5% reduction; P<0.001), and loss of GCL+IPL of 4.2 μm (4.7% reduction; P<0.001, GEE models accounting for age and intereye correlations; Table 3). Thickness of the OPL+INL and ONL+PRL did not correlate significantly with peripapillary RNFL thickness among MS eyes in this cohort (Table 2). Clinically meaningful reductions in visual function, predefined as ≥5 letters for high-contrast VA and ≥7 letters for LCLA at 2.5% and 1.25% contrast, were associated with thinning of the peripapillary RNFL, macular RNFL, and GCL + IPL (P<0.001, GEE models; Table 3).
Table 3. Optical Coherence Tomography Changes Corresponding with Clinically Significant Impairment of Vision and Vision-Specific Quality of Life in Multiple Sclerosis (n = 122, 239 eyes).
| Macular RNFL Thickness | GCL+IPL Thickness | Macular RNFL+GCL+IPL Thickness | OPL+INL Thickness | ONL+PRL Thickness | Peripapillary RNFL Thickness | |
|---|---|---|---|---|---|---|
| VA (μm per line [5 letters] of acuity) | 1.3 | 1.3 | 2.7 | −0.6 | −0.3 | 2.2 |
| P | <0.001 | 0.001 | <0.001 | 0.002 | 0.25 | <0.001 |
| 2.5% LCLA (μm per 7 letters of acuity) | 1.9 | 1.9 | 3.8 | −0.7 | −0.8 | 3.3 |
| P | <0.001 | <0.001 | <0.001 | <0.001 | <0.001 | <0.001 |
| 1.25% LCLA (μm per 7 letters of acuity) | 1.9 | 2.4 | 4.3 | −0.5 | −0.9 | 3.3 |
| P | <0.001 | <0.001 | <0.001 | 0.01 | 0.01 | <0.001 |
| NEI-VFQ-25 composite score (μm per 5 points) | 0.7 | 0.9 | 1.6 | 0.02 | −0.2 | 1.0 |
| P | 0.006 | <0.001 | <0.001 | 0.89 | 0.50 | 0.03 |
| 10-item supplement composite score (μm per 5 points) | 0.8 | 1.0 | 1.7 | 0.04 | −0.2 | 1.0 |
| P | 0.002 | <0.001 | <0.001 | 0.78 | 0.44 | 0.05 |
| Peripapillary RNFL loss (μm per 10am RNFL) | 3.4 | 4.2 | 7.6 | −0.26 | −0.12 | — |
| P | <0.001 | <0.001 | <0.001 | 0.31 | 0.69 |
GCL = ganglion cell layer; INL = inner nuclear layer; IPL = inner plexiform layer; LCLA = low contrast letter acuity; NEI-VFQ-25 = National Eye Institute Visual Function Questionnaire; ONL = outer nuclear layer; OPL = outer plexiform layer; PRL = photoreceptor layer; RNFL = retinal nerve fiber layer; VA = visual acuity.
Letters seen correctly on Early Treatment Diabetic Retinopathy Study charts at 3.2 m.
Letters seen correctly on Sloan LCLA charts at 2.0 m.
P-values reflect generalized estimating equation models accounting for age and within-patient intereye correlations.
The GCL + IPL (P<0.001 for NEI-VFQ-25 composite and for the 10-item Neuro-Ophthalmic Supplement composite score; Table 3), macular RNFL (P = 0.006 for NEI-VFQ-25; P = 0.002 for supplement), and the combination of macular RNFL+GCL+IPL (P<0.001 for NEI-VFQ-25 and supplement) were the OCT measurements for which thinning was most strongly associated with lower (worse) QOL. Correlations of GCL+IPL thickness with visual function and QOL were significant even in models accounting simultaneously for macular RNFL thickness (P = 0.03 GCL + IPL; P = 0.39 for macular RNFL in these GEE models). The relation of GCL + IPL thickness with LCLA (2.5%: r = 0.49; P<0.0001) and NEI-VFQ-25 composite (r = 0.31; P = 0.0006) was linear (Fig 4), and these correlations were significant. Outer retinal thicknesses (OPL+INL and ONL+PRL) did not correlate with ON history or with worsening of RNFL thickness, vision, or QOL in this cohort.
Figure 4.

Scatter plot and fitted linear regression line showing relation of ganglion cell layer plus inner plexiform layer (GCL + IPL) thickness to 25-item National Eye Institute Visual Functioning Questionnaire (NEI-VFQ-25) composite scores and low-contrast acuity at 2.5% level. The regression lines represent fitted values for mean GCL + IPL thickness for each value of NEI-VFQ-25 or low-contrast acuity; the gray shaded areas show the 95% confidence intervals from the standard errors of the predictions for the fitted lines. This graph for all multiple sclerosis eyes illustrates that there are very few outliers with respect to quality of life (QOL) or low-contrast acuity. Linear correlations were significant. Accounting for age and adjusting for within-patient, intereye correlations, the relation of QOL and low-contrast acuity to GCL + IPL thickness was significant (P<0.001, generalized estimating equation models).
Discussion
Results of these investigations demonstrate that retinal GCL+IPL neuronal loss is strongly related to visual function and QOL in MS, and is observed among MS eyes with and without a history of acute ON. Our findings parallel those of magnetic resonance imaging studies of gray matter atrophy and suggest that retinal neuronal degeneration is closely associated with visual disability in MS.19–24 Importantly, our study provides a link between structural aspects of visual pathway axonal and neuronal loss and patient-reported visual disability as measured by established QOL instruments. Retinal segmentation should permit the longitudinal study of neuronal and axonal loss in ON, MS, and other optic neuropathies.
Loss of peripapillary RNFL is a well-documented structural marker of axonal degeneration in MS eyes with and without a history of ON1–4,8–18 Historically, OCT studies in MS have focused mostly on the peripapillary RNFL, but retinal ganglion cell neuronal loss may also be implicated in the pathogenesis of visual dysfunction in MS. Histopathologic analyses of postmortem MS eyes has identified loss of INL neurons in addition to GCL atrophy.40 The results of our study expand on this observation by providing a more detailed measurement of the retinal axonal and neuronal degeneration in MS patients and controls. In this study, we investigated changes in the axonal (RNFL) and neuronal (GCL + IPL, RNFL + GCL + IPL, OPL + INL, and ONL + PRL) components of the macula. Analogously, magnetic resonance imaging studies have refined segmentation techniques that enable quantitation of cortical gray matter within lesions and normal brain.22
Overall, MS eyes in our study had significant thinning of the macular RNFL and GCL+IPL compared with disease-free control eyes (Fig 2). After a prior episode of ON, one would expect retrograde degeneration of the RNFL axons and their associated ganglion cell bodies. As such, the degree of macular RNFL and GCL+IPL thinning is much greater when comparing MS ON eyes versus non-ON eyes (Fig 3; Table 2), as is the combination of macular RNFL+GCL + IPL. These findings are consistent with our studies of total macular volume (before the availability of retinal segmentation) as determined by time-domain OCT.16
Previous studies have shown significant peripapillary RNFL dropout even in MS non-ON eyes.1–4,8–18 In our cohort, we noted significant thinning of the macular RNFL in MS non-ON eyes versus controls, whereas GCL+IPL and other retinal layers did not differ from controls. Correspondingly, the combination of macular RNFL+GCL+IPL distinguished MS non-ON versus control eyes, but not to a highly significant degree (P = 0.03). This pattern of injury may be explained by subclinical episodes of ON or by some other susceptibility to axonal loss with relative sparing of the retinal GCL.41,42 Other investigations have suggested the existence of a primary retinal neuronopathy in MS, predominantly affecting the outer segment of the retina and sparing the GCL.10,40 These patients with a macular thinning predominant phenotype have worse MS severity scores and electroretinographic characteristics that may distinguish them from other MS patients.10 However, in this cohort of MS patients, we did not demonstrate thinning of the outer retinal layers. Although other recent studies have shown reductions in cone densities among patients with glaucomatous and nonglaucomatous optic neuropathies,43 investigations of glaucoma with computerized OCT segmentation algorithms such as those used in our study have demonstrated that thinning of the inner retinal layers (GCL+IPL and macular RNFL) best identifies diseased versus control eyes.26,27 Perhaps some of the findings noted in these studies reflect differences in resolution between OCT techniques. In a recent study by Saidha et al,44 GCL+IPL was reduced in eyes of patients with MS and correlated well with visual function using a Zeiss manufacturer-based algorithm.
In our study, all measures of visual function were significantly correlated with peripapillary RNFL as well as macular RNFL and GCL + IPL thickness (Table 2). Peripapillary RNFL, macular RNFL, GCL + IPL, and the combination of macular RNFL+GCL + IPL were significantly correlated with NEI-VFQ-25 and 10-item supplement scores (Table 3). Our findings suggest that GCL+IPL thickness represents a potentially important structural marker of visual disability in MS given its high degree of correlation with VA, LCLA, and vision-specific QOL measures, and macular RNFL+GCL+IPL may give the most complete picture of disease activity in MS and ON, depending on whether axonal loss, neuronal degeneration, or a combination are the focus of a therapy or study. Because ganglion cell bodies in the retina are analogous to gray matter in the central nervous system, the finding is consistent with magnetic resonance imaging studies of the brain that show that gray matter atrophy is a better predictor of neurologic disability than the burden of white matter disease in MS.19,20
In conclusion, OCT imaging combined with computerized macular segmentation algorithms will be important for future investigations of neuronal and axonal loss in ON, MS, and other optic neuropathies.45,46 Further studies are needed to investigate the spatial and temporal associations between axonal injury and ganglion cell loss. By determining the natural history of ganglion cell injury in ON and MS, GCL+IPL thinning may serve as an important outcome measure in clinical trials that examine the efficacy of neuroprotective and neurorepair agents.
Acknowledgments
Supported in part by the National Institutes of Health, Bethesda, Maryland (grant nos.: R01 EY 014993; K24 EY 018136); National Multiple Sclerosis Society, New York, New York (grant nos. RG 3428A2/1; TR 3760-A-3); the McNeill Foundation; the DADs Foundation; and the Jeffrey Berger Medical Student Research Award.
Footnotes
Presented at: the North American Neuro-Ophthalmology Society, February 8, 2011, Vancouver, BC, Canada, and Association for Research in Vision and Ophthalmology Annual Meetings, May 1–5, 2011, Fort Lauderdale, Florida.
Financial Disclosure(s): The authors have made the following disclosures: Steven L. Galetta – Honoraria – Biogen-Idec, Teva, Novartis. Peter A. Calabresi – Personal compensation for consulting and serving on scientific advisory boards – Biogen Idec, Teva, Vaccinex, Abbott, Novartis; Research funding – Biogen Idec, Teva, EMD Serono, Vertex, Genentech, Abbott, Bayer.
Elliot Frohman – Speaker fees – Biogen, Teva, Novartis, Acorda, Bayer; Consulting fees –Biogen, Teva, Acorda, Novartis, Abbott. Laura J. Balcer – Honoraria – Biogen-Idec, Novartis, Bayer Vaccinex.
References
- 1.Galetta KM, Calabresi PA, Frohman EM, Balcer LJ. Optical coherence tomography (OCT): imaging the visual pathway as a model for neurodegeneration. Neurotherapeutics. 2011;8:117–32. doi: 10.1007/s13311-010-0005-1. [DOI] [PMC free article] [PubMed] [Google Scholar]
- 2.Syc SB, Warner CV, Hiremath GS, et al. Reproducibility of high-resolution optical coherence tomography in multiple sclerosis. Mult Scler. 2010;16:829–39. doi: 10.1177/1352458510371640. [DOI] [PubMed] [Google Scholar]
- 3.Cettomai D, Pulicken M, Gordon-Lipkin E, et al. Reproducibility of optical coherence tomography in multiple sclerosis. Arch Neurol. 2008;65:1218–22. doi: 10.1001/archneur.65.9.1218. [DOI] [PubMed] [Google Scholar]
- 4.Watson GM, Keltner JL, Chin EK, et al. Comparison of retinal nerve fiber layer and central macular thickness measurements among five different optical coherence tomography instruments in patients with multiple sclerosis and optic neuritis. J Neuroophthalmol. 2011;31:110–6. doi: 10.1097/WNO.0b013e3181facbbd. [DOI] [PubMed] [Google Scholar]
- 5.Garcia-Martin E, Pinilla I, Idoipe M, et al. Intra and interoperator reproducibility of retinal nerve fibre and macular thickness measurements using Cirrus Fourier-domain OCT [report online] Acta Ophthalmol. 2011;89:e23–9. doi: 10.1111/j.1755-3768.2010.02045.x. [DOI] [PubMed] [Google Scholar]
- 6.Sull AC, Vuong LN, Price LL, et al. Comparison of spectral/Fourier domain optical coherence tomography instruments for assessment of normal macular thickness. Retina. 2010;30:235–45. doi: 10.1097/IAE.0b013e3181bd2c3b. [DOI] [PMC free article] [PubMed] [Google Scholar]
- 7.Wollstein G, Kagemann L, Bilonick RA, et al. Retinal nerve fibre layer and visual function loss in glaucoma: the tipping point. Br J Ophthalmol. 2012;96:47–52. doi: 10.1136/bjo.2010.196907. [DOI] [PMC free article] [PubMed] [Google Scholar]
- 8.Petzold A, de Boer JF, Schippling S, et al. Optical coherence tomography in multiple sclerosis: a systematic review and meta-analysis. Lancet Neurol. 2010;9:921–32. doi: 10.1016/S1474-4422(10)70168-X. [DOI] [PubMed] [Google Scholar]
- 9.Barkhof F, Calabresi P, Miller DH, Reingold SC. Imaging outcomes for neuroprotection and repair in multiple sclerosis trials. Nat Rev Neurol. 2009;5:256–66. doi: 10.1038/nrneurol.2009.41. [DOI] [PubMed] [Google Scholar]
- 10.Saidha S, Syc SB, Ibrahim MA, et al. Primary retinal pathology in multiple sclerosis as detected by optical coherence tomography. Brain. 2011;134:518–33. doi: 10.1093/brain/awq346. [DOI] [PubMed] [Google Scholar]
- 11.Davies EC, Galetta KM, Sackel DJ, et al. Retinal ganglion cell layer volumetric assessment by spectral-domain optical coherence tomography in multiple sclerosis: application of a high-precision manual estimation technique. J Neuroophthalmol. 2011;31:260–4. doi: 10.1097/WNO.0b013e318221b434. [DOI] [PMC free article] [PubMed] [Google Scholar]
- 12.Fisher JB, Jacobs DA, Markowitz CE, et al. Relation of visual function to retinal nerve fiber layer thickness in multiple sclerosis. Ophthalmology. 2006;113:324–32. doi: 10.1016/j.ophtha.2005.10.040. [DOI] [PubMed] [Google Scholar]
- 13.Talman LS, Bisker ER, Sackel DJ, et al. Longitudinal study of vision and retinal nerve fiber layer thickness in multiple sclerosis. Ann Neurol. 2010;67:749–60. doi: 10.1002/ana.22005. [DOI] [PMC free article] [PubMed] [Google Scholar]
- 14.Pueyo V, Ara JR, Almarcegui C, et al. Sub-clinical atrophy of the retinal nerve fibre layer in multiple sclerosis. Acta Ophthalmol. 2010;88:748–52. doi: 10.1111/j.1755-3768.2009.01527.x. [DOI] [PubMed] [Google Scholar]
- 15.Merle H, Olindo S, Donnio A, et al. Retinal nerve fiber layer thickness and spatial and temporal contrast sensitivity in multiple sclerosis. Eur J Ophthalmol. 2010;20:158–66. doi: 10.1177/112067211002000122. [DOI] [PubMed] [Google Scholar]
- 16.Burkholder BM, Osborne B, Loguidice MJ, et al. Macular volume determined by optical coherence tomography as a measure of neuronal loss in multiple sclerosis. Arch Neurol. 2009;66:1366–72. doi: 10.1001/archneurol.2009.230. [DOI] [PubMed] [Google Scholar]
- 17.Henderson AP, Trip SA, Schlottmann PG, et al. An investigation of the retinal nerve fibre layer in progressive multiple sclerosis using optical coherence tomography. Brain. 2008;131:277–87. doi: 10.1093/brain/awm285. [DOI] [PubMed] [Google Scholar]
- 18.Salter AR, Conger A, Frohman TC, et al. Retinal architecture predicts pupillary reflex metrics in MS. Mult Scler. 2009;15:479–86. doi: 10.1177/1352458508100503. [DOI] [PubMed] [Google Scholar]
- 19.Fisher E, Lee JC, Nakamura K, Rudick RA. Gray matter atrophy in multiple sclerosis: a longitudinal study. Ann Neurol. 2008;64:255–65. doi: 10.1002/ana.21436. [DOI] [PubMed] [Google Scholar]
- 20.Fisniku LK, Chard DT, Jackson JS, et al. Gray matter atrophy is related to long-term disability in multiple sclerosis. Ann Neurol. 2008;64:247–54. doi: 10.1002/ana.21423. [DOI] [PubMed] [Google Scholar]
- 21.Chard D, Miller D. Grey matter pathology in clinically early multiple sclerosis: evidence from magnetic resonance imaging. J Neurol Sci. 2009;282:5–11. doi: 10.1016/j.jns.2009.01.012. [DOI] [PubMed] [Google Scholar]
- 22.Shiee N, Bazin PL, Ozturk A, et al. A topology-preserving approach to the segmentation of brain images with multiple sclerosis lesions. NeuroImage. 2010;49:1524–35. doi: 10.1016/j.neuroimage.2009.09.005. [DOI] [PMC free article] [PubMed] [Google Scholar]
- 23.Filippi M, Rocca MA, Calabrese M, et al. Intracortical lesions: relevance for new MRI diagnostic criteria for multiple sclerosis. Neurology. 2010;75:1988–94. doi: 10.1212/WNL.0b013e3181ff96f6. [DOI] [PubMed] [Google Scholar]
- 24.Pitt D, Boster A, Pei W, et al. Imaging cortical lesions in multiple sclerosis with ultra-high-field magnetic resonance imaging. Arch Neurol. 2010;67:812–8. doi: 10.1001/archneurol.2010.148. [DOI] [PubMed] [Google Scholar]
- 25.Tan O, Li G, Lu AT, et al. Mapping of macular substructures with optical coherence tomography for glaucoma diagnosis. Ophthalmology. 2008;115:949–56. doi: 10.1016/j.ophtha.2007.08.011. [DOI] [PMC free article] [PubMed] [Google Scholar]
- 26.Tan O, Chopra V, Lu AT, et al. Detection of macular ganglion cell loss in glaucoma by Fourier-domain optical coherence tomography. Ophthalmology. 2009;116:2305–14. doi: 10.1016/j.ophtha.2009.05.025. [DOI] [PMC free article] [PubMed] [Google Scholar]
- 27.Ishikawa H, Stein DM, Wollstein G, et al. Macular segmentation with optical coherence tomography. Invest Ophthalmol Vis Sci. 2005;46:2012–7. doi: 10.1167/iovs.04-0335. [DOI] [PMC free article] [PubMed] [Google Scholar]
- 28.McDonald WI, Compston A, Edan G, et al. Recommended diagnostic criteria for multiple sclerosis: guidelines from the International Panel on the diagnosis of multiple sclerosis. Ann Neurol. 2001;50:121–7. doi: 10.1002/ana.1032. [DOI] [PubMed] [Google Scholar]
- 29.Balcer LJ, Baier ML, Pelak VS, et al. New low-contrast vision charts: reliability and test characteristics in patients with multiple sclerosis. Mult Scler. 2000;6:163–71. doi: 10.1177/135245850000600305. [DOI] [PubMed] [Google Scholar]
- 30.Balcer LJ, Galetta SL, Calabresi PA, et al. Natalizumab reduces visual loss in patients with relapsing multiple sclerosis. Neurology. 2007;68:1299–304. doi: 10.1212/01.wnl.0000259521.14704.a8. [DOI] [PubMed] [Google Scholar]
- 31.Rosser DA, Cousens SN, Murdoch IE, et al. How sensitive to clinical change are ETDRS logMAR visual acuity measurements? Invest Ophthalmol Vis Sci. 2003;44:3278–81. doi: 10.1167/iovs.02-1100. [DOI] [PubMed] [Google Scholar]
- 32.Beck RW, Maguire MG, Bressler NM, et al. Visual acuity as an outcome measure in clinical trials of retinal diseases. Ophthalmology. 2007;114:1804–9. doi: 10.1016/j.ophtha.2007.06.047. [DOI] [PubMed] [Google Scholar]
- 33.Mangione CM, Lee PP, Gutierrez PR, et al. National Eye Institute Visual Function Questionnaire Field Test Investigators. Development of the 25-item National Eye Institute Visual Function Questionnaire. Arch Ophthalmol. 2001;119:1050–8. doi: 10.1001/archopht.119.7.1050. [DOI] [PubMed] [Google Scholar]
- 34.Cole SR, Beck RW, Moke PS, et al. Optic Neuritis Study Group. The National Eye Institute Visual Function Questionnaire: experience of the ONTT. Invest Ophthalmol Vis Sci. 2000;41:1017–21. [PubMed] [Google Scholar]
- 35.Raphael BA, Galetta KM, Jacobs DA, et al. Validation and test characteristics of a 10-item neuro-ophthalmic supplement to the NEI-VFQ-25. Am J Ophthalmol. 2006;142:1026–35. doi: 10.1016/j.ajo.2006.06.060. [DOI] [PubMed] [Google Scholar]
- 36.Mowry EM, Loguidice MJ, Daniels AB, et al. Vision related quality of life in multiple sclerosis: correlation with new measures of low and high contrast letter acuity. J Neurol Neurosurg Psychiatry. 2009;80:767–72. doi: 10.1136/jnnp.2008.165449. [DOI] [PubMed] [Google Scholar]
- 37.Globe DR, Wu J, Azen SP, Varma R. Los Angeles Latino Eye Study Group. The impact of visual impairment on self-reported visual functioning in Latinos: the Los Angeles Latino Eye Study. Ophthalmology. 2004;111:1141–9. doi: 10.1016/j.ophtha.2004.02.003. [DOI] [PubMed] [Google Scholar]
- 38.Submacular Surgery Trials Research Group. Evaluation of minimum clinically meaningful changes in scores on the National Eye Institute Visual Function Questionnaire (NEI-VFQ): SST report number 19. Ophthalmic Epidemiol. 2007;14:205–15. doi: 10.1080/09286580701502970. [DOI] [PubMed] [Google Scholar]
- 39.Sung KR, Wollstein G, Bilonick RA, et al. Effects of age on optical coherence tomography measurements of healthy retinal nerve fiber layer, macula, and optic nerve head. Ophthalmology. 2009;116:1119–24. doi: 10.1016/j.ophtha.2009.01.004. [DOI] [PMC free article] [PubMed] [Google Scholar]
- 40.Green AJ, McQuaid S, Hauser SL, et al. Ocular pathology in multiple sclerosis: retinal atrophy and inflammation irrespective of disease duration. Brain. 2010;133:1591–601. doi: 10.1093/brain/awq080. [DOI] [PMC free article] [PubMed] [Google Scholar]
- 41.Su KG, Banker G, Bourdette D, Forte M. Axonal degeneration in multiple sclerosis: the mitochondrial hypothesis. Curr Neurol Neurosci Rep. 2009;9:411–7. doi: 10.1007/s11910-009-0060-3. [DOI] [PMC free article] [PubMed] [Google Scholar]
- 42.Zheng J, Bizzozero OA. Decreased activity of the 20S proteasome in the brain white matter and gray matter of patients with multiple sclerosis. J Neurochem. 2011;117:143–53. doi: 10.1111/j.1471-4159.2011.07182.x. [DOI] [PMC free article] [PubMed] [Google Scholar]
- 43.Werner JS, Keltner JL, Zawadzki RJ, Choi SS. Outer retinal abnormalities associated with inner retinal pathology in non-glaucomatous and glaucomatous optic neuropathies. Eye. 2011;25:279–89. doi: 10.1038/eye.2010.218. [DOI] [PMC free article] [PubMed] [Google Scholar]
- 44.Saidha S, Syc SB, Durbin MK, et al. Visual dysfunction in multiple sclerosis correlates better with optical coherence tomography derived estimates of macular ganglion cell thickness than peripapillary retinal nerve fiber layer thickness. Mult Scler. 2011;17:1449–63. doi: 10.1177/1352458511418630. [DOI] [PubMed] [Google Scholar]
- 45.Shindler KS, Ventura E, Dutt M, et al. Oral resveratrol reduces neuronal damage in a model of multiple sclerosis. J Neuroophthalmol. 2010;30:328–39. doi: 10.1097/WNO.0b013e3181f7f833. [DOI] [PMC free article] [PubMed] [Google Scholar]
- 46.Gunnarsson M, Malmeström C, Axelsson M, et al. Axonal damage in relapsing multiple sclerosis is markedly reduced by natalizumab. Ann Neurol. 2011;69:83–9. doi: 10.1002/ana.22247. [DOI] [PubMed] [Google Scholar]