

Abstract
Objective
We quantify the geometric and hemodynamic characteristics of extracardiac and lateral tunnel Fontan surgical options and correlate certain anatomic characteristics with their hemodynamic efficiency and patient cardiac index.
Methods and Results
The study was conducted retrospectively on 22 patients undergoing Fontan operations (11 extracardiac and 11 lateral tunnel operations). Total cavopulmonary connection geometric parameters such as vessel areas, curvature, and offsets were quantified using a skeletonization method. Energy loss at the total cavopulmonary connection junction was available from previous in vitro experiments and computational fluid dynamic simulations for 5 and 9 patients, respectively. Cardiac index data were available for all patients. There was no significant difference in the mean and minimum cross-sectional vessel areas of the pulmonary artery between the extracardiac and lateral tunnel groups. The indexed energy dissipation within the total cavopulmonary connection was strongly correlated to minimum cross-sectional area of the pulmonary arteries (R2 value of 0.90 and P < .0002), whereas all other geometric features, including shape characteristics, had no significant correlation. Finally, cardiac index significantly correlated with the minimum pulmonary artery area (P = .006), suggesting that total cavopulmonary connection energy losses significantly affect resting cardiac output.
Conclusions
The minimum outlet size of the total cavopulmonary connection (ie, minimum cross section of pulmonary artery) governs the energy loss characteristics of the total cavopulmonary connection more strongly than variations in the shapes corresponding to extracardiac and lateral tunnel configurations. Differences in pulmonary artery sizes must be accounted for when comparing energy losses between extracardiac and lateral tunnel geometries.
After the Fontan procedure,1 the physiology of the resulting single ventricle circulation is such that the systemic venous return is routed directly to the lungs for oxygenation via an in situ surgically fabricated complex two-inlet/two-outlet vascular connection, also known as total cavopulmonary connection (TCPC). The two common variants of the TCPC are (1) lateral tunnel (LT) and (2) extracardiac (EC)2-4 A previous study has emphasized the need for lowering the net resistance of the single ventricle circulation5 to help reduce the secondary complications seen in these patients. Numerous studies examining the hemodynamic energy efficiency of the Fontan circulation6-9 have not clearly demonstrated advantages or disadvantages of one surgical technique over the other. Furthermore, it has not been demonstrated yet whether the alterations in the TCPC geometry, say as part as of a surgical planning process, would result in a significant increase in cardiac output to confer a clinical benefit to the patient.
Before addressing the significance of geometric variations of TCPC, one first needs to quantitatively describe the geometry of the TCPC anatomy to examine whether changes in the TCPC geometry produce significant changes in the net resistance or energy losses and thus significant changes in cardiac output,. Previous studies have shown that certain geometric characteristics of the TCPC and the associated vessels, mainly the pulmonary arteries (PAs), play an important role in determining the short-term and long-term patient outcome8,10-12 In vitro studies have highlighted the importance of curvature of the inferior vena cava (IVC) and its offset relative to the superior vena cava (SVC) in minimizing the energy dissipation at idealized TCPC junctions.7-13 Despite these studies, no quantitative data exist that characterize the complex TCPC geometries of patients and correlate their hemodynamic efficiency/inefficiency with geometric parameters. Furthermore, no studies exist that correlate anatomic or hemodynamic characteristics of the TCPC to patient cardiac performance (eg, cardiac index).
Our most recent study has quantitatively characterized the geometries of patient-specific EC and LT TCPCs.14 The present paper is a retrospective analysis in which we compare the geometric findings with in vitro and in vivo hemodynamic parameters of patient-specific Fontan anatomies to identify which geometric parameters are most important.
Methods
We retrospectively studied 22 Fontan patients, 11 each with an EC and LT TCPC, from an existing magnetic resonance imaging (MRI) database. All patients were imaged either at Children's Healthcare of Atlanta, Egleston Hospital, Atlanta (CHOA), or Children's Hospital of Philadelphia (CHOP). Informed consent was obtained from all patients and all study protocols complied with the institutional review boards of participating hospitals and the Georgia Institute of Technology. Among the 11 EC patients, 2 were from CHOA and 9 from CHOP; among the LT patients, 3 were from CHOA and 8 from CHOP. The inclusion criteria for this retrospective study were (1) availability of experimental or computational fluid dynamics (CFD) power loss quantification of the TCPC or in vivo cardiac output information; (2) availability of clinical information necessary to categorize each study group; and (3) the anatomic reconstruction with no visible artifacts (some geometries have loss of MRI signal owing to the presence of surgical clips).
For all 22 patients, geometric characterization of the TCPC was performed to quantitatively differentiate EC and LT as described previously.14 In vitro energy loss quantification for 6 of 22 patients (3 each of EC and LT types) and CFD simulation of energy loss for 9 of the 22 patients for resting cardiac output and equal PA flow split was available.9,15 Clinical details of the entire patient population are shown in Table 1.
TABLE 1. Clinical diagnosis of patients with EC and LT Fontan repair.
| Patient | Diagnosis | Hemi/BDG | BSA (m2) | Age (y) |
|---|---|---|---|---|
| EC TCPC | ||||
| 1 | HLHS | BDG | 0.79 | 6 |
| 2 | HRV, TA | BDG | 0.69 | 5 |
| 3 | HLHS | Hemi | 1.05 | 10 |
| 4 | HRV, Ebstein anomaly | BDG | 1.02 | 8 |
| 5 | DILV, PS, TGA | BDG | 1.064 | 9 |
| 6 | DX, TA, TGA, AA hypoplasia | BDG | 0.544 | 3 |
| 7 | TA, VSD | BDG | 0.872 | 7 |
| 8 | Pulmonary atresia, IVS, RV hypertrophy | BDG | 1.152 | 8 |
| 9 | DORV, IVS, MA, pulmonary atresia | BDG | 0.994 | 8 |
| 10 | DILV, pulmonary atresia | BDG | 1.253 | 8 |
| 11 | Ebstein anomaly | BDG | 0.793 | 8 |
| LT TCPC | ||||
| 12 | HRV, TA, VSD, PS | BDG | 0.56 | 3 |
| 13 | SV-DI AV connection | BDG | 0.58 | 2 |
| 14 | HLHS | BDG | 1.21 | 11 |
| 15 | HLHS | Hemi | 1.94 | 16 |
| 16 | HLHS | Hemi | 1.23 | 12 |
| 17 | TA, VSD | Hemi | 1.32 | 10 |
| 18 | HRV, DX, TA, VSD, PS | Hemi | 1.19 | 11 |
| 19 | Pulmonary atresia, HRV | Hemi | 1.49 | 15 |
| 20 | HLHS | Hemi | 0.963 | 9 |
| 21 | HLHS, TGA, hypoplastic AA, VSD | Hemi | 0.495 | 1 |
| 22 | PA | BDG | 1.063 | 10 |
EC, Extracardiac; LT, lateral tunnel; BDG, bidirectional Glenn; BSA, body surface area; TCPC, total cavopulmonary connection; HLHS, hypoplastic left heart syndrome; HRV, hypoplastic right ventricle; DILV, double-inlet left ventricle; PS, pulmonary stenosis; TGA, transposition of the great arteries; DX, TA, tricuspid atresia; AA, ascending aorta; VSD, ventricular septal defect; IVS, interventricular septum; RV, right ventricle; DORV, double-outlet right ventricle; MA, mitral atresia; SV-DI, double-inlet single ventricle; AV, atrioventricular; DX, dextrocardia.
Geometric Characterization
To characterize the complex 3-dimensional geometries of the TCPCs, we used a skeletonization approach, which is commonly used for shape analysis applications. In brief, the full 3-dimensional TCPC anatomy is first reconstructed from the raw stack of MRI data and represented as a triangulated 3-dimensional surface geometry.16,17 The patient-specific surface representation is then used to obtain the respective skeletal representation of the anatomy using the skeletonization approach, where each vessel is reduced to its centerline curve, as described below (see previous article for full details14):
The 3-dimensional surface representation of the TCPC was sliced at approximately 1-mm spacing in the MRI left–right and superior–inferior coordinate directions, thus generating sections that were roughly perpendicular to the left and right PAs (LPA and RPA) and IVC and SVC, respectively. The centroids of these cross sections were computed and connected to generate an initial estimate of the vessel centerline. Inasmuch as this approximation was poor in regions where the sectioning significantly departs from the true normal to the vessel, the centerline was iteratively refined as follows: For each subsequent iteration, the 3-dimensional vessel geometry was re-sliced in a direction perpendicular to the tangent of the centerline curve. The centroids were recomputed for the new slices and the curve through the newly computed centroids provided a better estimate of the true centerline. Cross-sectional areas of the IVC, SVC, LPA, and RPA were also computed as a part of this process. All vessel areas were normalized with patient body surface area.
Energy Loss
Energy dissipation rate or power loss in the TCPC was available from both in vitro measurements and CFD simulations at 50:50 pulmonary flow split, and resting cardiac output conditions as detailed below. The boundary conditions for both modalities (in vitro and CFD) are the same and therefore justify the use of both the available datasets together.
In vitro
Anatomically accurate in vitro models of 6 of the 24 reconstructed patient TCPCs (3 EC and 3 LT) were fabricated by stereolithography.18 Each in vitro model was inserted in a flow loop, which allowed for the control of the total cardiac output as well as IVC/SVC and LPA/RPA flow splits. Global flow rates and static pressures measurements were acquired at each inlet and outlet. These static pressures were corrected for pressure head bias introduced by small changes in the model elevation and then used to compute power losses (Ėloss) across the connection using an integrated, control volume energy balance equation6
| (1) |
where Pi and Qi, are the total pressures (ie, includes static and dynamic) and volumetric flow rate, respectively. The energy loss was experimentally determined for the resting flow conditions shown in Table 2.
TABLE 2. Flow conditions used in the evaluation of power loss using in vitro experiments.
| Patient | Flow conditions (L/min) |
|---|---|
| EC 1 | 2 |
| EC 2 | 2 |
| EC 5 | 2 |
| LT 2 | 2 |
| LT 3 | 4 |
| LT 7 | 4 |
EC, Extracardiac; LT, lateral tunnel.
CFD
For CFD simulations, the vessel volumes were discretized into computational elements (meshes). The number of elements varied, depending on geometry size and complexity, but ranged from 548,842 to 1,674,440 for the models studied.9 At each element, the governing Navier–Stokes conservation equations of mass and momentum for laminar fluid flow were solved. The CFD computations were performed with the commercial software FIDAP 8.7.4 (Ansys Inc, Canonsburg, Pa). Power loss through the TCPC was calculated by the control volume method (same as equation 1).
Cardiac Index
The resting cardiac output of each patient calculated from the phase-contrast MRI scan was indexed to the patient body surface area (BSA) to obtain cardiac index.
Energy Loss Nondimensionalization
So that geometric and hemodynamic features for different patients can be compared, the power loss is nondimensionalized using the dynamic power of the circulation:
| (2) |
where ρ is the density of blood, Q is the flow rate, and BSA is the body surface area. The TCPC energy dissipation index, computed as ε normalized with ε0, is the proper indexed resistance measure of the TCPC. Normalizing to dynamic power has been described in the clinical literature before,19 with resulting resistance coefficient consistent with the well-established engineering methodology that is used to compare resistances of complex pipe networks and fittings.20,21 Also note that the PA flow split is held constant at 50:50 for all patient geometries to truly determine the resistance (cost) to drive an ideal flow condition. This eliminates the bias owing to varying lung resistances from patient to patient when using in vivo flow split.
Statistical Analysis
Inasmuch as all comparative data were found to be non-normal and to correspond to a 2-sample population (EC vs LT), the nonparametric Mann–Whitney test was used to examine statistical significance among the various geometric parameters evaluated. Differentiating factors are considered statistically significant for P values < .05. Standard regression analysis was performed to examine statistically significant association between anatomic and hemodynamic parameters.
Results
Figure 1 shows the normalized mean vessel cross-sectional areas computed for IVC baffle, SVC, LPA, and RPA of both the EC and LT patient populations. The IVC baffle was between 3.5 and 4 cm2/m2 for both EC and LT, and the SVC, RPA, and LPA were all between 1 and 2 cm2/m2. Figure 2 shows the minimum cross-sectional area of the PA for EC and LT patients. The magnitude was about 0.45 cm2/m2 irrespective of EC or LT connection type. Statistical comparison of the vessel cross-sectional areas and minimum areas of the PAs has been tabulated in Table 3 with no statistically significant difference in the vessel size characteristics between the LT and EC groups.
FIGURE 1.
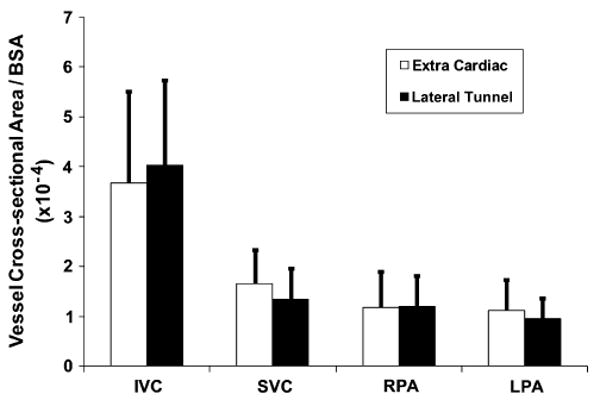
Mean cross-sectional areas of each vessel in the vicinity of the TCPC compared between EC and LT patient groups (n = 11 each). IVC, Inferior vena cava; SVC, superior vena cava; RPA, right pulmonary artery; LPA, left pulmonary artery; BSA, body surface area.
FIGURE 2.
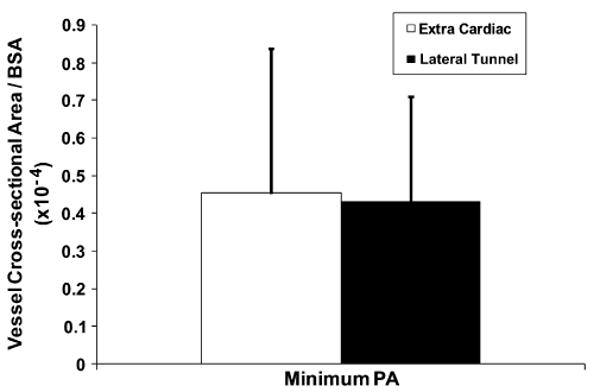
Minimum cross-sectional areas computed between the TCPC outlet vessels left and right pulmonary arteries for EC and LT patient groups (n = 11 each). PA, Pulmonary artery; BSA, body surface area.
TABLE 3. Vessel areas (in cm2/m2) computed for extracardiac and lateral tunnel groups.
| Computed variables | EC | LT | P value |
|---|---|---|---|
| Mean vessel area | |||
| IVC | 3.51E-04 ± 1.82E-04 | 3.83E-04 ± 1.62E-04 | .2917 |
| SVC | 1.65E-04 ± 0.71E-04 | 1.23E-04 ± 0.51E-04 | .0874 |
| RPA | 1.11E-04 ± 0.70E-04 | 1.06E-04 ± 0.43E-04 | .2917 |
| LPA | 1.03E-04 ± 0.52E-04 | 0.88E-04 ± 0.34E-04 | .1704 |
| Minimum vessel area | |||
| RPA | 7.5E-5 ± 5.97E-5 | 6.75E-5 ± 3.2E-5 | .3537 |
| LPA | 5.73E-5 ± 3.67E-5 | 4.12E-5 ± 2.09E-5 | .1183 |
| PA | 4.54E-5 ± 3.84E-5 | 4.30E-5 ± 2.79E-5 | .3754 |
EC, Extracardiac; LT, lateral tunnel; IVC, inferior vena cava; SVC, superior vena cava; RPA, right pulmonary artery; LPA, left pulmonary artery; PA, pulmonary artery.
Figure 3 shows the plot of the in vitro and the CFD TCPC energy dissipation index, for 50:50 pulmonary flow split and resting cardiac output, as a function of the smaller of the minimum cross-sectional areas of the two PAs. A power law fit produced an R2 of 0.898 and a P value of .0002.
FIGURE 3.
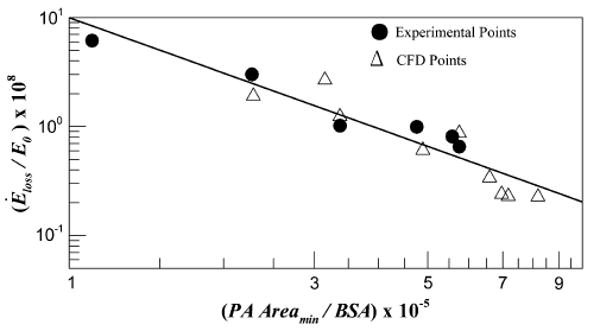
Normalized TCPC power loss ε/ε0 obtained from in vitro experiments and CFD simulations computed at the physiologic conditions plotted against the minimum cross-sectional areas of the pulmonary arteries (PA). BSA, Body surface area.
Figure 4 shows the plot of patient resting cardiac index again using the minimum cross-sectional area between the two PAs. The cardiac index of the patients varied between 2 and 3.5 with a significant statistical association (P = .006). A linear fit provided an R2 of 0.32.
FIGURE 4.
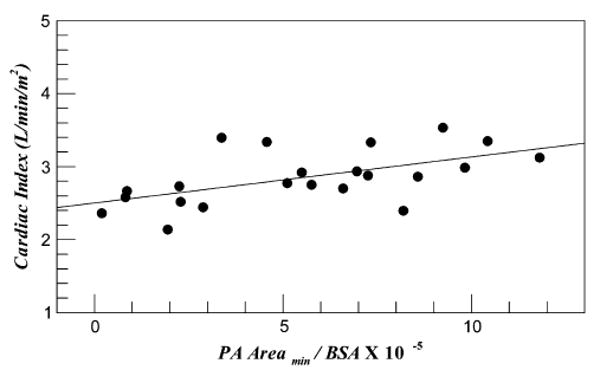
Normalized minimum cross-sectional areas of the pulmonary arteries (PA) plotted against the patient cardiac index. BSA, Body surface area.
Discussion
This is a retrospective study in which we address the question: do the anatomic characteristics of the TCPC affect its hydrodynamic efficiency and, more importantly, the patient cardiac output, and if so what characteristics of the TCPC geometry significantly matter?
First, as shown in Figures 1 and 2, there exist no significant differences between EC and LT TCPCs when considering sizes of the vessels even though EC and LT TCPCs are a result of significantly different surgical approaches for constructing the Fontan baffle. In our recent study,14 we analyzed other geometric parameters such as curvatures, offsets, and vessel area variance. None of these parameters was significantly different except for the vessel area variation, where LT TCPCs had a larger area variation in the IVC baffle owing to the presence of right atrial wall as part of the baffle. However, as discussed below, the most significant geometric parameter that influences the hemodynamic efficiency of the connection is the minimum vessel cross-sectional area of the PAs.
Figure 3 clearly indicates that the TCPC energy dissipation index drops as a power law decay with increasing minimum PA size (P = .0002). Such a strong correlation (R2 = 0.898) with minimum PA size even with a significant difference between EC and LT IVC baffle area variance and the large patient–to-patient variability in other parameters such as curvature,14 offsets, et cetera, demonstrates that the minimum PA size far dominates influence from any other geometric parameter. From a fluid mechanics standpoint, the TCPC may thus be viewed as a “sudden contraction” fitting where flow from larger vessels (IVC and SVC) are routed to the relatively smaller PAs. The results are indeed analogous to that for the sudden pipe contraction problem in which it is known that the inlet and outlet sizes primarily define the energy loss.
From the results presented in Figure 4, cardiac index linearly increases with smallest cross section of the PA (P = .002). This increase in resting cardiac output may be attributed to the reduced TCPC energy dissipation index. However, note that the R2 of 0.32 shows that there exists a significant scatter that is visually well distributed on either side of the linear fit line (see Figure 4). These variations may be attributed to the varying single ventricle pump characteristics from patient to patient that depend on the precise nature of the congenital heart defect. Nevertheless, from these data it is clear that the minimum cross-sectional size of the PA plays a statistically significant role in determining the TCPC energy loss and thus resting cardiac output of Fontan patients. This impact is postulated to become even stronger under exercise conditions, as recently suggested by another study9 in which resistance of the TCPC nonlinearly increased with exercise and in some cases surpassed the lung resistance.
Clinical Significance
In this study, we show that the vessel sizes of TCPC (particularly that of the PAs) plays a significant role in determining the TCPC performance and the resting cardiac output and all other geometric characteristics having a lower impact. This significant role of the PA characteristic on the patient resting cardiac output, regardless of EC or LT, does not imply that the TCPC efficiency between EC and LT are the same. It only implies that outlet characteristics have a stronger impact on TCPC energy loss than any difference that may be present between EC and LT, including the shapes and orientation of the anastomosis. Also, this suggests that comparisons between EC and LT resistance are meaningful only if the normalized energy dissipation is further indexed to the variation with respect to minimum PA size.
Acknowledgments
Funded by the National Heart, Lung, and Blood Institute (HL67622).
Abbreviations and Acronyms
- BSA
body surface area
- CFD
computational fluid dynamics
- CHOA
Children's Healthcare of Atlanta
- CHOP
Children's Hospital of Philadelphia
- EC
extracardiac
- IVC
inferior vena cava
- LPA
left pulmonary artery
- LT
lateral tunnel
- MRI
magnetic resonance imaging
- PA
pulmonary artery
- RPA
right pulmonary artery
- SVC
superior vena cava
- TCPC
total cavopulmonary connection
References
- 1.Fontan F, Baudet E. Surgical repair of tricuspid atresia. Thorax. 1971;26:240–7. doi: 10.1136/thx.26.3.240. [DOI] [PMC free article] [PubMed] [Google Scholar]
- 2.Kumar SP, Rubinstein CS, Simsic JM, Taylor AB, Saul JP, Bradley SM. Lateral tunnel versus extracardiac conduit Fontan procedure: a concurrent comparison. Ann Thorac Surg. 2003;76:1389–97. doi: 10.1016/s0003-4975(03)01010-5. [DOI] [PubMed] [Google Scholar]
- 3.Stamm C, Friehs I, Mayer JE, Zurakowski D, Triedman JK, Moran AM, et al. Long-term results of the lateral tunnel Fontan operation. J Thorac Cardiovasc Surg. 2001;121:28–41. doi: 10.1067/mtc.2001.111422. [DOI] [PubMed] [Google Scholar]
- 4.Azakie A, McCrindle BW, Van Arsdell G, Benson LN, Coles J, Hamilton R, et al. Extracardiac conduit versus lateral tunnel cavopulmonary connections at a single institution: impact on outcomes. J Thorac Cardiovasc Surg. 2001;122:1219–28. doi: 10.1067/mtc.2001.116947. [DOI] [PubMed] [Google Scholar]
- 5.Senzaki H, Masutani S, Kobayashi J, Kobayashi T, Sasaki N, Asano H, et al. Ventricular afterload and ventricular work in Fontan circulation—comparison with normal two-ventricle circulation and single-ventricle circulation with Blalock–Taussig shunts. Circulation. 2002;105:2885–92. doi: 10.1161/01.cir.0000018621.96210.72. [DOI] [PubMed] [Google Scholar]
- 6.de Zelicourt DA, Pekkan K, Wills L, Kanter K, Forbess J, Sharma S, et al. In vitro flow analysis of a patient-specific intraatrial total cavopulmonary connection. Ann Thorac Surg. 2005;79:2094–102. doi: 10.1016/j.athoracsur.2004.12.052. [DOI] [PubMed] [Google Scholar]
- 7.Ensley AE, Lynch P, Chatzimavroudis GP, Lucas C, Sharma S, Yoganathan AP. Toward designing the optimal total cavopulmonary connection: an in vitro study. Ann Thorac Surg. 1999;68:1384–90. doi: 10.1016/s0003-4975(99)00560-3. [DOI] [PubMed] [Google Scholar]
- 8.Pekkan K, de Zelicourt D, Kitajima H, Forbess JM, Kanter KR, Parks JW, et al. Functional left pulmonary artery stenosis in total cavopulmonary connection (TCPC): assessing improvements in lung perfusion and cardiac workload with computer-aided angioplasty. Circulation. 2004;110:737. [Google Scholar]
- 9.Whitehead KK, Pekkan K, Kitajima HD, Paridon SM, Yoganathan AP, Fogel MA. Nonlinear power loss during exercise in single-ventricle patients after the Fontan: insights from computational fluid dynamics. Circulation. 2007;116:165–71. doi: 10.1161/CIRCULATIONAHA.106.680827. [DOI] [PubMed] [Google Scholar]
- 10.Hosein RBM, Clarke AJB, McGuirk SP, Griselli M, Stumper O, De Giovanni JV, et al. Factors influencing early and late outcome following the Fontan procedure in the current era. The “Two Commandments”? Eur J Cardiothorac Surg. 2007;31:344–53. doi: 10.1016/j.ejcts.2006.11.043. [DOI] [PubMed] [Google Scholar]
- 11.Walker PG, Howe TT, Davies RL, Fisher J, Watterson KG. Distribution of hepatic venous blood in the total cavo-pulmonary connection: an in vitro study. Eur J Cardiothoracic Surg. 2000;17:658–65. doi: 10.1016/s1010-7940(00)00425-5. [DOI] [PubMed] [Google Scholar]
- 12.Walker PG, Oweis GF, Watterson KG. Distribution of hepatic venous blood in the total cavo pulmonary connection: an in vitro study into the effects of connection geometry. J Biomech Eng. 2001;123:558–64. doi: 10.1115/1.1407827. [DOI] [PubMed] [Google Scholar]
- 13.Ryu K, Healy TM, Ensley AE, Sharma S, Lucas C, Yoganathan AP. Importance of accurate geometry in the study of the total cavopulmonary connection: computational simulations and in vitro experiments. Ann Biomed Eng. 2001;29:844–53. doi: 10.1114/1.1408930. [DOI] [PubMed] [Google Scholar]
- 14.KrishnankuttyRema R, Dasi LP, Pekkan K, Sundareswaran KS, Fogel M, Sharma S, et al. Quantitative analysis of extracardiac versus intraatrial Fontan anatomic geometries. Ann Thorac Surg. 2008;85:810–7. doi: 10.1016/j.athoracsur.2007.11.082. [DOI] [PubMed] [Google Scholar]
- 15.Katajima HD. PhD dissertation. Atlanta: School of Biomedical Engineering, Georgia Institute of Technology; 2007. In vitro fluid dynamics of stereolithographic single ventricle congenetal heart defects from in vivo magnatic resonance imaging. [Google Scholar]
- 16.Frakes DH, Conrad CP, Healy TM, Monaco JW, Fogel M, Sharma S, et al. Application of an adaptive control grid interpolation technique to morphological vascular reconstruction. IEEE Trans Biomed Eng. 2003;50:197–206. doi: 10.1109/TBME.2002.807651. [DOI] [PubMed] [Google Scholar]
- 17.Frakes DH, Smith MJT, Parks J, Sharma S, Fogel M, Yoganathan AP. New techniques for the reconstruction of complex vascular anatomies from MRI images. J Cardiovasc Magn Reson. 2005;7:425–32. doi: 10.1081/jcmr-200053637. [DOI] [PubMed] [Google Scholar]
- 18.de Zelicourt D, Pekkan K, Kitajima H, Frakes D, Yoganathan AP. Single-step stereolithography of complex anatomical models for optical flow measurements. J Biomech Eng. 2005;127:204–7. doi: 10.1115/1.1835367. [DOI] [PubMed] [Google Scholar]
- 19.Milnor WR, Bergel DH, Bargaine JD. Hydraulic power associated with pulmonary blood flow and its relation to heart rate. Circ Res. 1966;19:467–80. doi: 10.1161/01.res.19.3.467. [DOI] [PubMed] [Google Scholar]
- 20.Costa NP, Maia R, Proenca MF, Pinho FT. Edge effects on the flow characteristics in a 90 degree junction. J Fluids Eng. 2006;128:1204–17. [Google Scholar]
- 21.Bassett MD, Winterbone DE, Pearson RJ. Calculation of steady flow pressure loss coefficients for pipe junctions. Proceedings of the Institution of Mechanical Engineers Part C. J Mech Engin Sci. 2001;215:861–81. [Google Scholar]