

Abstract
The release of cytochrome c from mitochondria is a key signaling mechanism in apoptosis. Although extramitochondrial proteins are thought to initiate this release, the exact mechanisms remain unclear. Cytochrome c (cyt c) binds to and penetrates lipid structures containing the inner mitochondrial membrane lipid cardiolipin (CL), leading to protein conformational changes and increased peroxidase activity. We describe here a direct visualization of a fluorescent cyt c crossing synthetic, CL-containing membranes in the absence of other proteins. We observed strong binding of cyt c to CL in phospholipid vesicles and bursts of cyt c leakage across the membrane. Passive fluorescent markers such as carboxyfluorescein and a 10-kDa dextran polymer crossed the membrane simultaneously with cyt c, although larger dextrans did not. The data show that these bursts result from the opening of lipid pores formed by the cyt c–CL conjugate. Pore formation and cyt c leakage were significantly reduced in the presence of ATP. We suggest a model, consistent with these findings, in which the formation of toroidal lipid pores is driven by initial cyt c-induced negative spontaneous membrane curvature and subsequent protein unfolding interactions. Our results suggest that the CL–cyt c interaction may be sufficient to allow cyt c permeation of mitochondrial membranes and that cyt c may contribute to its own escape from mitochondria during apoptosis.
Keywords: electrostatic, GUV, permeability, flux, cholesterol
Cytochrome c (cyt c) is a mitochondrial electron transfer protein localized to the inner mitochondrial membrane of nonapoptotic cells by strong electrostatic and hydrophobic interactions with cardiolipin (CL) (1–6). This negatively charged lipid, which comprises ∼10 mol% of the inner mitochondrial membrane (7), and its oxidation products, play a central role in apoptotic signaling (8, 9). Release of cyt c from mitochondria induces apoptosis. An initial step in this process involves changes in the cyt c–CL interaction that anchors the protein to the inner membrane. Attendant protein conformational changes and hydrophobic interactions with the lipid confer catalytic activities to the cyt c–CL complex (1, 4, 9–12), which causes CL oxidation. Signaling at this stage may also involve cyt c tyrosine phosphorylation (13, 14) and the balance of mitochondrial ATP (15). Subsequently, cyt c exits the mitochondria via outer membrane permeabilization (2). Although the exact mechanism of this permeabilization remains unclear (2), it is thought to be orchestrated by the proapoptotic Bcl-2 family of proteins including Bid, Bax, and Bak, which can act cooperatively to form pores in the outer membrane (16–21).
Cyt c causes structural changes to CL-containing membranes, including penetration into liposome interiors and transition to an inverted hexagonal (HII) phase—a cylindrical lipid structure with head groups lining an aqueous interior (6, 22, 23). Recently, cyt c-derived peptides were observed to cross plasma membranes (24). Under apoptotic conditions, outer mitochondrial membranes were found to contain ∼40 mol% CL due to migration of this lipid from the inner membrane (9). Taken together, these results suggest that the cyt c–CL interaction may lead to structural changes in the outer membrane and thereby contribute to the escape of cyt c from mitochondria during apoptosis.
Single-giant unilamellar vesicle (GUV) microscopy has emerged recently as a powerful technique to investigate membrane leakage and pore formation induced by proteins and peptides (25–28). These experiments are similar in concept to black lipid membrane conductance experiments, except instead of measuring the flow of small ions across a membrane, the passage of large macromolecules can be directly observed by fluorescence. The goal of this study was to examine the intrinsic behavior of cyt c in contact with CL-containing GUV model membranes. We labeled these GUVs as well as yeast cyt c with fluorophores and directly observed the passage of this protein as well as passive fluorescent dextran polymers across the GUV membrane bilayer using confocal microscopy. The results show that discrete pores were formed in the membrane, allowing rapid transmembrane leakage of cyt c as a result of the cyt c–CL interaction.
Results
In the most basic experiment, we assembled mixed populations of giant 1,2-dioleoyl-sn-glycero-3-phosphocholine (DOPC) vesicles, some containing CL and some without, in a medium containing fluorescently labeled cyt c. Using confocal microscopy, we observed strong binding of cyt c with CL-containing membranes (red halo) and almost no cyt c association with membranes lacking CL (blue halo) (Fig. 1A). We also observed that cyt c was able to penetrate the CL-containing vesicles and fill the interior volume (vesicle 2), whereas the DOPC-only vesicles were robust under these conditions (vesicle 1).
Fig. 1.
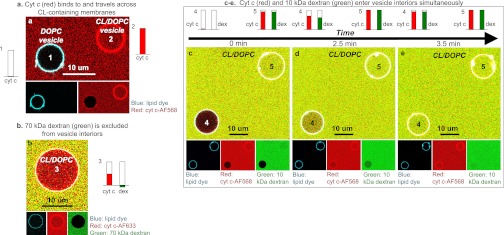
Cyt c permeabilizes CL-containing membranes. GUV confocal microscopy images. (A) DOPC with NBD-PE (left vesicle) and 80:20 DOPC:CL (right vesicle), treated with Alexa Fluor 568–cyt c in solution (red). (B) The 80:20 DOPC:CL GUV with NBD-PE, treated with fluorescent 70-kDa dextran (green) and Alexa Fluor 633–cyt c in solution (red). (C–E) Time series of 80:20 DOPC:CL GUVs with NBD-PE, treated with fluorescent 10-kDa dextran (green) and Alexa Fluor 633–cyt c in solution (red). In all images, the cyan lipid dye is 0.5 mol% NBD-PE. Average normalized cyt c and dextran concentration for each vesicle interior vs. background is plotted.
To illuminate the mechanism of cyt c transport across the GUV membranes, a fluorescent neutrally charged dextran was incubated with the vesicles. Before the addition of cyt c, the vesicles were not leaky to a 10-kDa dextran (Fig. S1, SI Text); after cyt c was added, there was a lag time, and then both cyt c and the similarly sized 10-kDa dextran were observed to enter the interior of each vesicle rapidly and simultaneously (Fig. 1 C–E). The relative interior brightness of GUVs is depicted by the bar graphs (Fig. 1) or histograms (Fig. S2, SI Text). By contrast, a 70-kDa dextran (Fig. 1B, green channel) was largely excluded from the GUV interior, even though cyt c had entered the vesicle interiors (red channel), indicating an apparent size limit for membrane permeation.
To investigate the kinetics of this permeabilizing effect by cyt c, we collected confocal time-lapse images of the leakage of cyt c and 10-kDa dextran into individual vesicles. In these experiments, fluorescent cyt c diffused into the visual field from its site of addition (Fig. S3, SI Text)—this method ensured our ability to monitor GUVs before the onset of leakage and to record leakage events uncomplicated by the addition of cyt c solution. The observed lag time due to this experimental setup may in part correspond to that observed in similar experiments with the pore-forming protein equinatoxin II (25).
We analyzed 165 GUVs from these confocal movies. The exterior and interior brightness of cyt c and dextran in each vesicle over time were extracted and plotted (Fig. S2). From these extracted leakage plots, along with close visual inspection of the movies, a spectrum of vesicle behaviors emerged as follows: “full leak”: vesicle leaks to at least ∼80% of background in cyt c and dextran channels; “partial leak”: vesicle leaks and then plateaus at less than ∼80% of background in cyt c and dextran channels; “leak stop leak”: vesicle leaks and then plateaus as described for the partial leak behavior; a second leakage event is then observed after the plateau; “no leak”: vesicle is not observed to leak to cyt c or dextran within the 45-min movie; “leaky to cyt c only”: vesicle leaks to cyt c (interior concentration of cyt c increases), but not to dextran (interior concentration of dextran remains low); and “complicated leakage”: vesicle behavior is complicated by vesicle collapse, contraction, or aggregation, as we have previously reported (29).
Fig. 2 shows representative plots for GUVs treated with cyt c. An abrupt change of the interior plot from zero or minimal slope to a steep slope indicates the instant when leakage begins; this observation is interpreted as the opening of a lipid pore, corresponding to an all-or-none type of leakage described in literature (27). Behavior and event timing varied for GUVs within a single sample, implying that pore formation is a stochastic process, whereas initial binding of cyt c to the membrane was fast. The fact that both cyt c and dextran plots followed the same trajectory indicates that both leaked simultaneously in nearly every GUV (Fig. 2A). Fig. 2B illustrates representative behaviors of GUVs; the partial leak plot shows that pores can close before equilibrium is reached across the membrane, and the leak-stop-leak plot suggests that after the closing of one pore, another pore may open. Permeability values of GUV membranes were calculated from the normalized dextran leakage data (Fig. 2 C and D).
Fig. 2.

Leakage of cyt c and dextran into vesicles is simultaneous and can proceed with intact vesicles. (A) Normalized average pixel intensity data in cyt c (red) and 10-kDa dextran (green) channels for the interior of two representative GUVs within one sample. (B) Interior dextran normalized average pixel intensity data for behavior-representative vesicles. (C) Permeability plot for example vesicles: −(R/3) ln(1 − cinterior) is plotted vs. time; permeability is best-fit line slope. (D) Table of permeability values (in nanometers per second) sorted by behavior (sd is SD, n is number vesicles observed in the sample). Vesicle compositions: (A and B) leak stop leak 25:40:10:25 DOPC:DPPC:CL:chol (phase-separated); (B) full 65:10:25 DOPC:CL:chol; (B) partial 80:20 DOPC:CL; (B) no leak 27.5:37.5:10:25 DOPC:DPPC:CL:chol (phase-separated). All vesicles contain 0.5 mol% NBD-PE; phase-separated also contain 0.5 mol% Rh-PE. All vesicles are pretreated with dextran and monitored after cyt c addition.
This experiment was repeated with nonfluorescent horse heart cyt c and dextran. Vesicle leakage was monitored by dextran brightness over time, because the nonfluorescent cyt c could not be observed. Twelve GUVs treated with horse heart cyt c were analyzed; behavior types and permeability values were essentially identical to vesicles treated with yeast cyt c (Fig. 2D).
Leakage movies were taken of GUVs with a variety of compositions: 10–20 mol% CL, with or without 25 mol% cholesterol, and with or without phase separation (29). All of these GUVs showed similar pore formation behaviors and similar permeability values (Fig. 2D did not contain composition distinctions). By contrast, membranes lacking CL were not observed to leak when treated with cyt c, demonstrating that the presence of CL is necessary and sufficient for the formation of pores by cyt c.
Our studies also suggested that cholesterol plays a supporting role in pore formation, although GUVs both with and without cholesterol were observed to leak. Because of the relatively small number of vesicles observed in microscope studies, we used a complementary technique to confirm the role of cholesterol. A leakage assay using carboxyfluorescein-encapsulated large unilamellar vesicles (LUVs) yielded quantitative ensemble measurements on large numbers of vesicles; a fluorescence increase was associated with LUV leakage or destruction. The results showed that CL-containing LUVs treated with horse heart or yeast cyt c exhibited leakage above that seen in control 1-palmitoyl-2-oleoyl-sn-glycero-3-phosphocholine (POPC) LUVs, and that leakage was exacerbated when 10 mol% cholesterol was also present (Fig. S4, SI Text). Leakage was dramatically reduced in the presence of ATP (Fig. S5, SI Text).
Discussion
The interactions of cyt c with phospholipid membranes are clearly very complex, involving electrostatic and hydrophobic interactions (5, 30, 31), demixing of the lipid components (23), changes in lipid curvature (6, 22), and conformational changes in the protein (1, 9–11). Single-GUV microscopy has the advantage of allowing the direct observation of individual vesicles with different lipid compositions side by side. The GUVs in these experiments did not exchange their lipids to any observable degree, as is demonstrated by the lipid dye remaining over time in one population of vesicles in a mixed sample. This observation of multiple GUV populations under the same conditions showed that cyt c binds strongly only to CL-containing membranes (Fig. 1A). A very weak fluorescent halo is seen in the red channel around the DOPC GUV in Fig. 1A, which might be attributable to a very weak association of cyt c with the membrane, or to a low level of bleed-through signal from the lipid dye (blue) channel.
Following the recruitment of cyt c to the outer leaflet by CL, the CL–cyt c conjugate caused membrane leakage, and a rapid flux of cyt c into the GUV interior occurring over a period of 1–2 min (Figs. 1 C–E and 2A). Several lines of evidence lead to the conclusion that the leakage is caused by the opening of size-limited pores. The leak time profiles showed “bursts” of cyt c influx, with GUV interiors rapidly coming to equilibrium (Fig. 2A). This observation is consistent with the opening of a stable membrane pore—corresponding with an all-or-none type of leakage (27)—rather than the translocation of individual cyt c molecules across the membrane in separate locations, which has previously been envisioned as a sort of “burrowing” through the membrane in inverted micelle-like structures (6). The time course of dextran influx followed the same trajectory as that of cyt c (Fig. 2A), further demonstrating the existence of stable pores, which remained open to all molecules below a certain cutoff size; the larger 70-kDa dextran was excluded from GUV interiors (Fig. 1B). Finally, some GUVs exhibited a partial leak behavior (Fig. 2B) where leakage began and then abruptly stopped before reaching equilibrium, an observation consistent with the closing of a single membrane pore in that GUV and indicating the overall reversibility of the pore-forming process. This observation also indicates that pore formation under these conditions is a rare event, because a large number of cyt c molecules has been recruited to the membrane surface. Added ATP significantly decreased the rate and extent of vesicle leakage, suggesting an aspect of competitive inhibition and possibly a feedback system that diminishes cyt c–CL interactions at high ATP concentrations.
Permeability is the property of a membrane that quantifies the rate of translocation of specific molecules and is independent of their concentration difference across the membrane and the GUV size. For a GUV of 10-µm diameter, with 0 µM cyt c in its interior volume and 5 µM cyt c in its external environment, a permeability value of 40 nm/s (Fig. 2D) corresponds to an initial net flow of ∼4 × 10⁴ cyt c molecules entering the GUV per second through the open pore. This net flux will decrease exponentially as the interior concentration tends to an equilibrium concentration equal to that of cyt c in the external environment. At this point, cyt c will continue to translocate the membrane; however, the influx and efflux of cyt c will be equal such that no net change in the GUV’s interior concentration is observed.
The membrane permeability was examined for the leaking GUVs (Fig. 2 C and D), and the pore size was estimated from the permeability values, by comparing results to those obtained for equinatoxin II, a member of the family of 20-kDa pore-forming toxins from sea anemones (25). Permeability was also determined by a calculation of diffusive transport. These two approaches yielded pore diameters of ∼2 and ∼20 nm, respectively, reasonably comparable to the diameter of cyt c (∼3 nm). (See SI Text for calculations and discussion.) These pore size values are also comparable to the estimated diameter of the inverted hexagonal channels described in earlier work, ∼2–3 nm (6). There was no difference in the behavior or permeability of GUVs treated with yeast cyt c vs. horse heart cyt c.
We reported previously that single-GUV microscopy on a similar system revealed another fascinating morphological change induced in membranes by cyt c—the dramatic collapse of CL-containing liquid-disordered domains in phase-separated vesicles (29). In this work, we excluded the permeability values of GUVs that appeared to undergo any type of collapse, contraction, or aggregation during or before leakage, as any leakage in these vesicles could have been caused by destructive processes rather than pore formation. The permeability values for GUVs with “complicated leakage” behaviors were higher and far more variable than the permeability values for GUVs with apparently uncomplicated leakage, attributable to pore formation.
The pore-forming process observed here may be related to the ability of cyt c to induce a negative curvature stress upon binding to CL-containing membranes (6, 22, 23). The initial steps of this interaction could occur by local demixing and clustering of CL through electrostatic attractions and by decreasing the preferred spontaneous curvature for the clustered lipid molecules and neutralizing the repulsive electrostatic interaction between CL head groups (Fig. 3B).
Fig. 3.

Proposed cyt c-induced nanoscale toroidal lipid pore formation. (A–C) Cyt c induces formation of a toroidal pore of nanoscale radius, clustering negative-curvature lipid CL along the pore perimeter in the membrane plane. (D) Pore lined with a cluster of cyt c C-terminal helices. (Inset) Pore curvature elasticity energy landscape shows feasibility of pore formation with increasingly negative lipid spontaneous curvature.
The negative curvature stress induced by cyt c would decrease the energetic barrier for the transition from a bilayer membrane (Fig. 3A) to a different lipid phase with a negative curvature, with head groups more closely spaced than lipid tails. The inverted hexagonal (HII) phase is one such structure that has been observed in experiments on CL-containing membranes treated with cyt c (6, 23); another structure with a barrier of formation significantly decreased by an increase in negative spontaneous curvature is a small-diameter toroidal lipid pore (Fig. 3 B and C). The toroidal pore contains both negative (in the plane of the membrane) and positive (normal to the membrane plane) curvature; the balance of these is determined by the relative sizes of the pore diameter and the bilayer thickness (Fig. S6) (22). Therefore, we examined the difference in curvature elastic energy for lipid monolayers between a planar bilayer (Fig. 3A) and a toroidal lipid pore (Fig. 3 B and C) of the same surface area. The curvature elastic energy of a fluid, elastic membrane can be calculated using the Helfrich model (32) as follows: 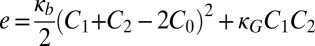 , where e is the curvature elastic energy per unit area, C1 and C2 are the principal monolayer curvatures, C0 is the lipid monolayer’s spontaneous (preferred) curvature, the bending modulus, κb, is taken to be 5 kBT for an unsaturated lipid monolayer (33), and the Gaussian curvature modulus, κG, is taken as
  , within the permitted physical range
  (34).
(34).
The curvature elasticity energy landscape for varying pore radius and monolayer spontaneous curvature is shown in Fig. 3 Inset and Fig. S7. It should be noted that Gaussian curvature term provides a fixed energetic penalty for the topology change from a planar bilayer to the formation of a pore that is independent of the pore size. Therefore, a shift in the chosen value of κG only translates the energy landscape up or down the energy axis without transforming the shape of this surface. A deep energy minimum appears in the lower left corner for decreasing spontaneous curvature, predicting a metastable, finite-size pore with a thermally accessible energy difference from the planar bilayer state. This model predicts this metastable pore to be ∼2 nm in diameter, consistent with the above estimates from permeability. For the full calculation and discussion, see SI Text.
We find no evidence that the size (or curvature) of the GUV impacts pore formation. This is unsurprising because GUV curvatures are of the order of micrometer−1, which is effectively flat on macromolecular length scales (35). We observe leakage in both LUVs, radii of ∼50–100 nm, and GUVs, radii of ∼3–20 µm (the radii of mitochondria are ∼250–500 nm). Therefore, vesicle size does not affect the process, except that a larger vesicle will provide a greater surface area over which pore formation can occur; this is consistent with the slower population-wide leakage observed in LUV vs. GUV experiments.
Some cationic proteins and peptides do induce toroidal pores via negative curvature stress, as our model suggests for cyt c (Fig. S8); these species include HIV-transactivator of transcription (TAT), tachyplesin, islet amyloid polypeptide, 14-helical β-peptides, NK-2 (a cationic core peptide from natural killer lysin, or NK-lysin), and sticholysins I and II (36–43). Lysozyme—a protein of similar size, shape, and charge to cyt c—caused similar leakage to cyt c in our LUV experiments (Fig. S4). Interestingly, several studies suggest that truncated BH3 interacting-domain death agonist (tBid) and/or Bcl-2–associated X protein (BAX) may cause outer mitochondrial membrane lipidic pores related to curvature (18–21). Other species that cause membrane structural changes in analogous ways include modified lipids and cationic nanoparticles (44, 45).
This exacerbation of leakage from cholesterol-containing membranes (Fig. S4) seems counterintuitive at first glance because cholesterol generally decreases membrane permeability by increasing lipid packing density (46). Indeed, in this work, cholesterol did protect membranes from leakage in the absence of CL (Fig. S4). However, membranes containing cholesterol have a significant negative spontaneous curvature; in this system, the effect may be synergistic with the effect of cyt c on CL in lowering the barrier for pore formation. Cholesterol has also been found to promote pore formation by Vibrio cholerae cytolysin (47).
The effects of cholesterol and ATP on the interaction of cyt c with CL are suggestive of a role for this pore formation activity in apoptosis. Cholesterol is found mainly in the outer mitochondrial membrane, whereas CL is present in the inner membrane under nonapoptotic conditions. The apoptotic migration of CL to the outer membrane—which contains high levels of cholesterol—may create a membrane permeable enough for cyt c to act upon. Similarly, emerging research suggests that the abundant ATP present in the mitochondria may bind to cyt c, altering the conformation and activities of the protein (15, 48); mitochondrial ATP levels may therefore regulate whether cyt c acts as an electron transporter or a proapoptotic protein.
As is clear from the time dependence of cyt c binding and subsequent membrane permeation (Fig. 1 C–E and Fig. S3), the initial association of the protein to the outer leaflet of CL-containing vesicles was fast, whereas leakage occurred only after minutes. We suggest that the slow phase of pore formation may involve conformational changes that occur after the initial protein–lipid binding. These changes include CL acyl tail insertion into the hydrophobic cleft of cyt c—in accord with the extended anchor model of cyt c CL–membrane interaction (30, 31, 49)—and the recently described equilibration between compact and extended lipid-bound cyt c conformations (1, 12). One such scenario is depicted in Fig. 3D. Here, the C-terminal helix, which begins after the distal heme ligand, Met-80, and contains the conserved Arg-91, has unfolded to stabilize the open pore. Worrall and coworkers (5) have recently shown that Arg-91 has a significant effect on the CL-induced redox activity of cyt c, and Pletneva and coworkers (1, 12) have shown with time-resolved FRET measurements that CL interactions with cyt c cause a portion of the protein to exist in an extended conformation with an unfolded C-terminal helix. Moreover, this C-terminal peptide is membrane permeable (24). Inspection of the amino acid sequence of this C-terminal helical region of cyt c reveals a highly conserved –KKEERAD– sequence beginning with Lys-88. Helical wheel analysis shows a cluster of positive charges along one helix face, including Arg-91, and a polar surface with a cluster of negative charges on the opposite face. This arrangement would allow both electrostatic CL interactions with the positive helix surface to stabilize the pore and a polar and carboxylate-rich pore lining to facilitate passage of cyt c, not complexed with CL, as is observed (Fig. 3D).
In summary, we find that cyt c and CL in synthetic membranes can recreate some of the events required for membrane permeation and release of cyt c. The phenomena occur at lower concentrations than are estimated to exist in mitochondrial intermembrane space [estimates range as high as 5 mM (50)] and in the absence of other apoptotic machinery. The apoptotic migration of CL to the cholesterol-containing outer membrane (7) may attract cyt c to the outer membrane and afford cyt c the opportunity to act—either independently of, or possibly in cooperation with, other permeabilizing apoptotic agents such as tBid and Bax—on the outer membrane and help engineer its own escape. Other aspects of the cyt c–ATP–CL interaction in lipid vesicles are under current study.
Materials and Methods
Materials and Protein Labeling.
DOPC, 1,2-dipalmitoyl-sn-glycero-3-phosphocholine (DPPC), POPC, CL (heart, bovine-disodium salt), and cholesterol (chol) were purchased from Avanti Polar Lipids. N-(7-nitrobenz-2-oxa-1,3-diazol-4-yl)-1,2-dihexadecanoyl-sn-glycero-3-phosphoethanolamine, triethylammonium salt (NBD-PE); Lissamine rhodamine B 1,2-dihexadecanoyl-sn-glycero-3-phosphoethanolamine, triethylammonium salt (Rh-PE); Alexa Fluor 568 C5 maleimide; Alexa Fluor 633 C5 maleimide; and fluorescent dextran molecules (Texas Red–dextran conjugate, neutral, 10,000 and 70,000 molecular weight) were purchased from Invitrogen. Horse heart cyt c, yeast (Saccharomyces cerevisiae) cyt c (isoform 1), chicken egg white lysozyme, and all other reagents were purchased from Sigma-Aldrich. Yeast cyt c was labeled with maleimide dyes as described in the literature (29, 51, 52).
GUV Formation.
GUVs were formed by electroformation. Stock solutions of 1.0 mM total lipid in chloroform were made. Twenty to 50 µL of stock solution was placed dropwise onto the platinum wires of the electroformation chamber and dried under vacuum for 4 h. The chamber was then filled with 300 mM aqueous sucrose solution, and a 3.0-V alternating current (or 1.0-V alternating current for mixtures containing anionic lipids) electric field was applied across the wires at 10 Hz for 30 min, 3.0 Hz for 15 min, 1.0 Hz for 7 min, and 0.5 Hz for 7 min. For samples containing lipids with melting temperatures above room temperature, electroformation was conducted in an oven at temperatures of at least 50 °C; vesicles were then allowed to slowly cool to room temperature. GUVs composed entirely of lipids with melting temperatures below ambient conditions were formed by this protocol at room temperature.
Confocal Microscopy.
Vesicle samples were imaged at room temperature using the Leica TCS SP5 confocal system with Leica 63×/1.3 N.A. Plan Apo differential interference contrast glycerin immersion lens. Rh-PE, Alexa Fluor 568, and Texas Red were excited by diode-pumped solid-state laser at 561 nm; Texas Red was additionally excited by helium–neon laser at 594 nm; NBD-PE (a head group-labeled lipid with similar spectral properties to FITC) was excited by argon laser at 488 nm; and Alexa Fluor 633 was excited by helium–neon laser at 633 nm.
Glass bottom culture dishes were pretreated with 10% (vol/vol) BSA solution to prevent vesicles from adhering to glass, rinsed with deionized water, and dried. Twenty-five to 50 µL of prepared vesicle suspension and 50 µL of microscope buffer (10 mM Hepes, pH 7.4, adjusted to 336 mOsm with NaCl) were deposited on the glass slide and incubated ∼15 min to allow vesicles to settle to a single focal plane at the bottom of the sample.
Cyt c was dialyzed against microscope buffer. Dextran solutions were prepared in microscope buffer. A stock solution of cyt c or dextran (3–10 µM final diluted concentration) was added carefully to the top of the sample drop. Control experiments were performed with DOPC vesicles to obtain a zero-leakage measurement.
Cyt c was slightly in excess in the experiments. The cyt c:CL ratio varied from ∼2:1 to ∼40:1. In addition, the amount of cyt c in a sample was greater than what would fit on both leaflet surfaces of the GUVs. With a radius of ∼1.5 nm, cyt c occupies a surface area of ∼700 Å2, whereas CL and DOPC occupy areas of ∼120 and ∼70 Å2, respectively. For a GUV composed of 80:20 DOPC:CL, an average lipid molecule, then, would have a surface area of ∼80 Å2, and cyt c would saturate the surface of a GUV at a ratio of ∼1:9 cyt c:total lipid, or ∼1:2 cyt c:CL. This excess allowed us to observe the movement of non–lipid-bound cyt c from the GUV exterior to the interior.
Analysis of Confocal Images and Movies.
Confocal images and movies were analyzed using Leica Application Suite Advanced Fluorescence software. Vesicles that appeared multilamellar, aggregated before leaking, or had a diameter of less than 8 µm were not analyzed. Some vesicles that did not leak during the movies were analyzed for comparison. Vesicles were monitored over time for average fluorescent pixel intensity (correlating with concentration) for both dextran and cyt c fluorophores in a region of interest (ROI) that was manually centered in the interior of the vesicle cross section. This ROI was moved as needed to keep it within the vesicle interior. Monitoring was discontinued if the vesicle aggregated, collapsed, moved out of the field of view, or moved away from the monitoring ROI after leakage. Background intensity was monitored by placing an ROI near but outside the vesicle.
Concentration (cinterior,t) was normalized on a scale of 0–1 according to the equation cinterior,t = (binterior,t – binterior,control)/(bexterior – binterior,control), with b representing average pixel intensity and binterior,control representing in images average interior pixel intensity for the nonleaking DOPC control experiment, and in movies the average interior pixel intensity at time 0. For normalized leakage plots, bexterior was defined as the maximum average pixel intensity in an exterior ROI in any frame during monitoring of the leakage; to calculate permeability, bexterior was defined as the average pixel intensity in an exterior ROI at time t. Vesicle permeability (P) was taken as the gradient of the log-linear plot of the leakage profile plotted, in a manner similar to refs. 25 and 26, as –R/3 ln(1 – cinterior,t) against time t, with R as the GUV radius; derivation is from Nelson (53). Using Adobe Photoshop, images were enhanced only for brightness, contrast, color balance, and color levels.
Preparation of Carboxyfluorescein-Encapsulated Large Unilamellar Vesicles.
Lipid thin films were deposited by evaporating chloroform lipid solutions (10 μmol of total lipid per sample) in test tubes under argon and then overnight vacuum. The 100 mM 5-(and-6)-carboxyfluorescein was dissolved in LUV buffer (100 mM Hepes, pH 7.4, buffer with 150 mM NaCl). One milliliter of carboxyfluorescein solution was added to the tubes. Samples were incubated 30 min at 40 °C and then sonicated for 30 min via probe-tip sonicator in an ice-water bath. Suspensions were centrifuged 5 min at 10,000 × g relative centrifugal force and pipetted off sonicator tip debris. Samples were subjected to five freeze–thaw cycles using liquid nitrogen and a 40 °C water bath and extruded at 40 °C 19 times through a 200-nm pore size polycarbonate membrane using an Avanti Mini-Extruder. Vesicles were separated from nonencapsulated carboxyfluorescein using Sephadex G-25 PD-10 columns.
Carboxyfluorescein Leakage Assays.
Protein stock solutions were prepared in LUV buffer and run over DEAE Sephadex. Assays were performed on a Varioskan fluorescence microplate reader from Thermo Electron Corporation. Samples were excited at 470 nm and monitored at 525 nm (bandwidth, 12 nm). After initial fluorescence measurements, 100-μL aliquots of carboxyfluorescein-encapsulated LUVs were treated with stock solutions or LUV buffer for control (final diluted concentrations: 60 μM lysozyme or horse heart cyt c, 30 μM yeast cyt c, 0.1% Triton X-100). Fluorescence measurements were taken every 5 min. Samples treated with Triton X-100 were used to determine maximum fluorescence (fmax). Results at time x (fx) were normalized on a scale of 0–100 by subtracting the background signal at time 0 (f0) according to the equation: fnormalized = (fx – f0)/(fmax – f0) × 100. Carboxyfluorescein leakage in the presence of ATP was carried out similarly with added ATP at 2.75–16.7 mM final concentration (Fig. S5).
Supplementary Material
Acknowledgments
We thank Dr. Jia Su for discussions, Dr. John Eng for support on mass spectroscopy, and Dr. Joseph Goodhouse for assistance with the confocal microscope and software. We acknowledge the National Institutes of Health for support of this work (Method to Extend Research in Time Award 2R37 GM036298 to J.T.G.) and fellowship support from Eli Lilly (C.L.B.).
Footnotes
The authors declare no conflict of interest.
This article contains supporting information online at www.pnas.org/lookup/suppl/doi:10.1073/pnas.1303819110/-/DCSupplemental.
References
- 1.Hong Y, Muenzner J, Grimm SK, Pletneva EV. Origin of the conformational heterogeneity of cardiolipin-bound cytochrome C. J Am Chem Soc. 2012;134(45):18713–18723. doi: 10.1021/ja307426k. [DOI] [PMC free article] [PubMed] [Google Scholar]
- 2.Ow YP, Green DR, Hao Z, Mak TW. Cytochrome c: Functions beyond respiration. Nat Rev Mol Cell Biol. 2008;9(7):532–542. doi: 10.1038/nrm2434. [DOI] [PubMed] [Google Scholar]
- 3.Lahiri J, Fate GD, Ungashe SB, Groves JT. Multi-heme self-assembly in phospholipid vesicles. J Am Chem Soc. 1996;118(10):2347–2358. [Google Scholar]
- 4.Abe M, Niibayashi R, Koubori S, Moriyama I, Miyoshi H. Molecular mechanisms for the induction of peroxidase activity of the cytochrome c-cardiolipin complex. Biochemistry. 2011;50(39):8383–8391. doi: 10.1021/bi2010202. [DOI] [PubMed] [Google Scholar]
- 5.Rajagopal BS, Silkstone GG, Nicholls P, Wilson MT, Worrall JAR. An investigation into a cardiolipin acyl chain insertion site in cytochrome c. Biochim Biophys Acta. 2012;1817(5):780–791. doi: 10.1016/j.bbabio.2012.02.010. [DOI] [PubMed] [Google Scholar]
- 6.de Kruijff B, Cullis PR. Cytochrome c specifically induces non-bilayer structures in cardiolipin-containing model membranes. Biochim Biophys Acta. 1980;602(3):477–490. doi: 10.1016/0005-2736(80)90327-2. [DOI] [PubMed] [Google Scholar]
- 7.Ardail D, et al. Mitochondrial contact sites. Lipid composition and dynamics. J Biol Chem. 1990;265(31):18797–18802. [PubMed] [Google Scholar]
- 8.Schug ZT, Gottlieb E. Cardiolipin acts as a mitochondrial signalling platform to launch apoptosis. Biochim Biophys Acta. 2009;1788(10):2022–2031. doi: 10.1016/j.bbamem.2009.05.004. [DOI] [PubMed] [Google Scholar]
- 9.Kagan VE, et al. Cytochrome c acts as a cardiolipin oxygenase required for release of proapoptotic factors. Nat Chem Biol. 2005;1(4):223–232. doi: 10.1038/nchembio727. [DOI] [PubMed] [Google Scholar]
- 10.Balakrishnan G, et al. A conformational switch to beta-sheet structure in cytochrome c leads to heme exposure. Implications for cardiolipin peroxidation and apoptosis. J Am Chem Soc. 2007;129(3):504–505. doi: 10.1021/ja0678727. [DOI] [PMC free article] [PubMed] [Google Scholar]
- 11.Su J, Groves JT. Mechanisms of peroxynitrite interactions with heme proteins. Inorg Chem. 2010;49(14):6317–6329. doi: 10.1021/ic902157z. [DOI] [PMC free article] [PubMed] [Google Scholar]
- 12.Hanske J, et al. Conformational properties of cardiolipin-bound cytochrome c. Proc Natl Acad Sci USA. 2012;109(1):125–130. doi: 10.1073/pnas.1112312108. [DOI] [PMC free article] [PubMed] [Google Scholar]
- 13.Hüttemann M, et al. The multiple functions of cytochrome c and their regulation in life and death decisions of the mammalian cell: From respiration to apoptosis. Mitochondrion. 2011;11(3):369–381. doi: 10.1016/j.mito.2011.01.010. [DOI] [PMC free article] [PubMed] [Google Scholar]
- 14.Pecina P, et al. Phosphomimetic substitution of cytochrome C tyrosine 48 decreases respiration and binding to cardiolipin and abolishes ability to trigger downstream caspase activation. Biochemistry. 2010;49(31):6705–6714. doi: 10.1021/bi100486s. [DOI] [PubMed] [Google Scholar]
- 15.Sinibaldi F, et al. Insights into cytochrome c-cardiolipin interaction. Role played by ionic strength. Biochemistry. 2008;47(26):6928–6935. doi: 10.1021/bi800048v. [DOI] [PubMed] [Google Scholar]
- 16.Landeta O, et al. Reconstitution of proapoptotic BAK function in liposomes reveals a dual role for mitochondrial lipids in the BAK-driven membrane permeabilization process. J Biol Chem. 2011;286(10):8213–8230. doi: 10.1074/jbc.M110.165852. [DOI] [PMC free article] [PubMed] [Google Scholar]
- 17.Schafer B, et al. Mitochondrial outer membrane proteins assist Bid in Bax-mediated lipidic pore formation. Mol Biol Cell. 2009;20(8):2276–2285. doi: 10.1091/mbc.E08-10-1056. [DOI] [PMC free article] [PubMed] [Google Scholar]
- 18.Epand RF, Martinou JC, Fornallaz-Mulhauser M, Hughes DW, Epand RM. The apoptotic protein tBid promotes leakage by altering membrane curvature. J Biol Chem. 2002;277(36):32632–32639. doi: 10.1074/jbc.M202396200. [DOI] [PubMed] [Google Scholar]
- 19.Kuwana T, et al. Bid, Bax, and lipids cooperate to form supramolecular openings in the outer mitochondrial membrane. Cell. 2002;111(3):331–342. doi: 10.1016/s0092-8674(02)01036-x. [DOI] [PubMed] [Google Scholar]
- 20.Terrones O, et al. Lipidic pore formation by the concerted action of proapoptotic BAX and tBID. J Biol Chem. 2004;279(29):30081–30091. doi: 10.1074/jbc.M313420200. [DOI] [PubMed] [Google Scholar]
- 21.Basañez G, et al. Bax-type apoptotic proteins porate pure lipid bilayers through a mechanism sensitive to intrinsic monolayer curvature. J Biol Chem. 2002;277(51):49360–49365. doi: 10.1074/jbc.M206069200. [DOI] [PubMed] [Google Scholar]
- 22.Seddon JM. Structure of the inverted hexagonal (HII) phase, and non-lamellar phase transitions of lipids. Biochim Biophys Acta. 1990;1031(1):1–69. doi: 10.1016/0304-4157(90)90002-t. [DOI] [PubMed] [Google Scholar]
- 23.Trusova VM, Gorbenko GP, Molotkovsky JG, Kinnunen PKJ. Cytochrome c-lipid interactions: New insights from resonance energy transfer. Biophys J. 2010;99(6):1754–1763. doi: 10.1016/j.bpj.2010.06.017. [DOI] [PMC free article] [PubMed] [Google Scholar]
- 24.Jones S, Holm T, Mäger I, Langel U, Howl J. Characterization of bioactive cell penetrating peptides from human cytochrome c: Protein mimicry and the development of a novel apoptogenic agent. Chem Biol. 2010;17(7):735–744. doi: 10.1016/j.chembiol.2010.05.018. [DOI] [PubMed] [Google Scholar]
- 25.Schön P, et al. Equinatoxin II permeabilizing activity depends on the presence of sphingomyelin and lipid phase coexistence. Biophys J. 2008;95(2):691–698. doi: 10.1529/biophysj.108.129981. [DOI] [PMC free article] [PubMed] [Google Scholar]
- 26.Fuertes G, et al. Pores formed by Baxα5 relax to a smaller size and keep at equilibrium. Biophys J. 2010;99(9):2917–2925. doi: 10.1016/j.bpj.2010.08.068. [DOI] [PMC free article] [PubMed] [Google Scholar]
- 27.Apellániz B, Nieva JL, Schwille P, García-Sáez AJ. All-or-none versus graded: Single-vesicle analysis reveals lipid composition effects on membrane permeabilization. Biophys J. 2010;99(11):3619–3628. doi: 10.1016/j.bpj.2010.09.027. [DOI] [PMC free article] [PubMed] [Google Scholar]
- 28.Alam JM, Kobayashi T, Yamazaki M. The single-giant unilamellar vesicle method reveals lysenin-induced pore formation in lipid membranes containing sphingomyelin. Biochemistry. 2012;51(25):5160–5172. doi: 10.1021/bi300448g. [DOI] [PubMed] [Google Scholar]
- 29.Beales PA, Bergstrom CL, Geerts N, Groves JT, Vanderlick TK. Single vesicle observations of the cardiolipin-cytochrome C interaction: Induction of membrane morphology changes. Langmuir. 2011;27(10):6107–6115. doi: 10.1021/la104924c. [DOI] [PMC free article] [PubMed] [Google Scholar]
- 30.Kalanxhi E, Wallace CJA. Cytochrome c impaled: Investigation of the extended lipid anchorage of a soluble protein to mitochondrial membrane models. Biochem J. 2007;407(2):179–187. doi: 10.1042/BJ20070459. [DOI] [PMC free article] [PubMed] [Google Scholar]
- 31.Tuominen EK, Wallace CJ, Kinnunen PK. Phospholipid-cytochrome c interaction: Evidence for the extended lipid anchorage. J Biol Chem. 2002;277(11):8822–8826. doi: 10.1074/jbc.M200056200. [DOI] [PubMed] [Google Scholar]
- 32.Helfrich W. Elastic properties of lipid bilayers—theory and possible experiments. Z Naturforsch C. 1973;28(11):693–703. doi: 10.1515/znc-1973-11-1209. [DOI] [PubMed] [Google Scholar]
- 33.Marsh D. Elastic curvature constants of lipid monolayers and bilayers. Chem Phys Lipids. 2006;144(2):146–159. doi: 10.1016/j.chemphyslip.2006.08.004. [DOI] [PubMed] [Google Scholar]
- 34.Templer RH, Khoo BJ, Seddon JM. Gaussian curvature modulus of an amphiphilic monolayer. Langmuir. 1998;14(26):7427–7434. [Google Scholar]
- 35.Domanov YA, et al. Mobility in geometrically confined membranes. Proc Natl Acad Sci USA. 2011;108(31):12605–12610. doi: 10.1073/pnas.1102646108. [DOI] [PMC free article] [PubMed] [Google Scholar]
- 36.Mishra A, Gordon VD, Yang L, Coridan R, Wong GCL. HIV TAT forms pores in membranes by inducing saddle-splay curvature: Potential role of bidentate hydrogen bonding. Angew Chem Int Ed Engl. 2008;47(16):2986–2989. doi: 10.1002/anie.200704444. [DOI] [PubMed] [Google Scholar]
- 37.Imura Y, Nishida M, Ogawa Y, Takakura Y, Matsuzaki K. Action mechanism of tachyplesin I and effects of PEGylation. Biochim Biophys Acta. 2007;1768(5):1160–1169. doi: 10.1016/j.bbamem.2007.01.005. [DOI] [PubMed] [Google Scholar]
- 38.Doherty T, Waring AJ, Hong M. Peptide-lipid interactions of the beta-hairpin antimicrobial peptide tachyplesin and its linear derivatives from solid-state NMR. Biochim Biophys Acta. 2006;1758(9):1285–1291. doi: 10.1016/j.bbamem.2006.03.016. [DOI] [PubMed] [Google Scholar]
- 39.Smith PES, Brender JR, Ramamoorthy A. Induction of negative curvature as a mechanism of cell toxicity by amyloidogenic peptides: The case of islet amyloid polypeptide. J Am Chem Soc. 2009;131(12):4470–4478. doi: 10.1021/ja809002a. [DOI] [PMC free article] [PubMed] [Google Scholar]
- 40.Epand RF, Raguse TL, Gellman SH, Epand RM. Antimicrobial 14-helical beta-peptides: Potent bilayer disrupting agents. Biochemistry. 2004;43(29):9527–9535. doi: 10.1021/bi049414l. [DOI] [PubMed] [Google Scholar]
- 41.Jacobs T, Bruhn H, Gaworski I, Fleischer B, Leippe M. NK-lysin and its shortened analog NK-2 exhibit potent activities against Trypanosoma cruzi. Antimicrob Agents Chemother. 2003;47(2):607–613. doi: 10.1128/AAC.47.2.607-613.2003. [DOI] [PMC free article] [PubMed] [Google Scholar]
- 42.Willumeit R, et al. Structural rearrangement of model membranes by the peptide antibiotic NK-2. Biochim Biophys Acta. 2005;1669(2):125–134. doi: 10.1016/j.bbamem.2005.01.011. [DOI] [PubMed] [Google Scholar]
- 43.Valcarcel CA, et al. Effects of lipid composition on membrane permeabilization by sticholysin I and II, two cytolysins of the sea anemone Stichodactyla helianthus. Biophys J. 2001;80(6):2761–2774. doi: 10.1016/S0006-3495(01)76244-3. [DOI] [PMC free article] [PubMed] [Google Scholar]
- 44.Zidovska A, et al. Block liposomes from curvature-stabilizing lipids: Connected nanotubes, -rods, or -spheres. Langmuir. 2009;25(5):2979–2985. doi: 10.1021/la8022375. [DOI] [PMC free article] [PubMed] [Google Scholar]
- 45.Zhang ZY, Smith BD. High-generation polycationic dendrimers are unusually effective at disrupting anionic vesicles: Membrane bending model. Bioconjug Chem. 2000;11(6):805–814. doi: 10.1021/bc000018z. [DOI] [PubMed] [Google Scholar]
- 46.Ohvo-Rekilä H, Ramstedt B, Leppimäki P, Slotte JP. Cholesterol interactions with phospholipids in membranes. Prog Lipid Res. 2002;41(1):66–97. doi: 10.1016/s0163-7827(01)00020-0. [DOI] [PubMed] [Google Scholar]
- 47.Krasilnikov OV, et al. Pore formation by Vibrio cholerae cytolysin requires cholesterol in both monolayers of the target membrane. Biochimie. 2007;89(3):271–277. doi: 10.1016/j.biochi.2006.12.003. [DOI] [PubMed] [Google Scholar]
- 48.Patriarca A, et al. ATP acts as a regulatory effector in modulating structural transitions of cytochrome c: Implications for apoptotic activity. Biochemistry. 2009;48(15):3279–3287. doi: 10.1021/bi801837e. [DOI] [PubMed] [Google Scholar]
- 49.Kapetanaki SM, et al. Interaction of carbon monoxide with the apoptosis-inducing cytochrome c-cardiolipin complex. Biochemistry. 2009;48(7):1613–1619. doi: 10.1021/bi801817v. [DOI] [PubMed] [Google Scholar]
- 50.Forman HJ, Azzi A. On the virtual existence of superoxide anions in mitochondria: Thoughts regarding its role in pathophysiology. FASEB J. 1997;11(5):374–375. doi: 10.1096/fasebj.11.5.9141504. [DOI] [PubMed] [Google Scholar]
- 51.Perroud TD, Bokoch MP, Zare RN. Cytochrome c conformations resolved by the photon counting histogram: Watching the alkaline transition with single-molecule sensitivity. Proc Natl Acad Sci USA. 2005;102(49):17570–17575. doi: 10.1073/pnas.0508975102. [DOI] [PMC free article] [PubMed] [Google Scholar]
- 52.Lee AJ, Ensign AA, Krauss TD, Bren KL. Zinc porphyrin as a donor for FRET in Zn(II)cytochrome c. J Am Chem Soc. 2010;132(6):1752–1753. doi: 10.1021/ja909106p. [DOI] [PubMed] [Google Scholar]
- 53.Nelson P. Biological Physics: Energy, Information, Life. New York: Freeman; 2004. [Google Scholar]
Associated Data
This section collects any data citations, data availability statements, or supplementary materials included in this article.