

Abstract
The rhizosphere is a critical interface supporting the exchange of resources between plants and their associated soil environment. Rhizosphere microbial diversity is influenced by the physical and chemical properties of the rhizosphere, some of which are determined by the genetics of the host plant. However, within a plant species, the impact of genetic variation on the composition of the microbiota is poorly understood. Here, we characterized the rhizosphere bacterial diversity of 27 modern maize inbreds possessing exceptional genetic diversity grown under field conditions. Randomized and replicated plots of the inbreds were planted in five field environments in three states, each with unique soils and management conditions. Using pyrosequencing of bacterial 16S rRNA genes, we observed substantial variation in bacterial richness, diversity, and relative abundances of taxa between bulk soil and the maize rhizosphere, as well as between fields. The rhizospheres from maize inbreds exhibited both a small but significant proportion of heritable variation in total bacterial diversity across fields, and substantially more heritable variation between replicates of the inbreds within each field. The results of this study should facilitate expanded studies to identify robust heritable plant–microbe interactions at the level of individual polymorphisms by genome wide association, so that plant-microbiome interactions can ultimately be incorporated into plant breeding.
Most land plants grow in intimate association with complex microbiota. Microbes in both the phyllosphere and rhizosphere can be endophytic, epiphytic, or closely associated. Examples of close microbial associates in the phyllosphere include those inhabiting the fluid in pitcher plants (1), and close microbial associates in the rhizosphere include those not touching roots, but heavily influenced by root exudates in the nearby soil (2). The host plant often relies on the microbiome to provide it with critical nutrients, as minerals present in the soil may be in forms inaccessible to plants (2). In other cases, plant-associated microbes can act as protectants against phytopathogens (3), improve growth through production of phytohormones (4), help plants withstand heat (5), salt (6), and more. The plant, in turn, cultivates its microbiome by adjusting the soil pH, reducing competition for beneficial microbes, and providing an energy source, mostly in the form of carbon-rich rhizodeposits (2). Microbial community structure in the phyllosphere and rhizosphere often differ across plant species (7), as well as among genotypes within a single species (8, 9). Recent work with model systems (Arabidopsis thaliana cultivated under controlled conditions in natural soils) indicated that the host genotype has a small but measurable effect on the microbes inhabiting the endophyte compartment of the root (10, 11). Understanding interactions between microbiota and their host plants, and identifying the plant alleles controlling these interactions, could be transformational in plant breeding and biotechnology.
Maize is one of the most economically significant crops in the world, possesses exceptional phenotypic and molecular diversity (12), and is substantially influenced by environmentally conditional genetic variation (13). In addition, given its widespread planting in monoculture, maize may be viewed as an ecosystem engineer strongly responsible for shaping the agricultural environment for cohabitating species. Maize root exudates, such as sugars, organic acids, aromatics, and enzymes interact with soil traits, such as pH, water potential, texture, and nutrient availability, as well as existing microbial populations to promote growth and development of the plant. Recent work addressing the association between maize genotype and microbial diversity using 16S rRNA gene microarrays in a greenhouse setting or fingerprinting under field conditions support the notion that microbial diversity is related to plant genotype (8, 9) To date, however, the rhizosphere microbiota of mature plants growing under field conditions remain poorly characterized, and many of the roles and interactions of maize genetic diversity and the field environment (including the resident soil microbiota) remain to be elucidated.
Here, we characterize the rhizosphere microbiota across a genetically diverse collection of 27 modern maize inbreds (14) at their median flowering time in five agricultural field environments by pyrosequencing 16S rRNA gene amplicons. The fields were situated in two regions of the United States: two fields were located in the Midwest (Urbana, IL and Columbia, MO) and three fields in the Northeast (Aurora, Ithaca, and Lansing) in the state of New York. Each field included randomized and replicated plots of maize inbreds grown from seed obtained from a uniform stand in a single field environment. Roots of three to five randomly selected plants per genotype were gently processed for rhizosphere microbial DNA, for a total of ∼100 samples per field. This design allowed us to evaluate the effects of the environment, sample type (bulk soil or rhizosphere), maize genotype, and genotype-field interactions on the microbial community diversity.
Results
16S rRNA Gene Sequence Region Impacts Recovered Maize Rhizosphere Microbial Diversity.
Results from previous microbiota analyses in other systems (i.e., human gut microbiome) have suggested that the specific region of the 16S rRNA gene used to characterize microbial diversity can impact the diversity profile obtained (15). Furthermore, some commonly used primer pairs are prone to prime plastid genes (16). Thus, we first conducted a pilot study to test different 16S rRNA gene primer pairs on a subset of the samples, which included maize rhizosphere and bulk soil samples collected at median flowering time from one location (Columbia, MO) (Fig. 1 and Table S1). We tested four primer sets designed to amplify the V1–V2, V3–V4, V5–V8, and V6–V8 regions of the 16S rRNA genes (Materials and Methods).
Fig. 1.
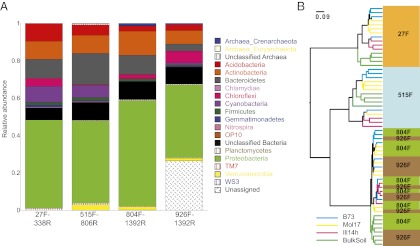
Primer set influences the diversity profiles of the rhizosphere and bulk soil microbiota. (A) Relative abundances of the phyla and domains recovered using four different primer pairs (27F-338R, 515F-806R, 804F-1392R, 926F-1392R) applied to rhizosphere soils recovered from three maize genotypes (B73, Mol17, Ill14h) and four bulk soil samples. (B) Hierarchical clustering of the weighted UniFrac distance metric for the same sample set. To highlight patterns of clustering, branches are colored by sample origin (maize genotypes and bulk soil: light blue, B73; yellow, Mo17; pink, Ill14h; and green, Bulk Soil). Primer pairs are indicated on the branch labels (the forward primer is indicated) and are highlighted by the colored boxes (27F: orange; 515F: blue; 804F: green; 926F: brown).
The primer pairs tested herein resulted in different absolute counts of sequence reads, with the 804F-1392R (V5–V8) primer set yielding the fewest sequences, likely because of the longer amplicons compared with the other primers used. Importantly, the different primer sets yielded slightly different diversity profiles at the phylum level (Fig. 1A). Specifically, the 515F-806R primer pair (V3–V4 region) yielded the greatest diversity at the domain and bacterial phylum levels (Fig. 1A). In contrast, the commonly used 27F-338R (V1–V2), which is specific to the bacterial domain, resulted in low amplification of members of the phylum Verrucomicrobia, known to be one of the dominant phyla in soil (17). Our results showed that the 926F-1392R primers (V6–V8) amplified the highest fraction of plastid 16S rRNA genes (“unassigned” in Fig. 1A). The four primer pairs tested also varied in the proportion of classifiable sequences (n ≥ 14, P < 2.00E-04) (Fig. S1).
We compared the β-diversity (between sample diversity) using the weighted UniFrac (18) distance metric (a phylogeny-based distance metric sensitive to sequence abundances). This analysis revealed differences in diversity based on the primer pair used (Fig. 1B). In particular, the 27F-338R and 515F-806R primed samples formed clear clusters, and a third cluster was formed by samples primed with the 804F-1392R and 926F-1392R primer pairs (Fig. 1B). However, within each of the three diversity clusters, the rhizosphere and bulk soil samples were consistently differentiable from the rhizosphere samples. Furthermore, within the 27F-338R and 515F-806R primed clusters, the three maize genotypes separated well, with the exception of three samples (Fig. 1B). In the third cluster (primers 804–1392R and 926F-1392R), the separation by genotype was less strong. Based on these results, we elected to amplify the V3–V4 region of the 16S rRNA gene (primers 515F-806R) in the full set of samples, consisting of maize inbred rhizosphere and matched bulk soil microbiome extractions across all five surveyed field environments.
Biogeography Effects on α-Diversity.
To directly compare the α-diversity [within-sample diversity or estimate of species richness (19)] of the samples with differing sequence counts/sampling efforts, we rarefied the data (i.e., randomly picked an equal number of sequence across samples) using QIIME (Quantitative Insights into Microbial Ecology) (20). Rarefaction curves, which show the observed operational taxonomic unit (OTU) richness as a function of pyrosequencing effort, indicated that the sequencing depth was insufficient to wholly capture the diversity present (Fig. S2). In addition to observed OTU richness, we used Faith’s PD [a phylogenetic measure of diversity based on total branch length of the bacterial 16S rRNA gene phylogeny captured by a sample (21)] and the Chao-1 estimator of total species richness (22), all of which yielded similar results (Table S2).
After controlling for factors, such as pyrosequencing run and PCR amplification batch, two important nongenetic factors accounted for a sizable fraction of the variation in OTU richness across samples: (i) the specific field [20.0% of variance; P < 2.00E-04; 95% confidence interval (CI) = 19.8%, 20.4%] (Fig. S2A), and (ii) the sample type (bulk soil or rhizosphere; 32.3% of variance; P < 2.00E-04; 95% CI = 32.0%, 32.6%) (Fig. S2B). The Columbia, MO field was the most OTU-rich field (n ≥ 258 OTUs, P < 8.00E-04) (Fig. S2A). However, the remaining field environments located near Urbana, IL and the three fields sampled in New York did not significantly differ in α-diversity. Interestingly, the microbiota of the organically managed field in Ithaca, NY did not differ significantly in species richness from the conventionally managed fields. In every comparison, the rhizosphere was less rich (lower bacterial α-diversity) than bulk soil (P < 2.00E-03) (Fig. S2B).
Biogeography Effects on β-Diversity.
We used the unweighted (sensitive to rare taxa) and weighted (based on abundances of taxa) UniFrac distance metrics to estimate β-diversity. A bootstrapped partial canonical analysis of principal coordinates (CAP) (23) was performed to assess how β-diversity could be partitioned into variation attributable to fields, sample type, and maize inbreds. This analysis differs from the commonly used unconstrained principle coordinate (PC) analysis (PCoA) representation of UniFrac distances in two ways: first, the variation attributable to technical variance is controlled for, and second, the ordination is constrained such that only the variation attributable to the factors of interest is displayed; however, we also applied unconstrained PCoA of both UniFrac distances as a comparison. The results of these analyses revealed that the majority of the variation in microbial diversity across the samples could be attributed to the field (Fig. 2 and Figs. S3–S5). Indeed, field environments explained the largest fraction of the variation in β-diversity measured by both unweighted (overall variation explained: 13.6%; P < 5.00E-03; 95% CI = 12.7%, 14.4%) (Fig. 2) and weighted UniFrac distance metrics (18.3%; P < 5.00E-03; 95% CI = 14.6%, 18.5%) (Fig. S3) after accounting for the variation present among sample types, maize inbreds, amplification batch, and sequence run. Fig. 2A shows clear clustering of the New York fields relative to the Midwestern fields. However, no significant differences were observed between the organically managed field located in Ithaca, NY and conventionally managed field environments. The clustering of New York field environments is visible (Fig. 2A) despite differences in soil composition (Fig. 3 and Fig. S6), implying that other factors, such as a shared climate, may be driving this pattern. A similar pattern was observed in the unconstrained PCoA analysis of unweighted UniFrac distances (Fig. S5A).
Fig. 2.

Factors influencing rhizosphere and soil microbiome β-diversity. Variation in unweighted UniFrac dispersion by: (A) field environment (significance P < 5.00E-03); (B) bulk soil and the maize rhizosphere (P < 5.00E-03); (C) bulk soil and maize rhizosphere within all field environments (P < 5.00E-02); and (D) maize inbreds (P < 5.00E-02). Note that the percent variation explained by the PCs of this CAP analysis is indicated on the axes and refers to the fraction of the total variance (indicated in main text) explained by field (A), sample type (B), sample type by field (C), and maize inbred (D).
Fig. 3.

Fields can be differentiated based on their physiochemical properties. Principal component analysis of the correlation matrix detailing soil relatedness among locations (Table S3). Soil samples are colored by field of origin. The percent variation explained by each PC is indicated on the axes.
After field, the most important source of variation in the microbial β-diversity was the sample type: maize rhizosphere versus bulk soil (Fig. 2B, and Figs. S3B and S4B). Sample type explained a substantial proportion of the total β-diversity across the field environments surveyed for unweighted (29.6%; P < 2.00E-04; 95% CI = 24.9%, 31.2%) and weighted UniFrac distance metrics (46.7%; P < 5.00E-03; 95% CI = 44.5%, 48.8%) after controlling for field, amplification batch, and sequencing run. Although significant, the proportion of variation captured by sample type within field environments remained small in both unweighted (3.7%; P < 5.00E-02; 95% CI = 0.8%, 4.7%) and weighted UniFrac measures (1.6%; P < 5.00E-02; 95% CI = 1.0%, 1.9%). Fig. 2C and Fig. S3C, which show the CAP analysis, indicate that for all fields, bulk and rhizosphere samples separate along PC2 in the same direction for each field and the PCoA results are similar (Figs. S4 and S5). In all fields, β-diversity was greater for samples derived from the maize rhizosphere than for those from bulk soil, indicating a potential for host genotype to induce these differences (Fig. 2 and Figs. S3–S5).
Variation in Specific OTU Abundances.
Given the high levels of OTU richness, and limited sequencing depth (Table S2), only the most abundant OTUs and those of the highest taxonomic ranks could be quantified with a level of precision sufficient to compare them on an individual basis. The most marked contrast in the abundance of microbial taxa was observed between the maize rhizosphere and bulk soil samples. The primer set chosen to characterize the full dataset was selected because of its enrichment of classifiable sequences as well as its reduced amplification of maize plastid-related sequences. As an internal control, it is interesting to note that plastid sequences still remained a significantly enriched OTU in the rhizosphere microbiome extractions compared with bulk soil samples (n ≥ 120, P < 4.00E-04).
Bacteria of the phylum Proteobacteria were enriched in the rhizosphere relative to bulk soil (n ≥ 120, P < 4.00E-04). Within the Proteobacteria, taxonomic orders with confirmed enrichment in the rhizosphere microbiome relative to bulk soil included Burkholderiales (n ≥ 120, P < 4.00E-04), Oceanospirillales (n ≥ 120, P < 4.00E-04), and Sphingobacteriales (n ≥ 120, P < 4.00E-04). Within this last group, Sphingobium herbicidium was especially enriched in rhizosphere samples (n ≥ 120, P < 4.00E-04). In contrast to Proteobacteria, bacterial taxa of the phyla Acidobacteria (n ≥ 120 P < 4.00E-04), Chloroflexi (n ≥ 120, P < 4.00E-04), Planctomycetes (n ≥ 120, P < 4.00E-04), and Verrucomicrobia (n ≥ 120, P < 4.00E-04) were all significantly depleted within the rhizosphere compared with bulk soil samples across the surveyed field environments.
Effects of Soil Physiochemical Properties.
Soil physicochemical properties of 15 randomly selected bulk soil samples were measured across each of the five field environments. These properties revealed substantial variation in the relative abundances of nitrate, phosphorous, potassium, and several other nutrients and minerals (Fig. S6 and Table S3). Significant pair-wise differences in all characteristics except moisture content were observed between field environments after Bonferroni multiple test correction. We correlated each of these characteristics with estimates of α- and β-diversity, as well as the rarefied abundances of the top 100 most common OTUs across the five field environments; however, no significant trends were observed. The raw unscaled physiochemical characteristics were plotted in scatter biplots to reveal their relationship with each other and with respect to field environment (Fig. S6). After centering and standardization to a common range, all soil nutrients were used to construct a correlation matrix detailing soil relatedness among the five environments. Principal component analysis of this metric showed that each soil presents a distinct chemical environment (Fig. 3). Of the Midwestern fields, the Columbia, MO field is most similar to the Northeastern fields in terms of physiochemical properties (Fig. 3). The most striking pattern, however, was that the rhizosphere communities of the three New York soils were quite similar, despite the fact that their chemical properties distinguished them quite strongly (Fig. 2C and Fig. S3C). This relatedness matrix of soil characteristics was compared with UniFrac estimates of β-diversity using a Mantel test; however, no significant trends were observed.
Host Genetic Influence on the Rhizosphere Microbiota.
Across all replicated plots and field environments, we found that a significant proportion of variation in OTU richness within samples was explained by differences between maize inbred genotypes (19.1%; P < 2.00E-04; 95% CI = 18.9%, 19.2%) (Fig. S2C) after controlling for field and technical factors (Materials and Methods). The maize inbred possessing the rhizosphere with the highest OTU richness was the sweet corn Ill14h. However, an additional sweet corn, P39, possessed a lower OTU richness than 20 of the 27 maize inbreds surveyed.
We found that the OTU richness in a given maize inbred relative to the other inbreds largely depended on the particular field in which they were grown (Fig. S2D). In our model, the interaction term that captures this pattern (between diverse maize inbred genotypes and a given field environment) explained 48.7% of the total variation in OTU richness (P < 2.00E-04, 95% CI = 48.5%, 49.1%). These important results indicate that within any given field environment, genotypes affect OTU richness; however, the manner by which they do so varies considerably between field environments.
To discern if β-diversity had a heritable component across all replicated plots and field environments, we calculated the proportion of total β-diversity explained by maize inbred genotypes after accounting for field and technical factors using CAP. We found that maize genotype explained a small but significant fraction of total variation in β-diversity as measured using unweighted (5.0%; P < 5.00E-02; 95% CI = 4.8%, 5.6%) and weighted (7.7%; P < 5.00E-02; 95% CI = 7.1%, 15.4%) UniFrac distance metrics. Fig. 2D and Fig. S3D display the weak patterning of maize inbreds when PC1 and PC2 for the CAP are plotted.
We performed another canonical analysis of principal coordinates to assess the field-specific heritable component of β-diversity. This analysis revealed that a significant proportion of total variation within each field environment was explained by maize genotype using both unweighted (17.9%; P < 5.00E-03; 95% CI = 14.3%, 19.9%) and weighted (25.3%; P < 5.00E-03; 95% CI = 21.8%, 27.7%) UniFrac distance metrics, after accounting for field, maize inbred and technical factors. Figs. S7 and S8 show patterns of within-field separation by genotype; in several of the fields and for subsets of the genotypes, the replicate genotype samples cluster together. As in the case of OTU richness, the results indicate that β-diversity is weakly explained by maize inbred genotype across all field environments, and that the field in which a genotype is planted strongly influences this relationship.
As a final evaluation of the relationship between maize host genotype and bacterial diversity, we sought to determine if the diversification history of maize and the flow of total genetic diversity could explain the α- and β-diversity of the maize inbred rhizosphere microbiota. To infer the flow of total genetic diversity, we constructed a genetic relationship matrix [using identity by state (24)] between all 27 maize inbreds from the over 1.4 million polymorphisms composing the first-generation maize hapmap (12). Estimates of both α- (OTU richness) and β-diversity (weighted and unweighted UniFrac metrics) were tested for their correlation with total genetic relatedness among the lines by regression for α-diversity and a Mantel test for both β-diversity measures. Despite the significant differences noted between microbial community profiles of maize inbreds, kinship of the 27 maize inbreds was not significantly correlated with α- or β-diversity estimates. Similarly, rarefied abundances of the most common OTUs were also compared with estimates of kinship among the maize inbred rhizospheres, but no significant correlations were observed. Finally, we performed additional analyses fitting flowering time, as measured by days to pollen shed, and total plant height as covariates within our models both across and within field environments, but neither trait explained a significant fraction of variation in α- or β-diversity estimates of the rhizosphere microbiota.
Discussion
In this study we characterized the rhizosphere microbial community composition of 27 modern maize inbreds planted in randomized and replicated plots in each of five field environments at flowering time. We also profiled the microbial communities of 15 bulk soil samples in random locations within each of the five field environments to characterize bulk soil microbial community composition. Our design permitted us to test the influence of maize host genotype on its rhizosphere microbial community across the field environments. This process also allowed us to assess the degree to which these plant–microbe interactions depend upon the field environment in which they are measured. Although effects were small, we found that the maize genotype significantly influences α- and β-diversity across field environments.
Our fields were located in two distinct climatic regions in the United States, with three fields (Aurora, Ithaca, and Lansing) in the Northeastern state of New York and two in the Midwest (Columbia, MO and Urbana, IL). We observed that the microbiota of the five fields clustered grossly by geographic proximity: the three New York soils harbored more similar microbiota compared with the two Midwestern fields. However, the microbiota of the two Midwestern fields were not most similar to one another, as the Columbia, MO soil microbiota showed greater similarity to the New York microbiota rather than the Urbana, IL microbiota. If geographical distance results in isolation and diversification of microbiota, we might expect substantially different microbiota to be present in the Northeastern and Midwestern soils, but this was not the case, suggesting that the regional and climatic differences between the Midwestern and Northeastern soils are insufficient to explain the biogeographic patterns observed herein. Interestingly, we found that the organic management at our Ithaca, NY site did not result in a markedly different microbiota compared with conventional management performed in the other fields, which is consistent with previous work showing a long-term effect of cultivation, but not field management, on soil microbial diversity (25). Previous work on bacterial communities from the North and South America has shown that latitude or geographic distance did not significantly influence diversity (26); however, soil pH was later shown to be the most influential factor (27). These results indicate that environmental heterogeneity, such as pH and moisture content, as well as geographic patterns, likely interact to shape the spatial scaling of the maize rhizosphere microbiota (28, 29), and that the nature of these interactions may differ by environment.
After between-field variation, the contrast between bulk soil and rhizosphere was the next most significant source of variation in microbiota composition. We observed a reduction in community richness and greater β-diversity for the maize rhizosphere microbiota compared with the bulk soil microbiota in all five field environments. The fact that rhizosphere microbiota differ from bulk soil microbiota is well established. What our findings adds to this general view is that the subset of rhizosphere microbiota enriched across replicates of a given plant genotype within an environment can vary quite substantially across environments. We stress that even after accounting for genotypic differences and environmental differences their interaction appears highly important.
We observed a few taxa to be consistently enriched in the maize rhizosphere, for example the orders Burkholderiales, Oceanospirillales, and Sphingobacteriales of the Proteobacteria. Proteobacteria, and the order Burkholderiales in particular, have been shown previously to be enriched in the maize rhizosphere (8, 30, 31). Recent studies in Oak (32) and A. thaliana (10, 11) have also noted a rhizosphere (and endophyte in Arabidopsis) enrichment of Proteobacteria. Although in our study most bacterial taxa of lower rank were not sequenced at a high enough read depth to enable powerful comparisons, we did observe an enrichment of the genus Sphingobium, which is a well-known aerobic rhizosphere bacterium and has, for example, been isolated from the rhizosphere of Populus deltoides (33). Taken together, these results underscore the fact that Proteobacteria are adapted to the plant rhizosphere generally and across diverse plant species. This finding is not surprising, as Proteobacteria are well known to respond to labile carbon sources, and are generally considered to be r-selected, or weedy fast-growing microbiota whose populations fluctuate opportunistically (34). In contrast to the rhizosphere, the bulk soil is generally considered to be enriched in k-selected microbiota, or slower growing microbiota with more stable population sizes. In our study the bulk soil-enriched phyla included the Acidobacteria, Chloroflexi, Verrucomicrobia, and Planctomycetes, which have been previously described as soil oligotrophs (34, 35).
We found a small but significant fraction of variation in microbial diversity (both α- and β-diversity) that could be attributed to host genetics. Furthermore, we observed significant maize inbred by environment interaction that explained a substantial portion of the variation in diversity between rhizospheres. Bouffaud et al. have recently indicated that maize genotype can influence rhizosphere microbiota in 21-d-old seedlings grown in a greenhouse (9). Similarly, we have recently shown in a pyrosequencing-based study of eight A. thaliana inbred genotypes grown in two soil types under controlled conditions that genotype explains a similar fraction of variation in the endophyte microbiota (11). Greenhouse or well-regulated growth-chamber experiments can control variables such as climate and soil heterogeneity more tightly than field trials, and might be expected to yield a higher heritability. Field trials such as those performed here allow us to control variables, such as climate and soil heterogeneity, statistically through blocking and replication, and also enabled us to estimate environmental dependencies. Given the large proportion of microbial diversity between maize inbred genotypes that was field-specific, however, it is likely many relationships observed within the greenhouse will not be replicable in the field. Both field and greenhouse studies are needed and will benefit from greater sequencing depth, which may account in part for the low heritability estimates obtained (i.e., lack of power to detect effects).
Although we did detect a statistically significant but low level of heritability for the rhizosphere microbiota, we could not relate the kinship matrix for the maize inbreds to the microbiota diversity profiles in this study. Given such low heritability and limited effective population size, the most likely reason for our inability to explain a substantial fraction of the heritable variance by kinship is a lack of statistical power. Nonetheless, the lack of a relationship between the maize kinship matrix and microbial diversity may suggest the microbial community is controlled by a few major alleles, rather than by many alleles of small effect located throughout the genome. It is also possible that effects on microbiota are very indirect. One such scenario could be that the microbiota diversity reflects resource distribution and the carbon source to sink relationships within the plant. For example, diverting carbohydrate to the kernels may allow for less carbon exudation from the roots. To begin addressing this possibility, we included covariates for flowering time and height in our analyses. However, neither trait had a significant effect on diversity. In the future, similar relationships with microbial diversity should be explored across many more phenotypes.
In summary, this study shows evidence of heritable variation in rhizosphere microbial community composition and considerable field-specific heritable variation. However, the following questions remain: What specific segregating maize alleles are responsible for this microbial variation? What phenotypic differences do they encode between the maize inbred rhizospheres? And finally, what specific elements of microbial diversity are being acted upon by these phenotypic differences? Larger effective maize populations and a deeper, more focused sequencing effort on the existing rhizosphere microbial diversity are necessary to characterize the symbioses that exist under natural environmental conditions. Focusing on functional groups of microbes rather than taxonomic relatedness of the microbial community may enhance future studies. In addition, surveying maize landraces and a pool of diversity capturing allelic variation that existed before breeding for adaptation to the heavily fertilized field environments of modern industrial agriculture may reveal functional alleles and symbiotic relationships not captured in this analysis.
Materials and Methods
Twenty-six maize genotypes planted in replicate plots in five fields in two regions were sampled at flowering time for rhizosphere soil microbiota. Microbial diversity was characterized by sequencing 16S rRNA gene sequences amplified by PCR from bulk DNA extractions, using the Roche 454 Titanium platform. Bulk soil samples were also profiled for chemical content. The 16S rRNA gene sequence analysis was performed with the software QIIME (20). Details for the methods stated here, as well as the statistical analyses conducted, are discussed further in SI Materials and Methods.
Supplementary Material
Acknowledgments
We thank Dr. Sherry Flint-Garcia, Dr. Stephen Moose, and Dr. Margaret Smith, as well as their field assistants at the University of Missouri, University of Illinois, and Cornell University, respectively, for growth and management of the maize fields; undergraduate students Sarah Asman, Elle Glenny, and Eric Morris for their assistance in sample collection and processing; and members of the E.S.B. and R.E.L. laboratories for scientific insight and review of the manuscript. This research was supported by National Science Foundation Grants IOS-0958184 (to R.E.L.) and IOS-0958245 (to J.L.D.), and by the Howard Hughes Medical Institute-Gordon and Betty Moore Foundation. The work conducted by the US Department of Energy Joint Genome Institute is supported by the Office of Science of the US Department of Energy under Contract DE-AC02-05CH11231. J.L.D. is a Howard Hughes Medical Institute-Gordon and Betty Moore Foundation Plant Science Investigator. R.E.L. is a Fellow of the David and Lucile Packard Foundation, the Arnold and Mabel Beckman Foundation, and The Hartwell Foundation.
Footnotes
The authors declare no conflict of interest.
Data deposition: The sequence reported in this paper has been deposited in the QIIME (Quantitative Insights into Microbial Ecology) database (study no. 1792).
This article contains supporting information online at www.pnas.org/lookup/suppl/doi:10.1073/pnas.1302837110/-/DCSupplemental.
References
- 1.Koopman MM, Fuselier DM, Hird S, Carstens BC. The carnivorous pale pitcher plant harbors diverse, distinct, and time-dependent bacterial communities. Appl Environ Microbiol. 2010;76(6):1851–1860. doi: 10.1128/AEM.02440-09. [DOI] [PMC free article] [PubMed] [Google Scholar]
- 2.Bais HP, Weir TL, Perry LG, Gilroy S, Vivanco JM. The role of root exudates in rhizosphere interactions with plants and other organisms. Annu Rev Plant Biol. 2006;57(1):233–266. doi: 10.1146/annurev.arplant.57.032905.105159. [DOI] [PubMed] [Google Scholar]
- 3.Innerebner G, Knief C, Vorholt JA. Protection of Arabidopsis thaliana against leaf-pathogenic Pseudomonas syringae by Sphingomonas strains in a controlled model system. Appl Environ Microbiol. 2011;77(10):3202–3210. doi: 10.1128/AEM.00133-11. [DOI] [PMC free article] [PubMed] [Google Scholar]
- 4.Ali B, Sabri AN, Ljung K, Hasnain S. Auxin production by plant associated bacteria: Impact on endogenous IAA content and growth of Triticum aestivum L. Lett Appl Microbiol. 2009;48(5):542–547. doi: 10.1111/j.1472-765X.2009.02565.x. [DOI] [PubMed] [Google Scholar]
- 5.Castiglioni P, et al. Bacterial RNA chaperones confer abiotic stress tolerance in plants and improved grain yield in maize under water-limited conditions. Plant Physiol. 2008;147(2):446–455. doi: 10.1104/pp.108.118828. [DOI] [PMC free article] [PubMed] [Google Scholar]
- 6.Zhang H, et al. Soil bacteria confer plant salt tolerance by tissue-specific regulation of the sodium transporter HKT1. Mol Plant Microbe Interact. 2008;21(6):737–744. doi: 10.1094/MPMI-21-6-0737. [DOI] [PubMed] [Google Scholar]
- 7.Kuske CR, et al. Comparison of soil bacterial communities in rhizospheres of three plant species and the interspaces in an arid grassland. Appl Environ Microbiol. 2002;68(4):1854–1863. doi: 10.1128/AEM.68.4.1854-1863.2002. [DOI] [PMC free article] [PubMed] [Google Scholar]
- 8.Aira M, Gómez-Brandón M, Lazcano C, Bååth E, Domínguez J. Plant genotype strongly modifies the structure and growth of maize rhizosphere microbial communities. Soil Biol Biochem. 2010;42(12):2276–2281. [Google Scholar]
- 9.Bouffaud M-L, et al. Is diversification history of maize influencing selection of soil bacteria by roots? Mol Ecol. 2012;21(1):195–206. doi: 10.1111/j.1365-294X.2011.05359.x. [DOI] [PubMed] [Google Scholar]
- 10.Bulgarelli D, et al. Revealing structure and assembly cues for Arabidopsis root-inhabiting bacterial microbiota. Nature. 2012;488(7409):91–95. doi: 10.1038/nature11336. [DOI] [PubMed] [Google Scholar]
- 11.Lundberg DS, et al. Defining the core Arabidopsis thaliana root microbiome. Nature. 2012;488(7409):86–90. doi: 10.1038/nature11237. [DOI] [PMC free article] [PubMed] [Google Scholar]
- 12.Gore MA, et al. A first-generation haplotype map of maize. Science. 2009;326(5956):1115–1117. doi: 10.1126/science.1177837. [DOI] [PubMed] [Google Scholar]
- 13.Buckler ES, et al. The genetic architecture of maize flowering time. Science. 2009;325(5941):714–718. doi: 10.1126/science.1174276. [DOI] [PubMed] [Google Scholar]
- 14.McMullen MD, et al. Genetic properties of the maize nested association mapping population. Science. 2009;325(5941):737–740. doi: 10.1126/science.1174320. [DOI] [PubMed] [Google Scholar]
- 15.Human Microbiome Project Consortium Structure, function and diversity of the healthy human microbiome. Nature. 2012;486(7402):207–214. doi: 10.1038/nature11234. [DOI] [PMC free article] [PubMed] [Google Scholar]
- 16.Chelius MK, Triplett EW. The diversity of Archaea and Bacteria in association with the roots of Zea mays L. Microb Ecol. 2001;41(3):252–263. doi: 10.1007/s002480000087. [DOI] [PubMed] [Google Scholar]
- 17.Janssen PH. Identifying the dominant soil bacterial taxa in libraries of 16S rRNA and 16S rRNA genes. Appl Environ Microbiol. 2006;72(3):1719–1728. doi: 10.1128/AEM.72.3.1719-1728.2006. [DOI] [PMC free article] [PubMed] [Google Scholar]
- 18.Lozupone C, Knight R. UniFrac: A new phylogenetic method for comparing microbial communities. Appl Environ Microbiol. 2005;71(12):8228–8235. doi: 10.1128/AEM.71.12.8228-8235.2005. [DOI] [PMC free article] [PubMed] [Google Scholar]
- 19.Jurasinski G, Retzer V, Beierkuhnlein C. Inventory, differentiation, and proportional diversity: A consistent terminology for quantifying species diversity. Oecologia. 2009;159(1):15–26. doi: 10.1007/s00442-008-1190-z. [DOI] [PubMed] [Google Scholar]
- 20.Caporaso JG, et al. QIIME allows analysis of high-throughput community sequencing data. Nat Methods. 2010;7(5):335–336. doi: 10.1038/nmeth.f.303. [DOI] [PMC free article] [PubMed] [Google Scholar]
- 21.Faith DP. Conservation evaluation and phylogenetic diversity. Biol Conserv. 1992;61(1):1–10. [Google Scholar]
- 22.Chao A. Non-parametric estimation of the number of classes in a population. Scand J Stat. 1984;11(4):265–270. [Google Scholar]
- 23.Anderson MJ, Willis TJ. Canonical analysis of principal coordinates: A useful method of constrained ordination for ecology. Ecology. 2003;84(2):511–525. [Google Scholar]
- 24.Loiselle BA, Sork VL, Nason J, Graham C. Spatial genetic structure of a tropical understory shrub, Psychotria officinalis (Rubiaceae) Am J Bot. 1995;82(11):1420–1425. [Google Scholar]
- 25.Buckley DH, Schmidt TM. The structure of microbial communities in soil and the lasting impact of cultivation. Microb Ecol. 2001;42(1):11–21. doi: 10.1007/s002480000108. [DOI] [PubMed] [Google Scholar]
- 26.Fierer N, Jackson RB. The diversity and biogeography of soil bacterial communities. Proc Natl Acad Sci USA. 2006;103(3):626–631. doi: 10.1073/pnas.0507535103. [DOI] [PMC free article] [PubMed] [Google Scholar]
- 27.Lauber CL, Hamady M, Knight R, Fierer N. Pyrosequencing-based assessment of soil pH as a predictor of soil bacterial community structure at the continental scale. Appl Environ Microbiol. 2009;75(15):5111–5120. doi: 10.1128/AEM.00335-09. [DOI] [PMC free article] [PubMed] [Google Scholar]
- 28.Berg G, Smalla K. Plant species and soil type cooperatively shape the structure and function of microbial communities in the rhizosphere. FEMS Microbiol Ecol. 2009;68(1):1–13. doi: 10.1111/j.1574-6941.2009.00654.x. [DOI] [PubMed] [Google Scholar]
- 29.Green J, Bohannan BJ. Spatial scaling of microbial biodiversity. Trends Ecol Evol. 2006;21(9):501–507. doi: 10.1016/j.tree.2006.06.012. [DOI] [PubMed] [Google Scholar]
- 30.Chauhan PS, Chaudhry V, Mishra S, Nautiyal CS. Uncultured bacterial diversity in tropical maize (Zea mays L.) rhizosphere. J Basic Microbiol. 2011;51(1):15–32. doi: 10.1002/jobm.201000171. [DOI] [PubMed] [Google Scholar]
- 31.Salles JF, van Veen JA, van Elsas JD. Multivariate analyses of Burkholderia species in soil: Effect of crop and land use history. Appl Environ Microbiol. 2004;70(7):4012–4020. doi: 10.1128/AEM.70.7.4012-4020.2004. [DOI] [PMC free article] [PubMed] [Google Scholar]
- 32.Uroz S, Buee M, Murat C, Frey-Klett P, Martin F. Pyrosequencing reveals a contrasted bacterial diversity between oak rhizosphere and surrounding soil. Env Microbiol Rep. 2010;2(2):281–288. doi: 10.1111/j.1758-2229.2009.00117.x. [DOI] [PubMed] [Google Scholar]
- 33.Brown SD, et al. Twenty-one genome sequences from Pseudomonas species and 19 genome sequences from diverse bacteria isolated from the rhizosphere and endosphere of Populus deltoides. J Bacteriol. 2012;194(21):5991–5993. doi: 10.1128/JB.01243-12. [DOI] [PMC free article] [PubMed] [Google Scholar]
- 34.Fierer N, Bradford MA, Jackson RB. Toward an ecological classification of soil bacteria. Ecology. 2007;88(6):1354–1364. doi: 10.1890/05-1839. [DOI] [PubMed] [Google Scholar]
- 35.Fuerst JA. The planctomycetes: emerging models for microbial ecology, evolution and cell biology. Microbiology. 1995;141(Pt 7):1493–1506. doi: 10.1099/13500872-141-7-1493. [DOI] [PubMed] [Google Scholar]
Associated Data
This section collects any data citations, data availability statements, or supplementary materials included in this article.