Significance
Gliding is a form of enigmatic bacterial surface motility that does not use visible external structures such as flagella or pili. This study characterizes the single-molecule dynamics of the Myxococcus xanthus gliding motor protein AglR, a homolog of the Escherichia coli flagella stator protein MotA. However, the Myxococcus motors, unlike flagella stators, lack peptidoglycan-binding domains. With photoactivatable localization microscopy (PALM), we found that these motor proteins move actively within the cell membrane and generate torque by accumulating in clusters that exert force on the gliding surface. Our model unifies gliding and swimming with conserved power-generating modules.
Keywords: PALM, protein dynamics
Abstract
Many bacterial species use gliding motility in natural habitats because external flagella function poorly on hard surfaces. However, the mechanism(s) of gliding remain elusive because surface motility structures are not apparent. Here, we characterized the dynamics of the Myxococcus xanthus gliding motor protein AglR, a homolog of the Escherichia coli flagella stator protein MotA. We observed that AglR decorated a helical structure, and the AglR helices rotated when cells were suspended in liquid or when cells moved on agar surfaces. With photoactivatable localization microscopy, we found that single molecules of AglR, unlike MotA/MotB, can move laterally within the membrane in helical trajectories. AglR slowed down transiently at gliding surfaces, accumulating in clusters. Our work shows that the untethered gliding motors of M. xanthus, by moving within the membrane, can transform helical motion into linear driving forces that push against the surface.
Motility is a fundamental function that facilitates the survival of bacteria in their natural habitats and is a crucial virulence determinant of pathogenesis (1, 2). Although most bacterial species use flagella rotation or pili extension/retraction for locomotion, other species, such as Myxococcus xanthus, glide smoothly on solid surfaces unaided by flagella or pili (3, 4). The mechanism(s) of gliding have remained elusive for more than a century because gliding cells lack obvious external motility structures.
In M. xanthus, homologs of Escherichia coli flagella stator proteins power gliding motility by using proton motive force (PMF) and multiprotein complexes that span the cytoplasm, membrane, and periplasm (5–7). It remains unclear how force generated by motor proteins can be transmitted to the cell surface without disrupting the peptidoglycan layer and how the reported bidirectional movement of motors can generate unidirectional gliding motion (6).
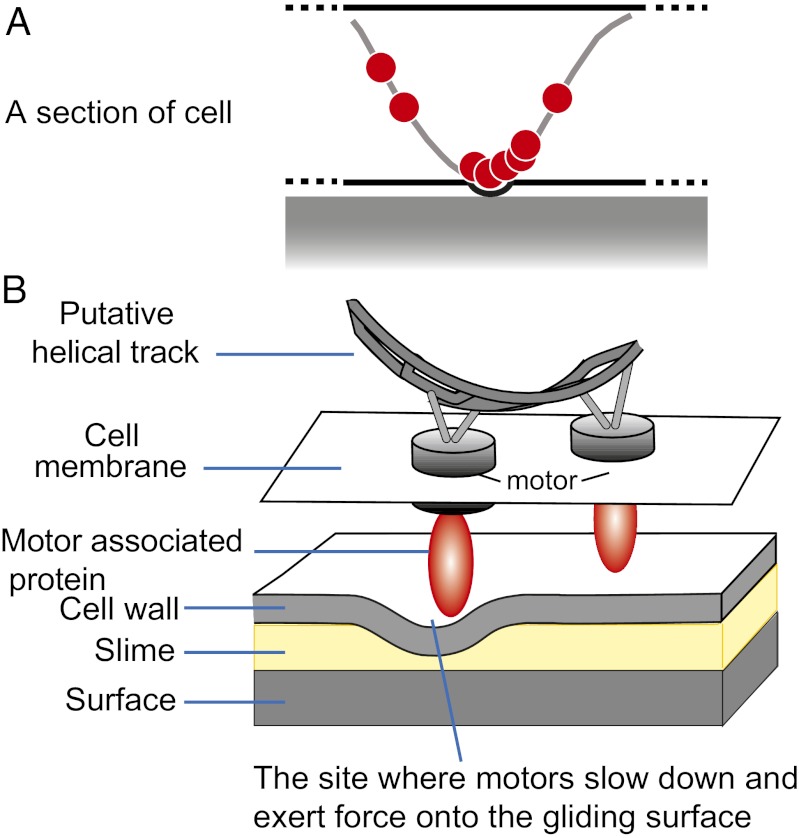
In reviewing the sequences of the MotAB homologs, AglR, AglQ, and AglS, we noted that AglQ and AglS, the MotB homologs lack the C-terminal peptidoglycan attachment motif characteristic of E. coli MotB (Fig. S1), making them free to move within the membrane as motors. Based on this evidence, the “helical rotor model” proposes a detailed mechanism of force generation (Fig. 1). In this model, the flagella stator homologs function as motors by moving in helical trajectories. When the motor complexes contact the surface, they slow down and accumulate in “clusters” that deform the cell surface (6). The moving distortions may push cells forward against the slime that is deposited onto the surface during gliding (8) (Fig. 1).
Fig. 1.
Simplified helical rotor model of gliding motility. (A) The motors push against the looped helical track (gray band). At the sites where cells contact the gliding surface, motor complexes exert force against the cell envelope. As a result, the motor complexes slow down and aggregate into protein clusters, which appear as “focal adhesion” sites in previous reports (5, 17). (B) Zoom-in view of the motor complexes. The high drag on the red cargo protein results from its bulky geometry, which deforms the cell envelope locally. The bump formed at the surface induces a high drag force on the motor. This figure is adapted from ref. 6.
The helical rotor model explains the following experimental observations: (i) MotAB homologs, PMF, and MreB are all required for gliding motility (6, 9); (ii) the motility complexes move in both directions, along bidirectional cytoskeleton filaments, evidenced by the observation that irradiated motility protein AgmU-mCherry recovers within seconds in both directions in fluorescence recovery after photobleaching (FRAP) experiments (6); (iii) cells placed on soft agar or suspended in water are nonmotile, but the AgmU helices keep rotating [in this case, there are no slowed motor proteins (traffic jams) without the resistance encountered with a surface and therefore no axial thrust is generated] (6); (iv) cells on hard surfaces show almost stationary AgmU clusters because hard surfaces cause motor proteins to slow down and stall (5); (v) cells align with stress lines in the substrate (elasticotaxis) (10); and (vi) the cell surface is uneven, showing undulations by total internal reflection (TIR) fluorescence microscopy (6).
Results and Discussion
AglR Decorates a Rotating Helical Structure.
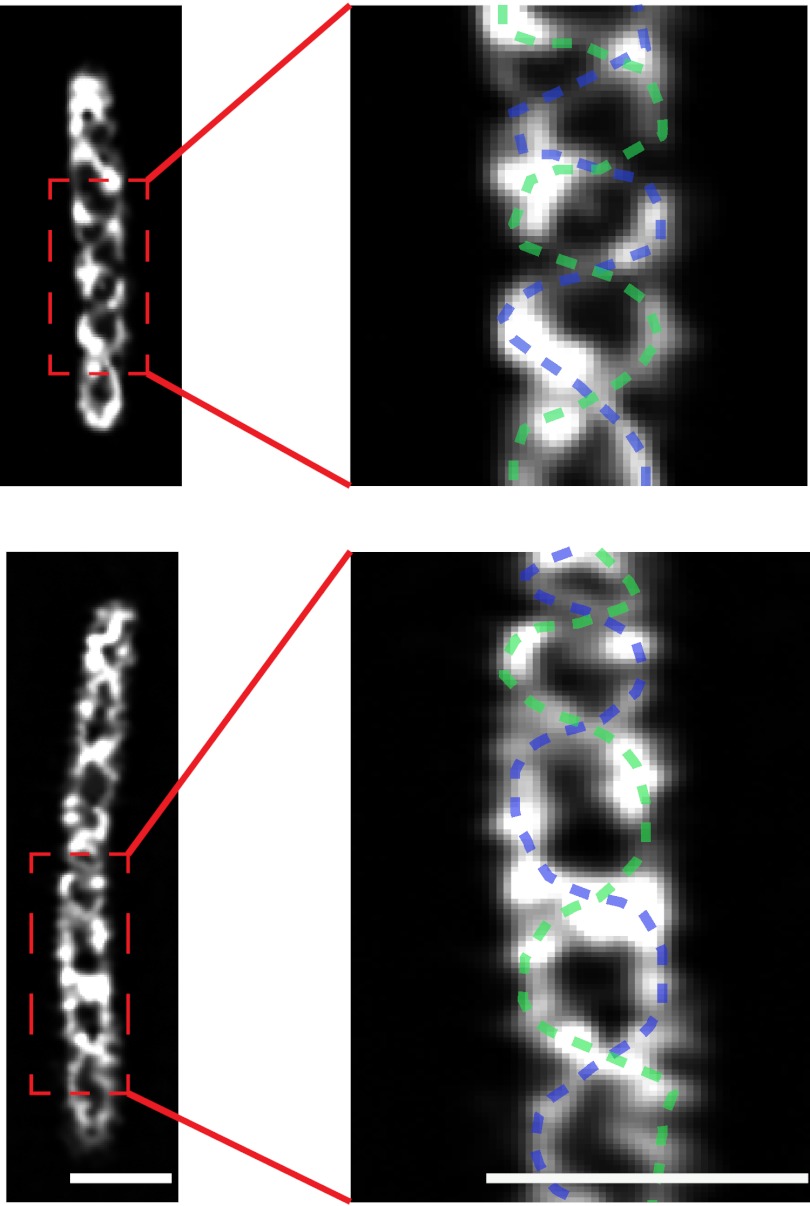
To further investigate the mechanism of gliding, we monitored the movement of motor complexes as cells glide on 1.5% (wt/vol) agar surfaces. The motors of M. xanthus consist of protein complexes formed by AglR, a homolog of E. coli MotA, and two MotB homologs AglQ and AglS (6, 7). Direct evidence for the role of this complex in gliding was provided by a mutation in the predicted proton-binding site of AglQ that blocked gliding (7). Therefore, in this study, we investigated the structure and dynamics of AglR using superresolution microscopy. AglR was labeled with photo-activatable mCherry (pamCherry) fused to its C terminus (11). This strain maintained WT gliding motility (Fig. S2). Using structured illumination microscopy (SIM), we observed that AglR decorated a double helical structure in fixed cells (Fig. 2; Movies S1 and S2). The pitch of AglR-decorated helices was 1.34 ± 0.51 μm (mean ± SD, n = 10), similar to the pattern of AgmU, a putative motor-associated protein (5, 6). Additionally, the helices rotated with a similar velocity to that observed for AgmU when live cells were suspended in 1% (wt/vol) methylcellulose (Movies S3 and S4) or when they moved on agar surfaces (Movie S5) (6), consistent with the report that AglR and AgmU belong to the same gliding machinery (12). Although the SIM images show the AglR macrostructure to be clearly helical, we could not exclude possible artifacts introduced by the cell fixation procedure and the algorithms of image processing. It is therefore necessary to track the movements of AglR at the single molecule level to better elucidate the dynamics of the gliding motors.
Fig. 2.
AglR-pamCherry decorates helical macrostructures. SIM images of two typical fixed aglR::pamCherry cells are shown. For each cell, the surface sections are displayed, in which void areas are encircled by helical fluorescence. The distance between adjacent nodes of the helices (half of helical pitch) was 0.67 ± 0.25 μm. Traces of the helical macrostructures are shown on a magnified section of each cell. (Scale bar, 1 μm.) The Z-stack SIM images are shown in Movies S1 and S2.
Single Molecules of AglR Move in Helical Trajectories.
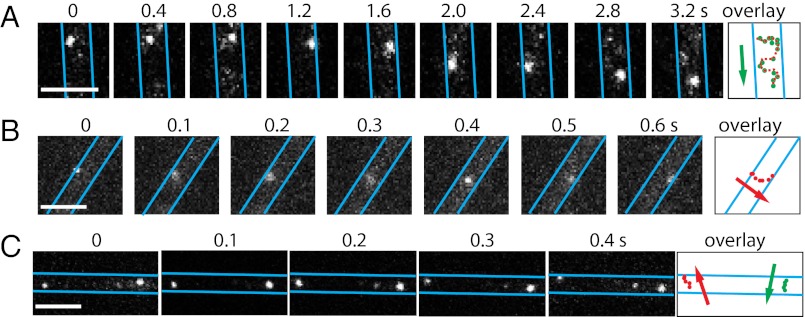
To follow the motility of individual complexes in live cells, we photoactivated a small fraction of AglR-pamCherry molecules and imaged them at 200-ms intervals. The photoactivated AglR-pamCherry molecules appeared isolated from each other. The intensity of each fluorescent spot was very similar, and each spot bleached out instantly in a one-step manner (Fig. S3). From these results we conclude that the fluorescence spots we tracked are single molecules of AglR rather than clusters of multiple AglR molecules. AglR moved along the cell widths and the cell lengths, projecting zigzag trajectories in two dimensions. Considering the fact that AglR moves within the restriction of cylindrical cell membranes, the only reasonable explanation of the observed zigzag tracks in two dimensions is that AglR molecules move in helical trajectories in three dimensions (Fig. 3A; Movies S6 and S7). On average, AglR traveled 655 ± 283 nm (mean ± SD, n = 10) along the cell length when moving across the cell width, equivalent to half of the helical pitch of the AglR helix. The movement of AglR is a specific motility-related behavior, because another pamCherry-labeled MotA homolog (MXAN_6483) that has no function in gliding did not show any motion (Movie S8).
Fig. 3.
The motility of single AglR molecules. (A) 2D trajectory of a single AglR-pamCherry was recorded at 200-ms intervals. The cell boundaries were marked with blue lines. The overlay shows the AglR position in consecutive frames. (B) Bottom half of the cells were excited by TIR, and AglR motility was recorded at 100-ms intervals. (C) Two individual AglR molecules rotate in opposite directions, suggesting that AglR rotation is not a result of cell body rotation. (Scale bars, 1 µm.) Only sections of cells are shown in this figure. The images of whole cells are shown in Movies S6, S7, S9, S10, and S11.
To track AglR movements near surfaces at 100-ms intervals, we imaged the bottom half of the cells under near total internal reflection (TIR) illumination (13, 14). Fig. 3B and Movies S9 and S10 show AglR molecules moving across cell widths, consistent with the rotational movements of the AglR-decorated helices shown in Movies S3 and S4. Because we frequently observed AglR molecules moving in opposite directions within the same cell, AglR movements were unlikely to be the result of cellular rotation (Fig. 3C; Movie S11). In fact, cellular rotation is only rarely observed during gliding (15). The observed displacements along the cell length were not due to gliding either, because cells moved less than 50 nm during the same time period (∼500 ms). Collectively, these results show that AglR molecules move in helical trajectories.
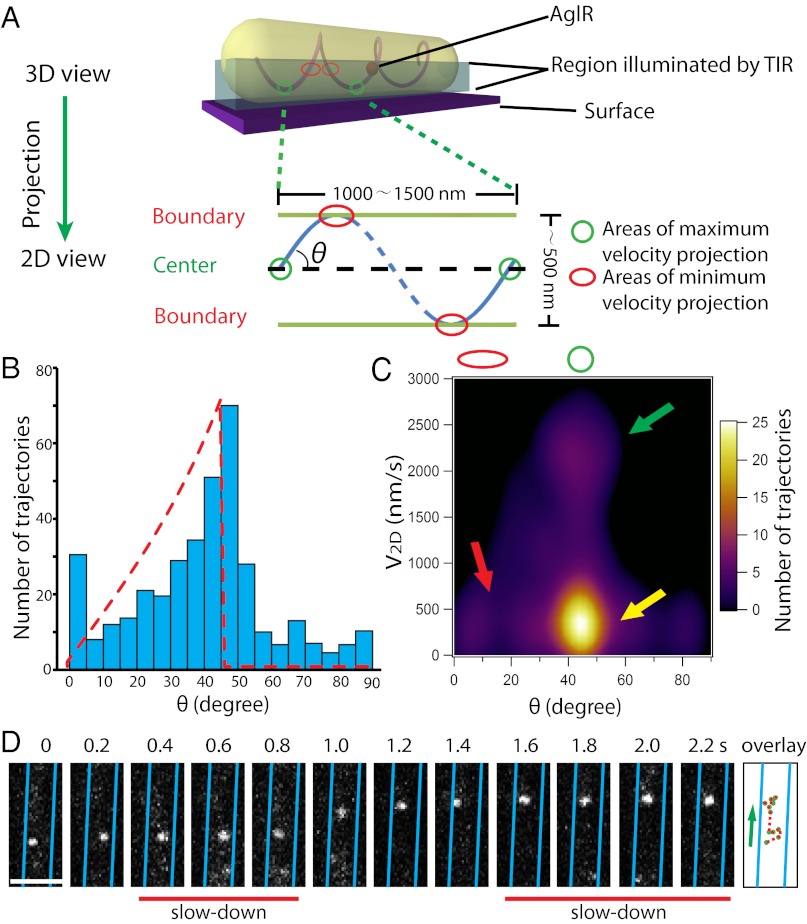
We next deduced the 3D motion of AglR from our 2D images. The maximum 2D velocity (V2D) of AglR molecules was detected near the center of the projected cell surface (Fig. 4A), which represents their de facto maximum velocity in three dimensions (V3D). In contrast, slower V2D was usually detected near the cell borders due to the geometrical projection of V3D (Fig. 4A). The maximum linear velocity we detected (V2D-max) was 2,500–3,000 nm/s. Considering the dimensions of the AglR helices, we estimate that the revolving period of AglR molecules is ∼700–1,000 ms. Indeed, we observed that some AglR molecules traversed the cell width (180°) in 500 ms (Fig. 3 A and B). However, the collective revolving period of individual AglR molecules is much longer (about 5–10 s), suggesting that individual molecules may slow down during rotation.
Fig. 4.
AglR moves in helical trajectories. (A) A mathematical model in which the 3D movement of AglR molecules is projected into 2D images. V2D-max and V2D-min are expected near the cell center (green circle) and the cell boundaries (red circle), respectively. (B) Distribution of the angles (θ) between AglR trajectories in each 100-ms period and the long axis of cells. Red dotted line shows the predicted asymmetric angle distribution. The angle distribution was derived from 397 AglR trajectories in five cells. (C) V2D-max is detected near the cell center, where θ is 45–50° (green arrow). V2D-min appears near the cell boundaries where θ is low (red arrow). However, low V2D is also detected near the cell center (yellow arrow), indicating that AglR molecules slow down at surface contact sites. (D) Single AglR molecules slow down at the center of the projected cell surface. (Scale bar, 1 µm.) Only a section of cell is shown in this figure. Images of the whole cell are shown in Movie S12.
If AglR moves in helical trajectories, in 2D images, the angle between AglR trajectories and the long axis of cells (θ) is predicted to increase from 0° at the cell boundaries to reach their peak numbers near the cell center (Fig. 4A). We generated a trajectory for each AglR molecule in every 100-ms interval (397 trajectories from five cells). The θ histogram matches well with the predicted distribution in an asymmetric pattern (Fig. 4B), consistent with helical trajectories. This unique behavior of AglR is different from the circumferential revolution of the MreB fragments in Bacillus subtilis and E. coli, where θ peaks at 90° (13, 14, 16).
AglR Molecules Slow Down at the Sites Where Cells Contact Gliding Surfaces.
We also plotted V2D of individual AglR trajectories against its corresponding θ value (Fig. 4C). V2D-max was always detected near the centers of the projected cell surfaces (θ is 45–50°), whereas lower V2D was detected near the cell boundaries (θ is 0–20°), consistent with the helical model. Interestingly, 40% of the AglR molecules slowed down near the center of the projected cell surfaces, where the ventral sides of cells were in contact with the substratum during gliding (Fig. 4 C and D; Movie S12). This observation is consistent with the helical rotor model in which the motor units slow down due to the resistance of the underlying surface. The data explain why the maximum rotation speed of individual molecules (60–85 rpm) is much higher than that of the AglR- and AgmU-decorated helices (6–12 rpm). We anticipate that the sites where AglR motors slowed down were also the sites where motors exerted force on the cell envelope (7). Due to the periodic helical conformation of the trajectories, many motor complexes likely slow down and cluster into a limited number of sites/cell. These sites appear as evenly spaced protein clusters (previously described as “focal adhesion” sites), observed with the gliding proteins AgmU, AglZ, and AglQ (5, 6, 17, 18).
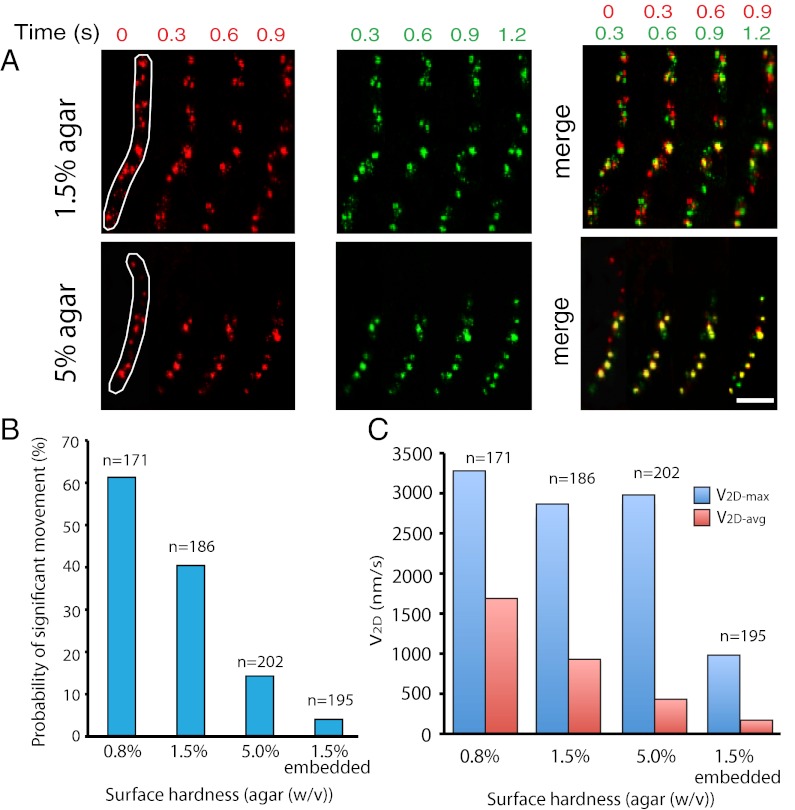
Previously, we observed that the hardness of the gliding surface impacted cluster formation of AgmU (5). The V2D-max of AglR was similar on both 1.5% and 5% (wt/vol) agar surfaces. However, on 5% (wt/vol) agar, most of the AglR molecules remained sequestered in clusters (Fig. 5A). When surface hardness was increased from 0.8 to 5% (wt/vol) agar, both the number of molecules that moved faster than 800 nm/s and their average velocity (V2D-avg) decreased dramatically (Fig. 5 B and C). The data suggest that the gliding machineries slow down more frequently as they encounter more resistance from harder surfaces. We then embedded cells in 1.5% (wt/vol) agar to allow the entire cell surface to contact the agar matrix. Under this condition, less than 5% of the AglR molecules moved faster than 800 nm/s, and the V2D-max of AglR decreased to ∼1,000 nm/s, indicating that most of the motors were retarded by frictional forces encountered at the cell surface (Fig. 5 B and C; Movie S13).
Fig. 5.
The behavior of AglR molecules is sensitive to the hardness of the gliding surfaces. (A) On 1.5% agar, most AglR molecules show displacement during 1.2 s. On 5% agar, where most motors are engaged in exerting force against the cell envelope, bigger population of AglR is observed nonmotile. The image of one frame (red, Left) is merged with a frame recorded 0.3 s later (green; Center). The motion of AglR molecules during each 0.3-s interval is shown as the color shifts in the merged images (Right). The outline of each cell is shown in the first frame. (Scale bar, 1 µm.) In a time period of 1.2 s, no cell movement was detected. (B) As the surface hardness increases or the cells are embedded in 1.5% agar, the probability of AglR moving with high velocities (>800 nm/s) decreases. (C) On 0.8%, 1.5%, and 5.0% agar, the V2D-max of AglR molecules is similar, whereas the V2D-avg decreases dramatically as the surface hardness increases. When cells are embedded in 1.5% agar, both V2D-max and average V2D decrease. These results indicate that AglR molecules slow down more frequently when they contact with harder or broader gliding surfaces.
Rotation of Motors Depends on PMF and MreB.
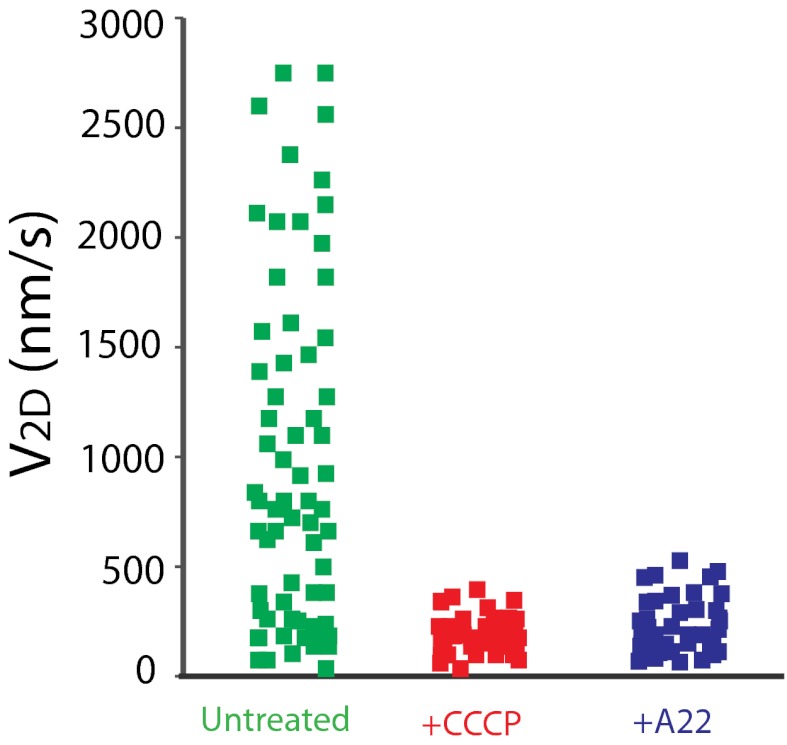
Previously, we showed that blocking PMF by cyanide-m-chlorophenylhydrazone (CCCP) or disrupting the MreB cytoskeletal filaments by A22 rapidly blocks gliding motility and the rotation of the AgmU helices (6, 7). Like AgmU, AglR stopped moving immediately when cells were treated with CCCP or A22 (Fig. 6).
Fig. 6.
AglR movement depends on proton motive force and the MreB filaments, as evidenced by 10 μM CCCP and 100 µg/mL A22 treatments. For each condition, four AglR molecules were tracked continuously at 100-ms intervals in a 1.5-s time period (60 trajectories).
Other Gliding Proteins Are Required for the Movements of Motor Complexes in Helical Trajectories.
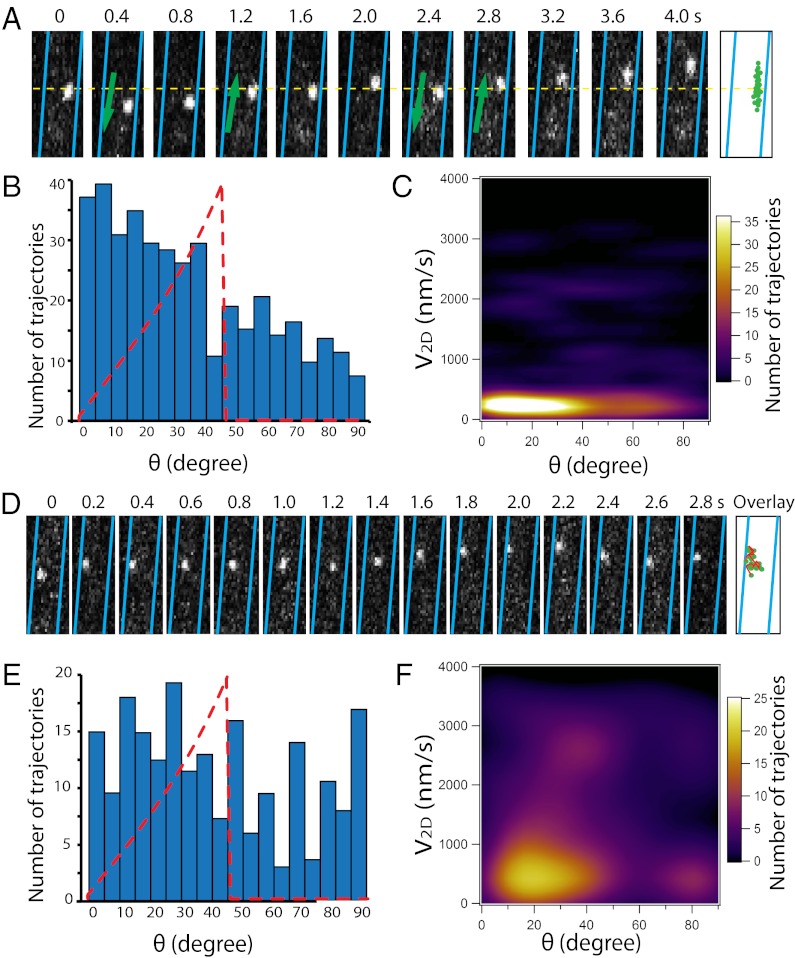
Besides the genes encoding the motor complex (aglR, aglQ, and aglS), ∼40 other genes are also required for gliding motility (19). For example, the AglRQS complex was shown to directly interact with another complex of gliding proteins including AgmU and AglZ (12). The ΔagmU and ΔaglZ mutants were unable to move by gliding, despite the existence of functional AglQRS motor complexes (5). To investigate these defects, we expressed AglR-pamCherry at low levels in the ΔagmU and ΔaglZ strains. Using photoactivation, we observed that AglR showed aberrant movements in the ΔagmU strain: 80% of AglR molecules remained stationary; those molecules that were still motile followed linear trajectories with frequent pauses and reversals but displayed the same V2D-max as WT (Fig. 7 A and B; Movie S14). V2D of motile AglR molecules showed no correlation with θ; thus, the helical motion of AglR was replaced by linear motion along the cell axes (Fig. 7C). In contrast, in the ΔaglZ strain, AglR moved faster (V2D-max > 3,500 nm/s) but lost its directionality (Fig. 7 D–F; Movie S15). The data are consistent with the regulatory function of AglZ in gliding motility (20). We propose that AgmU, AglZ and other uncharacterized components in the gliding machinery may guide the motor complexes into helical trajectories and regulate their slow-down behaviors.
Fig. 7.
Helical motility of AglR is disrupted in the ΔagmU and ΔaglZ backgrounds. (A) AglR moves in linear trajectories in the ΔagmU strain, with frequent pauses and reversals. (B) Angle distribution of AglR motility deviates significantly from that of WT (dotted lines) at θ < 30°. (C) Projected V2D of motile molecules is slow and shows no correlation with θ. (D) AglR molecules move actively along irregular trajectories in the ΔaglZ strain. (E) Angle distribution of AglR motility (n = 203) deviates significantly from that of WT (dotted lines) in the ΔaglZ strain. (F) V2D-max of AglR in the ΔaglZ strain is higher than in the WT. AglR slowed down at random positions, evidenced by the irrelevancy between V2D and θ. (Scale bars, 1 µm.) Only sections of cells are shown in this figure. The images of cells with at least one cell pole in sight are shown in Movies S14 and S15.
In this study, we provide evidence that the flagella stator complex, AglRQS, together with many motor associate proteins, moves actively within the cell membrane following helical trajectories, generating torque by accumulating in clusters that exert force on the gliding surface. In E. coli, MotA and MotB form proton channels and generate torque by the association and dissociation of protons on a critical Asp residue of MotB. The conformational changes of MotB were shown to affect the cytoplasmic domains of MotA, which drive the rotation of the flagella rotor (21, 22). In M. xanthus, complexes of AglR, AglQ and AglS serve as motors in gliding motility. The torque generated by the proton channels could enable the motor complexes to move along cytoplasmic filaments. At the same time, the motor complexes could carry protein cargos such as AgmU and AglZ, and exert force against cell envelope through these protein cargos. The bidirectional motion of motors explains why the gliding proteins move toward both cell poles (6).
Our observations are consistent with the helical rotor model (6) (Fig. 1) and redefine the previously reported focal adhesion sites as the “traffic jam” macrocomplexes formed by the slowed-down motors and their associated proteins. We propose that motor complexes exert forces at these sites by pushing against the cell envelope without breaching through the peptidoglycan layer. Although some of the motility proteins in myxobacteria are absent in other species, similar propelling mechanisms may exist in other gliding and swimming bacteria such as Flavobacterium johnsoniae and Synechococcus. In both species, rotational motion is required for linear movement (23, 24). The reinvention of novel motility systems from the reconfiguration of conserved flagella motor motifs may enable bacteria to better adapt to difficult habitats.
Materials and Methods
Strain Construction, Growth, and Phenotype Analysis.
To avoid the possible interference of the motility that is powered by type IV pili, we constructed M. xanthus strains that lack type IV pili and therefore can only move by gliding. Strain construction and growth were performed as described in ref. 5. Phenotype analyses shown in Fig. S2 were performed as described (5). Cells were photographed with a WTI charge-coupled device (CCD)-72 camera, on a Nikon Labophot-2 microscope, with 10× objective.
Cell Embedding.
To embed cells in agar, 1.5% (wt/vol) agar was melted with boiling and cooled down to ∼40 °C. M. xanthus cells expressing AglR-pamCherry as the sole source of AglR were grown in casitone yeast extract (CYE) medium, which contains 10 mM 3-(N-morpholino)propanesulfonic acid (MOPS), pH 7.6, 1% (wt/vol) Bacto casitone (BD Biosciences), 0.5% (wt/vol) Bacto yeast extract, and 4 mM MgSO4 (25) to OD600 = 1. Cells (200 μL) were harvested by 7,000 × g centrifugation for 30 s. The pellet was suspended with 20 μL 1× PBS and mixed with 800 μL 1.5% (wt/vol) agar by brief vortexing. The mixture was then dropped onto a microscope slide and covered by another slide. One slide was removed after the agar solidified, and the agar pad was covered with a coverslip.
Regular Fluorescence Microscopy.
Regular fluorescent microscopic experimentsshown in Movies S3, S4, and S5 were performed as previously described (6). For regular fluorescent and photoactivatable localization microscopy (PALM) experiments, 700 μL melted agar was dropped onto a microscope slide and covered by another slide. One slide was removed after the agar solidified, leaving the agar pad on the other slide. Cells were grown in CYE medium to OD600 = 1, and 20 μL culture was dropped onto each agar pad and covered by a coverslip.
SIM.
Cells were grown in CYE medium to OD600 = 1, harvested, and fixed with 4% (wt/vol) paraformaldehyde onto 0.1% (wt/vol) poly-L-lysine–treated coverslides, as previously described (9). For imaging, we used the Zeiss Elyra system with a 100× 1.46 NA objective, grid 4, 42 µm. Images were acquired using the Zeiss Zen software. The 561-nm laser was used; exposure time was 100 ms.
PALM.
AglR-pamCherry expression was reduced by cloning the gene behind the copper-inducible cuoA promoter (26) in the AglR+ strain. In the absence of copper, expression of AglR-pamCherry was very low but detectable; it did not cause any defects in gliding motility (Fig. S2). M. xanthus cells were grown in CYE to OD600 = 1. The iaging for single molecule tracking was done on an inverted Nikon Eclipse-Ti microscope with a 100× 1.49 NA TIRF objective, and the images were collected using an electron-multiplied CCD camera (trademarked product of Andor Ixon BV897, effected pixel size ∼78 nm). The photoactivable mCherry AglR strains were activated using a 405-nm laser and were excited and imaged using a 532-nm laser. Images were acquired at 100- or 200-ms time resolutions.
Particle Tracking and Data Analysis.
The single molecules that were observed continuously in more than 10 sequential frames were analyzed. Single molecules of AglR were tracked with the SpotTracker plugin (27) in the ImageJ software suite (http://rsb.info.nih.gov/ij/). Some obvious off-target spot recognitions were manually corrected. Cell borders and axes were defined with the MicroTracker software, as described (14, 28). Trajectory of each 100-ms step was defined as the straight-line segment connecting the center of the spot in one frame (X1, Y1) and the center of the same spot in the frame acquired 100 ms later (X2, Y2). The distance (in pixels) between any two positions (d) was generated directly by the SpotTracker plugin (27). V2D (nm/s) was calculated as V2D = d × 78/0.1. Angle θ was calculated according to the following formula: θ = |tan−1 (Yb − Ya)/(Xb − Xa) − (Y2 − Y1)/(X2 − X1)|/[1 − (Yb − Ya)/(Xb − Xa)(Y2 − Y1)/(X2 − X1)]
 , where (Xa, Ya) and (Xb, Yb) denote the coordinates of the two ends of the local cell axis. Generally, our tracking method gave high accuracy near the centers of the projected cell surfaces. However, displacements in three dimensions are projected to very short distances near the cell borders, which lower the accuracy of angle calculation at low θ values. Lower accuracy near the cell borders may explain that in Fig. 2B more trajectories with θ between 0° and 5° were observed than predicted. Another reason for this observation is that some molecules at the opposite 180° of cell surface were detected at cell borders, increasing the number of trajectories with low θ values.
Supplementary Material
Acknowledgments
We thank G. Oster for many helpful discussions, D. Schichnes and S. Ruzin for help on structured illumination microscopy; J. Muñoz-Dorado for the plasmids carrying the copper-inducible promoters; and Linda Pan, Amanda Owyoung, Kathy Guo, and Nick Taylor for technical assistance. This work was supported by National Institutes of Health Grants GM020509 (to D.R.Z.) and GM094522 (to A.Y.).
Footnotes
The authors declare no conflict of interest.
This article is a PNAS Direct Submission. M.H. is a guest editor invited by the Editorial Board.
This article contains supporting information online at www.pnas.org/lookup/suppl/doi:10.1073/pnas.1219982110/-/DCSupplemental.
References
- 1.Zusman DR, Scott AE, Yang Z, Kirby JR. Chemosensory pathways, motility and development in Myxococcus xanthus. Nat Rev Microbiol. 2007;5(11):862–872. doi: 10.1038/nrmicro1770. [DOI] [PubMed] [Google Scholar]
- 2.Lertsethtakarn P, Ottemann KM, Hendrixson DR. Motility and chemotaxis in Campylobacter and Helicobacter. Annu Rev Microbiol. 2011;65:389–410. doi: 10.1146/annurev-micro-090110-102908. [DOI] [PMC free article] [PubMed] [Google Scholar]
- 3.Nan B, Zusman DR. Uncovering the mystery of gliding motility in the myxobacteria. Annu Rev Genet. 2011;45:21–39. doi: 10.1146/annurev-genet-110410-132547. [DOI] [PMC free article] [PubMed] [Google Scholar]
- 4.Kearns DB. A field guide to bacterial swarming motility. Nat Rev Microbiol. 2010;8(9):634–644. doi: 10.1038/nrmicro2405. [DOI] [PMC free article] [PubMed] [Google Scholar]
- 5.Nan B, Mauriello EMF, Sun IH, Wong A, Zusman DR. A multi-protein complex from Myxococcus xanthus required for bacterial gliding motility. Mol Microbiol. 2010;76(6):1539–1554. doi: 10.1111/j.1365-2958.2010.07184.x. [DOI] [PMC free article] [PubMed] [Google Scholar]
- 6.Nan B, et al. Myxobacteria gliding motility requires cytoskeleton rotation powered by proton motive force. Proc Natl Acad Sci USA. 2011;108(6):2498–2503. doi: 10.1073/pnas.1018556108. [DOI] [PMC free article] [PubMed] [Google Scholar]
- 7.Sun M, Wartel M, Cascales E, Shaevitz JW, Mignot T. Motor-driven intracellular transport powers bacterial gliding motility. Proc Natl Acad Sci USA. 2011;108(18):7559–7564. doi: 10.1073/pnas.1101101108. [DOI] [PMC free article] [PubMed] [Google Scholar]
- 8.Ducret A, Valignat MP, Mouhamar F, Mignot T, Theodoly O. Wet-surface-enhanced ellipsometric contrast microscopy identifies slime as a major adhesion factor during bacterial surface motility. Proc Natl Acad Sci USA. 2012;109(25):10036–10041. doi: 10.1073/pnas.1120979109. [DOI] [PMC free article] [PubMed] [Google Scholar]
- 9.Mauriello EMF, et al. Bacterial motility complexes require the actin-like protein, MreB and the Ras homologue, MglA. EMBO J. 2010;29(2):315–326. doi: 10.1038/emboj.2009.356. [DOI] [PMC free article] [PubMed] [Google Scholar]
- 10.Fontes M, Kaiser D. Myxococcus cells respond to elastic forces in their substrate. Proc Natl Acad Sci USA. 1999;96(14):8052–8057. doi: 10.1073/pnas.96.14.8052. [DOI] [PMC free article] [PubMed] [Google Scholar]
- 11.Subach FV, et al. Photoactivatable mCherry for high-resolution two-color fluorescence microscopy. Nat Methods. 2009;6(2):153–159. doi: 10.1038/nmeth.1298. [DOI] [PMC free article] [PubMed] [Google Scholar]
- 12.Luciano J, et al. Emergence and modular evolution of a novel motility machinery in bacteria. PLoS Genet. 2011;7(9):e1002268. doi: 10.1371/journal.pgen.1002268. [DOI] [PMC free article] [PubMed] [Google Scholar]
- 13.Domínguez-Escobar J, et al. Processive movement of MreB-associated cell wall biosynthetic complexes in bacteria. Science. 2011;333(6039):225–228. doi: 10.1126/science.1203466. [DOI] [PubMed] [Google Scholar]
- 14.Garner EC, et al. Coupled, circumferential motions of the cell wall synthesis machinery and MreB filaments in B. subtilis. Science. 2011;333(6039):222–225. doi: 10.1126/science.1203285. [DOI] [PMC free article] [PubMed] [Google Scholar]
- 15.Koch MK, Hoiczyk E. Characterization of myxobacterial A-motility: Insights from microcinematographic observations. J Basic Microbiol. 2013 doi: 10.1002/jobm.201200307. in press. [DOI] [PMC free article] [PubMed] [Google Scholar]
- 16.van Teeffelen S, et al. The bacterial actin MreB rotates, and rotation depends on cell-wall assembly. Proc Natl Acad Sci USA. 2011;108(38):15822–15827. doi: 10.1073/pnas.1108999108. [DOI] [PMC free article] [PubMed] [Google Scholar]
- 17.Mignot T, Shaevitz JW, Hartzell PL, Zusman DR. Evidence that focal adhesion complexes power bacterial gliding motility. Science. 2007;315(5813):853–856. doi: 10.1126/science.1137223. [DOI] [PMC free article] [PubMed] [Google Scholar]
- 18.Kaimer C, Berleman JE, Zusman DR. Chemosensory signaling controls motility and subcellular polarity in Myxococcus xanthus. Curr Opin Microbiol. 2012;15(6):751–757. doi: 10.1016/j.mib.2012.10.005. [DOI] [PMC free article] [PubMed] [Google Scholar]
- 19.Youderian P, Burke N, White DJ, Hartzell PL. Identification of genes required for adventurous gliding motility in Myxococcus xanthus with the transposable element mariner. Mol Microbiol. 2003;49(2):555–570. doi: 10.1046/j.1365-2958.2003.03582.x. [DOI] [PubMed] [Google Scholar]
- 20.Mauriello EMF, Nan B, Zusman DR. AglZ regulates adventurous (A-) motility in Myxococcus xanthus through its interaction with the cytoplasmic receptor, FrzCD. Mol Microbiol. 2009;72(4):964–977. doi: 10.1111/j.1365-2958.2009.06697.x. [DOI] [PMC free article] [PubMed] [Google Scholar]
- 21.Kim EA, Price-Carter M, Carlquist WC, Blair DF. Membrane segment organization in the stator complex of the flagellar motor: Implications for proton flow and proton-induced conformational change. Biochemistry. 2008;47(43):11332–11339. doi: 10.1021/bi801347a. [DOI] [PMC free article] [PubMed] [Google Scholar]
- 22.Kojima S, Blair DF. Conformational change in the stator of the bacterial flagellar motor. Biochemistry. 2001;40(43):13041–13050. doi: 10.1021/bi011263o. [DOI] [PubMed] [Google Scholar]
- 23.Shrivastava A, Rhodes RG, Pochiraju S, Nakane D, McBride MJ. Flavobacterium johnsoniae RemA is a mobile cell surface lectin involved in gliding. J Bacteriol. 2012;194(14):3678–3688. doi: 10.1128/JB.00588-12. [DOI] [PMC free article] [PubMed] [Google Scholar]
- 24.Ehlers K, Oster G. On the mysterious propulsion of Synechococcus. PLoS ONE. 2012;7(5):e36081. doi: 10.1371/journal.pone.0036081. [DOI] [PMC free article] [PubMed] [Google Scholar]
- 25.Campos JM, Geisselsoder J, Zusman DR. Isolation of bacteriophage MX4, a generalized transducing phage for Myxococcus xanthus. J Mol Biol. 1978;119(2):167–178. doi: 10.1016/0022-2836(78)90431-x. [DOI] [PubMed] [Google Scholar]
- 26.Gómez-Santos N, et al. Comprehensive set of integrative plasmid vectors for copper-inducible gene expression in Myxococcus xanthus. Appl Environ Microbiol. 2012;78(8):2515–2521. doi: 10.1128/AEM.07502-11. [DOI] [PMC free article] [PubMed] [Google Scholar]
- 27.Sage D, Neumann FR, Hediger F, Gasser SM, Unser M. Automatic tracking of individual fluorescence particles: Application to the study of chromosome dynamics. IEEE Trans Image Process. 2005;14(9):1372–1383. doi: 10.1109/tip.2005.852787. [DOI] [PubMed] [Google Scholar]
- 28.Sliusarenko O, Heinritz J, Emonet T, Jacobs-Wagner C. High-throughput, subpixel precision analysis of bacterial morphogenesis and intracellular spatio-temporal dynamics. Mol Microbiol. 2011;80(3):612–627. doi: 10.1111/j.1365-2958.2011.07579.x. [DOI] [PMC free article] [PubMed] [Google Scholar]
Associated Data
This section collects any data citations, data availability statements, or supplementary materials included in this article.


