

Significance
Synaptic plasticity is considered an essential process for the formation and maintenance of memory. It had been assumed for decades that cognitive deficits within the aging brain result from reduced synaptic density and plasticity. By imaging axonal arbors and boutons in the aged brain, we surprisingly find the opposite, i.e., dramatically increased rates of synapse formation, elimination, and destabilization in specific cortical circuits. This observation suggests that learning and memory deficits in the aged brain may arise not through an inability to form new synapses but rather through decreased synaptic tenacity.
Keywords: neural circuits, ageing, structural plasticity, axon, in vivo imaging
Abstract
Aging is a major risk factor for many neurological diseases and is associated with mild cognitive decline. Previous studies suggest that aging is accompanied by reduced synapse number and synaptic plasticity in specific brain regions. However, most studies, to date, used either postmortem or ex vivo preparations and lacked key in vivo evidence. Thus, whether neuronal arbors and synaptic structures remain dynamic in the intact aged brain and whether specific synaptic deficits arise during aging remains unknown. Here we used in vivo two-photon imaging and a unique analysis method to rigorously measure and track the size and location of axonal boutons in aged mice. Unexpectedly, the aged cortex shows circuit-specific increased rates of axonal bouton formation, elimination, and destabilization. Compared with the young adult brain, large (i.e., strong) boutons show 10-fold higher rates of destabilization and 20-fold higher turnover in the aged cortex. Size fluctuations of persistent boutons, believed to encode long-term memories, also are larger in the aged brain, whereas bouton size and density are not affected. Our data uncover a striking and unexpected increase in axonal bouton dynamics in the aged cortex. The increased turnover and destabilization rates of large boutons indicate that learning and memory deficits in the aged brain arise not through an inability to form new synapses but rather through decreased synaptic tenacity. Overall our study suggests that increased synaptic structural dynamics in specific cortical circuits may be a mechanism for age-related cognitive decline.
What are the cellular mechanisms that lead to age-related cognitive decline? There is significant evidence suggesting that synaptic impairment, rather than neuronal loss, may be the leading cause of cognitive deterioration (1–3). However, the mechanisms that underlie this synaptic impairment remain poorly understood.
It is widely believed that learning deficits within the aging brain result from reduced synaptic density and plasticity (3). Most studies so far have focused on dendritic spines, the postsynaptic sites of excitatory synapses. Both the size and the number of dendritic spines are affected in pyramidal neurons of the aged (Ag) cortex and hippocampus (2–5). Interestingly, it is mainly thin spines, likely to be the main site of postsynaptic plasticity (6), that are reduced in numbers and display a larger spine head volume in cortical neurons of the Ag monkey (7) and in rat cortex (8). Much less is known about presynaptic deficits with aging. Synaptophysin (a synaptic vesicle component) labeling decreases (9), and treatments that rescue age-related cognitive decline lead to increased synaptophysin immunoreactivity and increased synaptic plasticity in the hippocampus (10). Overall these findings from different brain areas and species point to a reduction of the number, size, and plasticity of neuronal connections in the Ag brain. However, most studies to date have used either postmortem fixed tissue to study synaptic density and size or in vitro slice preparations to study synaptic plasticity. As a consequence, it is unknown whether neuronal arbors and synaptic structures continue to be dynamic in the Ag brain or whether specific deficits in synaptic structural plasticity accompany cognitive impairment.
In vivo imaging studies have shown that most synapses in the adult cortex are stable throughout the whole lifetime of the animal (i.e., are persistent), whereas only a small fraction is formed and eliminated in response to new experience (11–14, but see ref. 15) and behavioral training (13, 16). Because the size of a synapse is directly related to its strength (17–20), changes in the size of persistent synapses could play a significant role in mediating optimal cognitive function and experience-dependent plasticity alongside synapse formation, elimination, and stabilization (13, 14, 16, 21–23). However, little is known about structural changes of persistent synapses in the living brain. This knowledge is especially lacking for axonal boutons, mainly because of the lack of tools to measure their size and track their location rigorously over extended periods of time in vivo.
To resolve these issues and gain mechanistic insights into the synaptic basis of age-related cognitive decline, we have combined chronic in vivo two-photon (2P) imaging of large populations of synaptic boutons with a semiautomated algorithm that eliminates the problematic user-dependent bias in the analysis of synaptic structures (24). We find that the density and size of axonal boutons are not affected in the somatosensory cortex of cognitively impaired Ag mice. Unexpectedly, the Ag cortex shows increased rates of axonal bouton addition, elimination, and destabilization, indicating higher synaptic structural dynamics. Large boutons show 10-fold higher rates of destabilization and 20-fold higher rates of turnover in the Ag cortex than in the young adult (YA) cortex. We also show that the rate of change of bouton size is higher in the Ag brain and that persistent boutons, which are believed to encode long-term memories, are selectively targeted. Increased synaptic instability was found on layers (L) 2/3/5 and thalamocortical axons but not on L6 axons, suggesting circuit-specific effects of aging. Overall, our study identifies increased synaptic instability in defined axonal networks as a potential mechanism for age-related cognitive loss.
Results
Measuring the Size of Individual Axonal Boutons in Vivo.
To investigate whether synaptic structural plasticity is altered in the Ag brain, we imaged axons and their boutons in vivo through a cranial window. Two groups of animals were imaged at 4-day intervals over a period of 24 d: YA animals (age 4–6 mo) and Ag animals (age 22–24 mo) (Fig. 1A). In this study we considered relatively long segments (up to 2 mm per axon) of cortical axonal arbors residing in L1 and L2/3 of the somatosensory cortex (Fig. S1). We classified boutons into three categories, according to their dynamics (Fig. 1A): (i) persistent boutons that were present for all of the seven imaging sessions; (ii) nonpersistent boutons that were gained after the first session and/or lost before the last session; and (iii) destabilized boutons that were present for the first three sessions (i.e., for 8 d) and subsequently were lost before the last imaging session. Destabilized boutons also are considered nonpersistent.
Fig. 1.

Experimental outline and EPBscore software principles. (A) Schematic of the experimental design. GFP+ mice underwent cranial surgery. Two-photon in vivo imaging started 15 d after the craniotomy. Boutons were classified, according to their dynamics as either persistent (always present; solid black ovals) or nonpersistent (absent in at least one session; white or gray ovals). A subset of nonpersistent boutons was defined as destabilized (gray ovals). (B–D) EPBscore software. (B) Axons were modeled as cables filled with GFP. Plotting the maximum intensities along the cable returns an intensity profile. (C) Overlaid intensity profiles corresponding to EPBs (profile peaks) over multiple imaging sessions (represented by different colors). (D) Time-lapse series (4-d interval) showing correlation of detected EPBs identified by peak profile values. Numbers relate to the peaks in C, and colors indicate single-session profiles. (E) Nine imaged EPBs were reconstructed at the EM level revealing a high degree of correlation between the EM-calculated volume and the two-photon–measured intensity, both including (triangles, P = 0.003) and excluding (circles, P = 0.002) mitochondria from EM volume measurements. (F–H) Representative EM 3D reconstruction of an imaged EPB. (F) Two-photon image showing the EPB of interest (red arrow). (G) EM section of in vivo-imaged EPB. The red arrow indicates an EPB with a visible vesicle pool and an electron-dense active zone. The yellow arrow points to the postsynaptic spine. (H) 3D reconstruction from EM serial sections. The red arrow indicates the EPB of interest; the yellow arrow indicates the postsynaptic spine.
En passant boutons (EPBs) are the most abundant class of cortical presynaptic structures and can be identified as swellings along the axonal shaft. It has been shown that bouton size correlates with the size of the postsynaptic density and thus with synaptic strength (25). Although image analysis for terminaux boutons (TBs) is relatively straightforward and is similar to dendritic spine tracking (26), EPB analysis poses a number of challenges because their spheroid structure cannot be measured precisely in length units. To measure EPB size and changes in size in the intact brain, we used animals that express cytosolic GFP in subsets of excitatory neurons (GFP-M) (27). We then modeled the axon as a cable filled with GFP molecules (Fig. 1B), and because more GFP molecules will accumulate in larger compartments (e.g., boutons), the intensity of the signal there will be higher. Because the size of 2P-imaged synaptic structures, especially in the z plane, is below the point spread function of the microscope (25), the intensity is directly proportional to the size of the structure. We developed a semiautomated software, termed “EPBscore” (Materials and Methods) that accurately and reproducibly measures axonal bouton intensity (i.e., size) in 3D from 2P image stacks (Fig. 1 C and D). To validate our analysis method, we correlated the in vivo intensity measurements with the volume determined from EM reconstructions of the same boutons (Fig. 1 E–H). Using serial section electron microscopy (SSEM), we reconstructed a total of nine boutons that previously had been imaged in vivo. All reconstructed boutons made synapses; the smallest of these fully equipped boutons had a volume of 0.236 μm3 and a relative intensity 1.92 times the intensity of the axonal backbone (Fig. 1 F–H). For each bouton we considered the total volume and the volume excluding eventual mitochondria. Both size measurements are highly correlated with the 2P intensity measurements: R2 including mitochondria = 0.74, P = 0.003; R2 excluding mitochondria, = 0.77; P = 0.002 (Fig. 1E). These results suggest that EPBscore is a powerful tool for detecting EPBs and for measuring and tracking their size in the living brain. Using this analysis procedure, we sought to determine whether persistent synapses undergo structural changes that, in addition to synapse gain and loss, might play a role in aging-related cognitive impairment.
Cortical Axon Branches Retain Dynamic Properties in the Ag Brain.
We next investigated axonal structural dynamics in vivo. Although axonal arbors are relatively stable in the adult brain, a subset of branches elongates and retracts tens of microns over a few days (26). These changes are more prominent on TB-rich axons than on EPB-rich axons (26) and may influence the information storage capacity of the brain (28). Does the aging process affect the remodeling of axonal arbors? We find that the density and plasticity of axonal branches is comparable in Ag and YA animals (Fig. 2). We measured the average branch density and length (YA, n = 6 mice, 7 axons, 72 branches; Ag, n = 7 mice, 10 axons, 109 branches). We found no significant difference in branch density (YA: 0.014 ± 0.004 branches per micrometer; Ag: 0.018 ± 0.002 branches per micrometer; P = 0.22) (Fig. 2B) or in the average length of these protrusions (YA: 4.92 ± 0.28 μm; Ag: 5.31 ± 0.28 μm; P = 0.44) (Fig. 2C). The proportion of dynamic branches (Materials and Methods) was similar in the two groups (dynamic fraction YA: 0.48 ± 0.13; Ag: 0.45 ± 0.06; P = 0.56) (Fig. 2D), and so was the average absolute length change over 4-d intervals (YA: 3.00 ± 0.33 μm; Ag: 3.09 ± 0.33 μm; P = 0.94) (Fig. 2E). Remarkably, our data provide evidence that active elongation and retraction of axonal branches are not diminished during aging.
Fig. 2.

Axonal arbors continue to remodel in the Ag brain. (A) (Lower) Time series showing active growth of a branch (arrow) in the Ag mouse brain from postnatal day 678. (Upper) Low-magnification view of the same axon. (B) Density of axonal branches is comparable (P = 0.22) in YA (blue circles, n = 6 mice, 7 axons, 72 branches), and Ag (red circles, n = 7 mice, 10 axons, 109 branches). Black markers indicate the average values in the respective groups. (C) Average branch length per animal over six imaging sessions (20 d) is comparable in the two groups (P = 0.44). (D) Fraction of branches that display dynamic behavior is comparable in YA and Ag mice (P = 0.56). (E) Mean change in the absolute length of dynamic branches over all imaging sessions in a 4-d interval is similar in YA and Ag mice (P = 0.94).
Axonal Bouton Density Is Unaffected in the Ag Brain.
We then measured the density and the dynamic properties of cortical EPBs. GFP-expressing EPB-rich axons in the Thy1-GFP-M line originate from cell bodies lying in L2/3 and L5 of the cortex or in the thalamus (26). We find that average bouton density is comparable in Ag and YA mice [YA: 0.061 ± 0.0047 EPB per micrometer; n = 27 axons, 17.8 mm, and 1,745 distinct EPBs (1,082 at day 4); Ag: 0.056 ± 0.0034 EPB per micrometer; n = 44 axons, 28.5 mm, and 3,034 distinct EPBs (1,588 at day 4); P = 0.33] (Fig. 3 A and B). Furthermore, bouton density remains stable over a 24-d period in both groups (Fig. S2A).
Fig. 3.
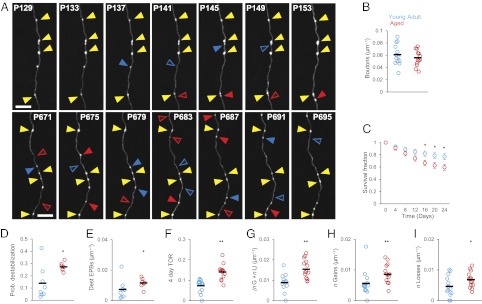
Rates of EPB replacement are higher in Ag mice than in YA mice. (A) Time series showing EPB dynamics in YA (Upper) and Ag (Lower) mice. Yellow arrowheads point to persistent EPBs; solid blue arrowheads indicate EPBs that will be lost in the next session; open blue triangles indicate EPBs present in the previous session and lost in the session shown. Solid red triangles indicate EPBs that have been gained; open red triangles indicate the location in the previous session. (Scale bars: 10 μm.) (B) EPB density is not significantly different in YA mice (blue circles, n = 13 animals) and Ag mice (red circles, n = 14 animals); P = 0.33. Black markers indicate the average values for the respective groups. (C) EPBs in the Ag brain are less stable than in the YA brain. Shown are the SFs of EPBs in YA brains (blue circles, n = 13 axons) and Ag brains (red circles, n = 15 axons); P = 2.01−06. (D) ProbDest is higher in the Ag brain (red circles, n = 7 animals and 15 axons) than in the YA brain (blue circles; n = 8 animals and 13 axons); P = 0.02. (E) The density of destabilized EPBs is higher in Ag mice (red circles) than in YA mice (blue circles); P = 0.04. (F) The EPB TOR is higher in Ag brains (red circles; n = 14 animals) than in YA brains (blue circles; n = 13 animals); P = 0.0014. Circles represent individual animals. (G) TOR density is higher in the Ag brain (red circles) than in the YA brain (blue circles); P = 0.008. (H) Gain density is higher in the Ag brain (red circles, n = 14 animals) than in the YA brain (blue circles, n = 13 animals); P = 0.0016; (I) Loss density is higher in the Ag brain (P = 0.029). Black markers indicate average values in the respective groups. *P < 0.05, **P < 0.01.
Increased Rates of Axonal Bouton Dynamics in the Ag Brain.
Synapses are formed and eliminated at higher rates during development than in adulthood. Do synaptic dynamics continue to decrease in the Ag brain? Our in vivo imaging protocol (Fig. 1A) allowed us to track the same axons (YA: n = 13; Ag: n = 15) over a period of 24 d. To study synaptic structural stability in the two groups, we calculated the survival fraction (SF), defined by the number of initial EPBs that survive at each time point divided by the initial total number of EPBs on day 0. Surprisingly, Ag mice lose EPBs more quickly than YA mice; that is, EPBs are less stable in the Ag brain. After 24 d of imaging, Ag mice retain only 59% of their initial EPBs, versus 77% for the YA group (24-d SF: YA = 77 ± 5.3%, n = 13 axons; Ag = 59 ± 4.4%, n = 15 axons; P < 0.001) (Fig. 3C). Are newly formed or relatively stable EPBs more likely to be lost in the Ag brain? We defined destabilized boutons as EPBs that were present during the first three imaging sessions (i.e., between days 0 and 8) (Figs. 1A and 3 D and E) and then were lost before the end of the imaging paradigm. The probability of synaptic destabilization (ProbDest) is higher in the Ag brain (YA: 0.14 ± 0.04; Ag: 0.27 ± 0.01; P = 0.02) (Fig. 3D), as is the density of destabilized EPBs (YA: 0.007 ± 0.002, n = 8 mice; Ag: 0.012 ± 0.001, n = 7 mice; P = 0.04) (Fig. 3E). In contrast, newly formed EPBs have similar rates of stabilization and persistence (Materials and Methods) in both age groups (Fig. S3).
Although the rate of EPB loss is higher in the Ag brain, EPB density in both groups remains stable over time (Fig. S2A). This stability suggests that higher rates of EPB replacement occur to compensate for the increased loss in the Ag animals. Indeed we found that the turnover rate (TOR) over a 4-d period is higher on axons imaged in the Ag group (YA: 0.08 ± 0.009; Ag: 0.15 ± 0.01; P = 0.0014) (Fig. 3F). When TOR is expressed as density (n gain + n loss per micrometer), TOR YA = 0.009 ± 0.001; TOR Ag = 0.015 ± 0.001; P = 0.001 (Fig. 3G). Both the density (Fig. 3 H and I) and the fraction of gains and losses (Fig. S4) are increased in the Ag animals. The TOR is stable over time in both age groups (Fig. S5). Increased TOR is likely associated with a rewiring of cortical circuits if boutons are added at one location and eliminated elsewhere along the axonal arbor (28). In contrast, repetitive EPB gains and losses could occur at the same axonal sites, perhaps implying that the same synapses undergo multiple cycles of formation and disassembly that do not necessarily lead to rewiring of the circuit. To distinguish between these possibilities, we kept track of the location of the dynamic events. EPB losses with subsequent reappearance at the same site (the reappearance fraction, calculated as the number of reappearances divided by the initial number of EPBs) were almost doubled in the Ag brain (0.47) as compared with the YA brain (0.25), suggesting that a subset of synaptic connections is structurally weaker in the Ag brain.
Large EPBs Are Most Affected in the Ag Brain.
We next sought to determine if the EPB destabilization rate is controlled by EPB size (Fig. 4 A–C). Importantly, the distribution of EPB size in YA and Ag animals is highly comparable (Fig. 5C). As expected large (i.e., strong) EPBs generally are more stable than small (i.e., weak) EPBs (see Materials and Methods for the definition of EPB size). However, although small EPBs are destabilized at comparable rates in both YA and Ag animals (YA small EPBs: ProbDest = 0.40 ± 0.08; Ag small EPBs: ProbDest = 0.57 ± 0.05; P = 0.07) (Fig. 4B), large EPBs are more than 10 times more likely to be destabilized in the Ag brain than in the YA brain (YA large EPBs: ProbDest = 0.01 ± 0.006; Ag large EPBs: ProbDest = 0.15 ± 0.03; P < 0.01) (Fig. 4C). As for the rates of destabilization, we wondered whether the TOR was the same for large and small EPBs (Fig. 4 D–F). Consistent with the destabilization results, we found that although small EPBs are lost and gained at higher rates in the Ag brain (YA small EPBs: TOR = 0.30 ± 0.03; Ag small EPBs: TOR = 0.47 ± 0.04; P = 0.004) (Fig. 4E), this effect is dramatically more prominent for large EPBs, which almost never are replaced (i.e., lost or gained) in YA (YA large EPBs: TOR = 0.001 ± 0.0006; Ag large EPBs: TOR = 0.023 ± 0.006; P < 0.001) (Fig. 4F). These data indicate that EPBs in the Ag cortex display increased plastic properties, in contrast to many reports of reduced synaptic plasticity in different regions of the aging brain (3, 8).
Fig. 4.

Large EPBs are affected more in Ag mice. (A) Representative time series showing a large bouton on an Ag axon that is stable during the first three imaging sessions (filled blue arrowhead) and subsequently is lost before the end of the series (open blue arrowhead). (B) ProbDest for small (lowest tercile in size) EPBs is not significantly different in the YA (blue circles) and Ag (red circles) groups; P = 0.07. (C) ProbDest for large (highest tercile in size) EPBs is dramatically increased in the Ag brain; P = 0.0006. (D) Consecutive time points of an imaged Ag axon showing the addition of a large EPB (filled red arrowhead). (E) TOR for small EPBs is significantly increased in the Ag brain (P = 0.004). (F) TOR for large EPBs is more than 20-fold higher in the Ag brain than in the YA brain (P = 0.0009). Black markers are average values in respective groups. (Scale bars: 5 μm.) **P < 0.01, ***P < 0.001.
Fig. 5.

Persistent EPBs size changes over days are greater in Ag mice. (A) Time series showing variation in intensity/size of single boutons in YA (Upper) and Ag (Lower) animals (Scale bars: 2 μm). (B) Relative EPB intensity expressed in backbone units is comparable in YA brains (blue circles; n = 15 animals, 1,082 EPBs) and Ag brains (red circles; n = 14 animals, 1,588 EPBs); P = 0.5. Black markers indicate average values. (C) The EPB size distribution is similar in Ag brains (red circles) and YA brains (blue circles). (D) EPB size over time on eight representative axons in Ag mice. Two axons (green lines) show correlated changes in size (P < 0.05, one-way ANOVA). (E–G) Mean absolute intensity ratio over a 4-d interval. (E) Intensity ratio averaged for all EPBs in the YA (blue bar; n = 980 EPBs) and Ag (red bar; n = 1,386 EPBs) groups; P = 0.0077. (F) Persistent EPB intensity ratio in YA (blue bar; n = 707 EPBs) and Ag (red bar; n = 872 EPBs) groups; P = 0.0047. (G) Nonpersistent EPB intensity ratio in the YA (blue bar, n = 273 EPBs) and Ag (red bar; n = 514 EPBs) groups; P = 0.467. (H) EPB intensity ratio over time for representative individual axons in the Ag brain (n = 8 axons); P > 0.05 for all; one-way ANOVA. **P < 0.01.
Persistent EPBs Have Increased Rates of Size Change in the Ag Brain.
Are changes in axonal bouton volume, which could represent variations in synaptic strength, perturbed in the Ag brain? We first studied the size (i.e., strength) of EPBs (Fig. 5). We found no difference in the average intensity (Fig. 5B, YA: 5.46 ± 0.24, n = 13 mice; Ag: 5.22 ± 0.20, n = 14 mice; P = 0.5) and a small difference in the size distribution of EPBs on Ag compared with YA axons (YA: n = 1,082; Ag: n = 1,588 EPBs from day 4) (Fig. 5C). Interestingly, the size of boutons showed a statistically significant variation over time (P < 0.05; ANOVA) for 42% of the axons in the Ag brain (Fig. 5D), in contrast to the results for dendritic spine volumes on L5 cells (22). To estimate fluctuations in the volumes of boutons that were present through consecutive sessions, we tracked bouton intensity over time using EPBscore. As a measure of change in volume over time, we used the absolute intensity ratio for each EPB between consecutive sessions (Materials and Methods and Fig. S6). Observed fluctuations in volume were much higher than the noise level (Fig. S7). Surprisingly, EPBs in the Ag cortex have larger volume changes than EPBs in the YA cortex (YA 4-d intensity ratio: 1.36 ± 0.01, 980 EPBs, 15 animals; Ag 4-d intensity ratio: 1.42 ± 0.01, n = 1386 EPBs, 14 animals; P = 0.008) (Fig. 5E). We then distinguished between persistent boutons [mean persistent EPB intensity (backbone units): Ag = 6.4 ± 0.26; YA = 5.99 ± 0.28; P = 0.28] and nonpersistent ones [mean nonpersistent EPB intensity (backbone units): Ag = 3.6 ± 0.1; YA = 3.4 ± 0.07; P = 0.1) (Fig. 1A)] to determine whether both populations contribute to the increased intensity ratio. Persistent, highly stable synapses are thought to encode long-term memories, but it is not known whether they undergo morphological changes associated with cognitive impairment in vivo (6). Interestingly, we found that the increased intensity ratio in the Ag cortex is restricted to the persistent population (YA: 1.35 ± 0.01, Ag: 1.43 ± 0.01; P = 0.005) (Fig. 5F), whereas the change in size in the nonpersistent EPB population is similar in the two age groups (YA: 1.38 ± 0.02; Ag: 1.40 ± 0.02; P = 0.467) (Fig. 5G). Our measurements of the fluctuations in the volume of axonal boutons in the intact living brain show that such dynamic behavior is increased in the persistent boutons in the Ag brain.
Large Boutons in the Ag Brain Form Structurally Normal Synapses.
As a proof of principle we reconstructed with EM two large boutons previously imaged in the intact Ag cortex, to gain ultra structural and circuit level information (Fig. 6). We fixed the tissue shortly after the last imaging session for subsequent focused ion beam scanning electron microscopy (FIBSEM) (Fig. 6B). The 3D reconstruction of this small region (Fig. 6C) allowed us to determine that both persistent boutons formed multiple synaptic contacts with dendritic spines and contained synaptic vesicles and mitochondria (Fig. 6B–C). Thus, despite their increased dynamics, large boutons retain the ability to form synapses that are structurally normal in the Ag brain.
Fig. 6.

Large boutons in the aged brain form synapses. (A) In vivo 2P imaging of two large persistent boutons. (Scale bar: 5 μm.) (B) Both boutons make multiple synaptic contacts, as visible in a single plane of the correspondent EM images, with multiple dendritic spines. (Scale bar: 500 nm.) (C) 3D rendering of the same axon in A. The cytoplasm of the axon is represented in light blue, mitochondria in green, synaptic vesicles in yellow and synapses in red. The postsynaptic spiny neurons are shown in grey. Bouton 1 has a total volume of 2.03 μm3, bouton 2 of 2.35 μm3; excluding the space occupied by mitochondria the volumes are 1.61 and 1.78 μm3, respectively.
Relationship Between Changes in EPB Size and Formation/Elimination.
How are heightened EPB TOR, destabilization, and rates of size change regulated at the individual axon level? To answer these questions, we correlated the EPB TOR, ProbDest, and intensity ratio for 15 axons imaged for 24 d in the Ag brain. We did not find a statistically significant correlation between any of the three parameters (e.g., TOR versus intensity ratio, R = 0.44, P = 0.1; correlation matrix) (Fig. S8). However, when we considered a larger data set with all axons (n = 44) for which we had both intensity ratio and TOR measurements over a shorter time (8-d) window, there was a weak but highly significant correlation between TOR and intensity ratio (R = 0.41; P = 0.003; Pearson’s linear correlation), suggesting that increased rates of EPB replacement and changes in size may be partially related processes occurring on the same neurons. Interestingly, we also found that both the TOR (Fig. S5) and the mean change in EPB size are stable over time on individual axons in the Ag brain (P > 0.05; ANOVA) (Fig. 5H). Taken together, these data show that although the density and size of a large population of axonal boutons in L1 of the somatosensory cortex are not affected by the aging process, their structural dynamics are strikingly enhanced.
Aging Targets Specific Presynaptic Elements.
Is the increased plasticity of EPBs a general deregulation of synaptic networks, or is it specific to subsets of presynaptic elements and circuits? To answer this question, we examined the dynamics of TBs, which are the second major class of presynaptic structures in the cortex. TB-rich axons are characterized by high levels of synaptic gain and loss in YA animals (26). Similar to EPBs, TB densities were not significantly different between groups (YA: 0.17 ± 0.02 TB per micrometer; n = 6 mice, 7 axons, 4.2 mm, 692 TBs; Ag: 0.14 ± 0.01 TB per micrometer, n = 7 mice, 10 axons, 5.1 mm, 720 TBs; P = 0.58) (Fig. 7 A and B and Fig. S2B), suggesting that the regulation of the number of cortical axonal boutons is unaffected by the aging process. However, contrary to our results for EPBs, the SF curves for TBs are indistinguishable in YA and Ag animals (20-d SF YA: 60.6 ± 6%; 20-d SF Ag: 62 ± 3%, P = 0.66) (Fig. 7C). The probability that TBs present for the first 8 d will be lost (destabilized TBs) is not significantly different in Ag and YA mice (ProbDest YA: 0.28 ± 0.04; Ag: 0.22 ± 0.02; P = 0.23) (Fig. 7D). Finally, 4-d TOR rates also are similar in the two groups (YA: 0.13 ± 0.01; Ag: 0.125 ± 0.01; P = 0.36) (Fig. 7E), as are the fraction of gains and losses (Fig. 7 F and G). Thus, aging targets specific presynaptic elements and, presumably, circuits.
Fig. 7.
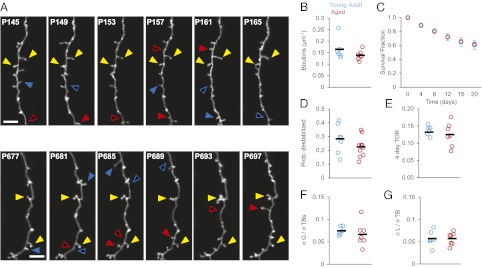
TB-rich axons have comparable dynamics in Ag (n = 6) and YA (n = 7) mice. (A) Time series showing TB dynamics in YA (Upper) and Ag (Lower) mice. Yellow triangles indicate persistent TBs; solid blue triangles indicate TBs that will be lost in the next session; open blue triangles indicate TBs that have been lost; solid red triangles indicate TBs that have been gained since the previous session; open red triangles indicate the location in the previous session. (Scale bars: 10 μm.) (B) Mean TB density is comparable in YA animals (blue circles) and Ag animals (red circles). P = 0.58. Black markers indicate respective means across mice. (C) SF is comparable in YA mice (blue circles; n = 7 animals, 692 TBs) and Ag mice (red circles; n = 10 animals, 720 TBs); P = 0.66. (D) ProbDest is comparable in YA (blue circles; n = 7 axons) and Ag (red circles; n = 10 axons) animals; P = 0.23). (E) TOR is comparable in YA animals (blue circles) and Ag animals (red circles); P = 0.36. (F) Fractions of TB gains are comparable in Ag mice (red circles) and YA mice (blue circles); P = 0.37. (G) Fractions of TB losses are comparable in Ag mice (red circles) and YA mice (blue circles); P = 0.63. Black markers indicate the mean values across animals in the respective groups.
Ag Mice Are Impaired in a Tactile Version of the Object-Recognition Task.
So far we have shown that the aging process specifically affects EPB dynamics in somatosensory cortex by increasing their structural plasticity. Arguably, aging should have a negative impact on brain structure and function, but increased plasticity often has been linked to increased behavioral performance. To rule out the possibility that aging in our mouse lines leads to improved cognitive performance, we tested their formation of tactile recognition memories. To do so, we used a tactile version of the object-recognition task. Rodents’ natural preference for exploring novel objects can be used to test their recognition memory. Animals performed the test in dark conditions and thus were forced to explore exclusively with their whiskers and paws (Fig. 8A; for details see Materials and Methods). The familiar and novel objects differed only in texture (i.e., rough or smooth). The test trial, in which novel and familiar objects were presented, took place 24 h after the sample periods, in which only familiar objects were presented. We first confirmed that animals rely on whisker function when performing the task. Indeed, YA mice with all their whiskers trimmed were unable to distinguish between the familiar and the novel object (Fig. S9). As expected, we then found that the Ag group is impaired in this behavioral task. YA animals (n = 13) interact longer with the novel object than with the familiar object, as confirmed by two-way ANOVA (novel object: 5.4 ± 0.99 s; familiar object: 3.2 ± 0.62 s; interaction P = 0.043) (Fig. 8B). In contrast, Ag animals (n = 13) failed to recognize the familiar object and spent an equal amount of time exploring the novel object (mean novel object exploration time: 3.44 ± 0.73 s; mean familiar object exploration time: 3.29 ± 0.67 s; P = 0.93; two-way ANOVA) (Fig. 8C). A significant difference between the two age groups is evident by calculating the discrimination index (DI): DI = [(novel exploration time/total exploration time) − (familiar exploration time/total exploration time)] × 100, which accounts only for differences in exploration time in the test trial (YA DI: 29.78 ± 5.5; Ag DI: 3.99 ± 6.39; P = 0.005; unpaired t test) (Fig. 8D). Total time spent exploring the objects is comparable in the two groups, and both groups show adaptation during the sample trials (Fig. 8 B and C), suggesting that Ag mice also may remember the object for short periods of time. Indeed, Ag mice perform well in this task when the latency time between sample and test trials is reduced to 1 h (Fig. S9). Overall, these results suggest that Ag mice have difficulty forming long-term recognition memory.
Fig. 8.

Ag mice have impaired long-term recognition memory. (A) Tactile version of the object-recognition task. In three sample trials (S1, S2, and S3) two identical objects are placed in the apparatus. The test trial takes place 24 h later with a novel object. (B and C) Time spent exploring the familiar (gray bar) and novel (black bar) objects in all trials by (B) YA mice (n = 13, test mean familiar object exploration = 3.2 ± 0.62 s; novel object exploration = 5.4 ± 0.99 s; P = 0.043, two-way ANOVA) and (C) Ag mice (n = 13, test mean familiar object exploration = 2.9 ± 0.76 s; novel object exploration = 3.2 ± 0.85 s; P = 0.93; two-way ANOVA). Both Ag and YA mice show adaptation and tend to explore the objects less. (D) DI for YA mice (blue bar; DI = 29.78 ± 5.5) and Ag mice (red bar; DI = 3.99 ± 6.39); P = 0.005; unpaired t test. *P < 0.05, **P < 0.01.
Discussion
By combining in situ imaging of axonal networks with a rigorous method to quantify and track the size and location of large populations of synaptic boutons and behavioral assessment of cognitive function, we find a surprising circuit-specific increase in structural bouton dynamics in the Ag cortex. We show not only that the rates of addition and elimination of EPBs are higher but also that EPBs are destabilized in the Ag brain more often than in the YA brain. Compared with the YA stage, large EPBs in the Ag brain are over 20 times more likely to be lost or gained. Moreover, by measuring the volume of individual axonal boutons over periods of several weeks in vivo, we show that persistent EPBs undergo higher rates of structural remodeling in the Ag cortex. These unexpected alterations of synaptic structural plasticity are associated with age-related cognitive impairment.
Computer-Assisted Analysis of Axonal Structure and Dynamics.
The process of data analysis to extract key structural features of neuronal arbors, such as the number, location, and size of neuronal connections, so that these features can be tracked over time, is a major bottleneck in performing large-scale studies. Accurate, unbiased, and quantitative tracking of large populations of synaptic sites remains a challenge (29). This task is especially complex for axons and their boutons (30). Indeed, current methods of identifying and tracking axonal boutons are still largely manual (30) and so are prone to be user dependent and nonrigorous. For example, given the same data set, subtle variations in the analysis criteria for the manual annotations of dendritic spines can lead to an almost twofold difference in the estimate of spine turnover (24), and such differences likely contribute to the controversy about the degree of spine structural changes in the adult brain (31, 32). To overcome these limitations, we developed a semiautomated reconstruction program, the EPBscore (Fig. 1 B–D). Given a fixed set of thresholds, EPBscore automatically tracks EPBs and their intensities (i.e., sizes) from 2P image stacks. This process is accurate and reproducible (Materials and Methods). We have validated this approach in a number of ways: (i) SSEM shows that all (nine of nine) EPBs identified by EPBscore make synaptic contacts (Fig. 1 E–H); (ii) in vivo measurements of EPBscore volumes correlate with EM volumes of the same boutons (Fig. 1E); (iii) repeated imaging over days in the fixed brain shows that noise in the EPBscore measurement is well below the changes measured over days in living animals (Fig. S7); (iv) the analysis of the same data set by three different users with EPBscore yields comparable results. We believe the rigorous assessment of axonal boutons with EPBscore will be a useful step toward a more standardized description of synaptic structural plasticity both in vitro and in vivo.
Increased Rates of Axonal Bouton Replacement and Cognitive Impairment.
On-going synaptic structural plasticity in the adult brain, including large-scale growth/retraction, formation/elimination, and shrinkage/enlargement, plays a key role in the encoding of long-term memory and in the functional adjustments to novel sensory experience (33, 34). Many studies using fixed preparation have shown changes in the size of axonal and dendritic arbors and in the size and numbers of their synapses with age (e.g., ref. 35, but also see ref. 36). We find that the cognitive abilities to discriminate and remember different textures are impaired in Ag animals in the tactile novel object-recognition test (Fig. 8 and Fig. S9). Because synaptic structural plasticity generally is associated with increased memory storage capacity (28, 33), we had hypothesized that reduced axonal bouton density and size and/or a decrease in the plastic properties of presynaptic elements could contribute to aging-related cognitive decline. By imaging in vivo, we were able to determine such dynamics in the intact mouse brain and to identify specific differences in synaptic structural dynamics even if the net density (Figs. 2B, 3B, and 7B and Fig. S2) and size (Fig. 5 B and C) of this subset of cortical boutons were not affected by aging. A general belief is that synaptic plasticity correlates positively with cognitive performance (10, 37, 38). We find that the destabilization and TOR of EPBs are elevated in the brain of cognitively impaired Ag animals (Figs. 3, 4, and 8), suggesting a deleterious effect of augmented dynamics and instability. Finely tuned synapse formation and elimination are important for encoding new memories and motor skills (13, 16). Random appearance of boutons and selective stabilization in response to new experience could represent an efficient strategy for memory consolidation. It is possible that the increased rate of EPB replacement we detect in the Ag brain (Figs. 3 F–I and 4 E–F) leads to a dysfunction of neural circuits, preventing normal neuronal processing and memory formation. This effect would indicate that synapse formation and elimination rates need to be regulated accurately to allow efficient memory formation and storage. Increased destabilization of successfully formed synapses may lead to the erasure of successfully formed memories. In addition, although small EPBs display high dynamic rates in both age groups, large EPBs are more affected in the Ag brain (Fig. 4). In the YA brain large EPBs are remarkably stable, with minimal destabilization and TOR. In contrast, in the Ag brain large EPBs display 20-fold higher destabilization rates (Fig. 4C) and 10-fold higher TOR (Fig. 4F). Presumably, some of these preexisting large EPBs are active sites of release but are more vulnerable and are wrongly selected for elimination (39).
Increased Rates of Change in Axonal Bouton Size and Cognitive Impairment.
Stabilization of newly formed dendritic spines in response to potentiation, novel experience, or learning is associated with a small increase in the average volume of the spine head both in vitro (39) and in vivo (40). Current research on the mechanisms of learning and memory has highlighted the importance of such stabilization of new spines together with concomitant elimination of previously existing ones. Much less is known about the contribution of persistent synapses, which are thought to survive throughout the lifetime of an animal. The increased fluctuations in the volume of persistent boutons that we report in the aging brain (Fig. 5) could mask significant experience-dependent and learning-induced synapse strengthening. A sizeable proportion of axons in both the Ag (42%) (Fig. 5D) and the YA (58%) brain show correlated changes in the size of their EPBs, in contrast to findings of independent changes in the size of spines on L5 cells (22). Correlated bouton size changes might arise because boutons form contacts with postsynaptic cells displaying similar tuning properties (e.g., in the same cortical column), whereas spines along a dendrite likely make synapses with axons exhibiting different firing patterns.
At the same time, fluctuations in EPB size could decrease the reliability of synaptic transmission (20), degrading the saliency of output signals. Long-term rather than short-term changes in synaptic weight may be at the basis of memory encoding (41). Indeed changes in the volume of spine heads have been measured successfully in vivo both in normal (22) and altered (14, 23, 40) sensory-experience paradigms and can correlate with functional changes. We find that even over extensive periods of time EPBs undergo substantial volume fluctuations (Ag 4-d intensity ratio: 42%; range, 0–618%; YA 4-d intensity ratio, 36%; range, 0–383%) comparable to those in dendritic spines in vivo (14, 22) and in vitro (42). Spatial and temporal coordination of the fluctuation in EPB volume may drive significant alterations in network function. Thus, structural changes in persistent synapses, in addition to synapse replacement, may be involved in long-term memory. The increased change in average volume we report (Fig. 5 E and F) also could help explain why the induction (43) and maintenance (44) of long-term potentiation are impaired in Ag rats and mice (45). We anticipate that increased axonal bouton instability occurs in other brain areas whose function is affected during aging or disease. Taken together, these alterations in synaptic dynamics may lead to a disruption in the precise spatiotemporal activation of specific circuits (39).
Mechanisms for Heightened Axonal Bouton Plasticity in the Ag Brain.
Aging affects different neuronal subsets and presynaptic elements differently. EPBs on L2/3/5 and thalamocortical axons are targeted selectively (Figs. 3–5), whereas L6 TB dynamics (Fig. 7) and large-scale structural remodeling of axonal arbors (Fig. 2) are not affected by the aging process. This selectivity is consistent with previous findings of layer-specific [olfactory bulb (46)] or neuron-specific [retina (35)] effects of aging. We speculate that these effects might be controlled by synaptic activity, because large (i.e., strong) EPBs might “wear out” with age to a greater extent than smaller (i.e., weaker) TBs. Circuit-specific defects in calcium buffer capacity in the Ag brain (3) may lead to increases in calcium levels, which in turn may lead to increased axonal bouton instability. In parallel, progressive hypofunctionality of inhibitory networks (47) could disrupt the balance between excitation and inhibition, leading to hyperexcitability and uncontrolled EPB plasticity in excitatory circuits (3, 48).
Previous in vitro work has shown that presynaptic bouton volumes (but not spine volumes) are highly affected by the presence or absence of their synaptic partner (49), suggesting that dendritic spines also may undergo higher structural remodeling in the Ag brain. Furthermore, because the size of the active zone correlates with the reliability of synaptic transmission (20), and synaptic vesicles are exchanged at high rates between neighboring EPBs along the axon in an activity-dependent manner (50), it is plausible that a combination of the aforementioned mechanisms could contribute to the increased rate of fluctuations in the size of Ag cortical EPBs (Fig. 5).
In the future it will be interesting to discover the molecular mechanisms that lead to the circuit-specific increases in synaptic structural dynamics that we report here. This knowledge may lead to strategies to counteract the degraded cognitive functions and noisy processing which accompany aging (51).
Materials and Methods
Animals.
Male animals of two age groups with the same genetic background (C57BL/6) were used: YA (4–6 mo) and Ag (22–24 mo). These groups comprised two lines of GFP-expressing animals: (i) Thy1-GFP-M (27) (cytosolic GFP expression) (YA group: n = 15, 8 for the entire 24-d period; Ag group: n = 14, 7 for the entire 24-d period) to track EPBs and an initial subset of TBs, and (ii) Thy1-GFP-L15 (52) (membrane-bound GFP expression) (YA group: n = 6; Ag group: n = 7, imaged for 20 d), which enables more efficient tracking of TBs (26). Mice were housed in groups of two to four littermates, in standard individually ventilated cages, and were maintained in a 12-h light-dark cycle with access to food and water ad libitum. A long-term maintenance diet (R05-10; Scientific Animal Food and Engineering) was used to limit obesity in both age groups. All experiments were conducted by researchers holding a UK project license and in accordance with the Animals (Scientific Procedures) Act 1986 (United Kingdom) and associated guidelines.
Surgery.
Cranial windows were surgically implanted overlying the barrel cortex according to previously described methods (24). Briefly mice were anesthetized with a ketamine-xylazine i.p. injection (0.083 mg/g ketamine, 0.0078 mg/g xylazine). The animals then were administered i.m. dexamethasone (0.02 mL at 4 mg/mL) to limit inflammation response and s.c. bupivacaine (1 mg/kg), a local anesthetic. Once the skull was exposed, a few drops of lidocaine [1% (wt/vol) solution] were applied on its surface. The glass coverslip that seals the window was placed directly over the dura and the bone edges, with no agarose in between, and was sealed with dental cement. Mice were allowed to recover for 15 d before the start of the imaging protocol.
In Vivo Imaging.
A Prairie 2P microscope equipped with a tunable Coherent Ti:Sapphire laser and PrairieView acquisition software was used for in vivo imaging experiments as described in ref. 26. Mice were anesthetized with an i.p. injection of ketamine-xylazine (0.083 mg/g ketamine, 0.0078 mg/g xylazine) and were secured to a fixed support under the microscope. The eyes were coated with Lacri-Lube (Allergan) to prevent dehydration, and an underlying heat pad was used to maintain body temperature (37 °C). Depth of anesthesia was monitored closely. An Olympus 4× lens with a 0.13 numerical aperture (NA) was used to identify characteristic blood vessel patterns and to relocate previously imaged areas of the cortical neuropil reliably. An Olympus 40× 0.80 NA water-immersion objective was used to acquire the images (75.3 × 75.3 μm field of view, 512 × 512 pixels). A pulsed 910-nm laser beam was used, never exceeding 70 mW on the back focal plane. Each imaging session typically lasted for 60 min, during which time up to 40 image stacks (1-μm step size) were collected. Axons were followed as long as the image quality and the density of GFP processes allowed; areas devoid of boutons were included in imaging to avoid sampling biases.
Several lines of evidence suggest that the effects of age on synaptic dynamics that we show in this study are not caused by the craniotomy or phototoxicity as a result of our imaging conditions. (i) The rate of synapse formation and elimination does not increase with subsequent imaging sessions postsurgery (i.e., is constant over time) (Fig. S5). (ii) The rate of change in size is constant on individual axons over time in the Ag brain (Fig. 5H). (iii) Other morphological parameters, such as the density (Fig. S2) and size (Fig. 5D) of cortical boutons, also are mostly constant over time. (iv) Axonal arbors continue to remodel at the same rate as in YA (Fig. 2). (v) We find increased dynamics of EPBs (Figs. 3 and 4) but not of TBs (Fig. 7) which one would not expect if our surgery or imaging conditions caused synaptic structural changes in cortical circuitry. (vi) Finally, reactive astrocytes, whose number increases transiently after cranial window surgery (24) and correlates with structural changes of spines (53), are not up-regulated in the operated Ag brain as compared with the YA brain at the time of 2P imaging (25–35 d postsurgery) (Fig. S10).
Behavior.
The tactile novel object-recognition task used was based on the standard visual novel object-recognition task as described in ref. 54. It is known that rodents can learn to discriminate different textures using their vibrissae. The experiments were carried out in a 35 × 45 × 40 cm open-field (OF) apparatus with opaque walls. Two categories of objects with the same shape and color were used, differing only by surface kind: rough or smooth. The objects were custom made using 60-mL sample cylinders covered with either rough (coarse P80) or smooth (super-fine P1000) sandpaper. Animals were allowed to acclimatize for at least 1 h before the start of the protocol. On day 1 the animals were placed individually in the OF for a 5-min familiarization trial with no objects. Subsequently, they underwent three sample trials, each lasting 6 min, with two identical objects in the OF. All trials were separated by a 3-min intertrial period. Twenty-four hours later the animals underwent the test trial (6 min) with two new objects: a familiar object identical to the sample objects and a novel object. To reduce bias, the rough and smooth objects were used equally and alternately as the novel or familiar object. A group of YA mice had all whiskers trimmed bilaterally to the skin on day 1 (Fig. S9). In the 1-h latency version, Ag animals were tested 1 h after the sample trials had ended. Animals were tracked using an infrared CCD camera above the OF and with the aid of AnyMaze software. Exploration time was scored counting only the time that the mouse’s nose was in contact with the object and not considering the time when the animal had its paws on the object or when it climbed on the object. All trials were conducted in the dark to avoid visual recognition. The DI was calculated as DI = [(novel exploration time/total exploration time) − (familiar exploration time/total exploration time)] × 100.
SSEM and FIBSEM.
SSEM was performed as in ref. 26. We reconstructed nine EPBs, which had been imaged previously in vivo using the same imaging conditions. 3D reconstructions of axon segments and boutons were made from electron micrographs using TrakEM2, an ImageJ plugin for morphological data mining and 3D modeling. Elements of interest—axons, boutons, mitochondria, and spines contacting labeled boutons—were segmented on each section, and the volumes of each bouton and corresponding mitochondria were calculated. The volumes of each bouton, measured with TrakEM2 (in cubic micromillimeters) and with EPBscore (in backbone units), were calculated and plotted against each other including and excluding the volume of mitochondria (Fig. 1E). The 3D structure of the reconstructed axon and boutons (Fig. 1H) was created with Blender software (www.blender.org). In a different set of experiments, we confirmed that synaptic boutons in the Ag cortex have normal ultrastructure. For the reconstruction in Fig. 6 the FIBSEM technique was used (55). Briefly: the mouse was perfused immediately after in vivo imaging with a 2.5% (vol/vol) glutaraldehyde and 2% (wt/vol) paraformaldehyde in PBS. 60 μm thick slices were obtained containing the in vivo imaged boutons. The region of interest was branded using line scans, as described previously (56). The laser marks were then used as fiducial points to locate the boutons for imaging in the FIBSEM (NVision 40 FIBSEM, Zeiss NTS). The final image series was analysed in the Fiji software package (http://fiji.sc/wiki/index.php/Fiji). Labeled axons were manually segmented using the TrakEM2 program (Fiji software package). The reconstructed model was rendered in the Blender software (version 2.57; Blender Foundation, http://www.blender.org).
Immunohistochemistry.
YA and Ag animals with a cranial window were transcardially perfused with a 4% PFA solution between 25 and 35 d postsurgery. Fixed brains were processed for immunohistochemistry using standard protocols. Briefly, brains were immersed in 30% (wt/vol) sucrose in PBS overnight. Then 20-μm frozen coronal sections were cut and mounted on glass slides. The sections were washed three times for 5 min each washing in PBS and were incubated overnight at 21 °C with the primary antibody solution (Triton-X 0.1% and Azide 0.01% in PBS). Sections then were washed three times for 5 min each in PBS and were incubated for 2 h in the dark with the secondary antibody solution (Triton-X 0.1% and Azide 0.01% in PBS). Sections were washed three times for 5 min in PBS and were mounted with Vectashield and DAPI. The primary antibody was rabbit anti-GFAP (1:1,000) (DakoCytomation); the secondary antibody was cy3.5 anti-rabbit (1:500) (Genetex). Images (1,024 × 1,024 pixels) were acquired with a confocal SP5 (Leica) using a 20× lens at zoom factor 2. DAPI-identified nuclei that colocalized with the GFAP signal were counted as astrocytes and were quantified with CellProfiler (the Broad Institute, www.cellprofiler.org).
Data Analysis and Statistics.
In vivo 2P images were processed routinely using custom-made software in MATLAB (Mathworks). TB-rich axons were traced manually and correlated between sessions using the spine analysis software as in ref. 24. EPB-rich axons were analyzed using EPBscore.
Briefly, 16-bit images are median filtered and saved. The resulting image is segmented with an adjustable threshold. Processes are traced in 3D, and an axon intensity profile is generated. The median intensity value of all pixels along the axon profile is set as the axonal backbone estimation. Peaks in the axon profile are scored as boutons and measured as backbone units of intensity. Fiducial points are chosen by the operator to align regions of interest over successive sessions to correlate boutons over time. The output is given in a Microsoft Excel format for further analysis. Axon length was confirmed using the NeuronJ plugin for ImageJ. Figures were prepared using Microsoft Office Suite and Adobe Illustrator.
To study synaptic rearrangements in vivo in the Ag brain, we focused on two populations of axonal boutons in L1–3 of the somatosensory cortex: (i) EPBs, which mainly form axospinous synapses and are relatively stable in the adult brain (26), and (ii) TBs, which form both axospinous and axodendritic synapses (57) and are known to be highly dynamic in the adult brain (26). Destabilization was measured by calculating the probability of destabilization (ProbDest = total number boutons present between days 0–8 and then lost divided by the total number present between days 0–8). Stabilization was calculated as the number of newly formed EPBs in the first 16 d of imaging that were present until the end of imaging (24 d), divided by the total number of EPBs newly formed in the first 16 d. Persistence was calculated as the number of newly formed EPBs that persist for at least 8 d after their appearance, divided by the total number of newly formed boutons. TOR between two imaging sessions, a and b, is defined as (nG + nL)/2N, where nG and nL are the numbers of bouton gains and losses respectively, and N is the total number of boutons in session a.
EPBs were analyzed with EPBscore. To be included in the analysis, EPBs had to be at least two times brighter than the backbone in at least one session, based on SSEM reconstruction which showed that the smallest EPB that formed a structurally complete synapse was 1.92 times backbone intensity. EPBs had to be present in at least two consecutive imaging sessions at any point during 24 d to be included in the analysis. Using less conservative criteria, which may lead to an overestimation of axonal bouton dynamics, we find a similar difference in the fraction of EPB gain and loss between YA and Ag brains (Fig. S4). The same was true for other measurements of axonal bouton dynamics, suggesting that our conclusions are independent of EPB scoring criteria. The intensity values over time were exported to Excel (Microsoft) and were postprocessed using MATLAB scripts.
We computed the intensity ratio over consecutive sessions as a measure of volume change (Fig. S6). The absolute intensity ratio was calculated as exp[abs(loga-logb)] (i.e., always the largest intensity value divided by the lowest, regardless of temporal sequence), where log is the natural logarithm of intensity a and b, which are the values of normalized intensity in consecutive sessions. If a = b, then the intensity ratio = 1. We assessed the noise level of this estimate of volume change by imaging EPBs in the brains fixed with 4% paraformaldehyde over a 4-d period and using the same analysis criteria used for the in vivo experiments (Fig. S7). We defined EPBs as “small” or “large” (Fig. 4 B–F) if their relative size fell in the bottom third or top third of the size distribution, respectively. Values for YA were 2.0–3.6 times backbone for small EPBs and >5.9 times backbone for large EPBs; values for Ag were 2.0–3.2 times backbone for small EPBs and >5.4 times backbone for large EPBs. The results in Fig. 4 did not change when the same size criterion was used for both age groups (i.e., large EPB size >5.6 times backbone). For large EPBs: YA TOR = 0.0017 ± 0.001, Ag TOR = 0.022 ± 0.005; P = 0.0002; YA ProbDest = 0.02 ± 0.05, Ag ProbDest = 0.17 ± 0.05; P = 0.003.
TBs (1–5 microns) were annotated and scored as stable, lost, or gained according to stringent criteria based on refs. 24 and 26). TBs had to be longer than 1 μm in at least one imaging session. Conversions from TB to EPB were not scored as gains or losses.
Branches (side protrusions >5 μm) were considered dynamic if they met one of two previously published criteria based on estimation of noise level (26):
i) The largest elongation or retraction event was two times greater than the largest change in the noise measurement (2 * 3 μm = 6 μm).
ii) The average absolute length change was larger than three times the rms (σx) of the mean displacement (x) of two fiducial points (3 * σx = 1.6 μm).
All statistical analysis was performed either in the MATLAB suite or Microsoft Excel. For the behavior, a two-way ANOVA analysis was used within groups (YA or Ag), and a two-tail unpaired t test was used between groups. All branch and bouton measurements were tested using the Wilcoxon rank sum test for nonparametric data except for bouton survival curves, for which a log rank test was used. Stability over time was tested with ANOVA. A correlation matrix was used to correlate variables in Fig. S8 (TOR, intensity ratio, ProbDest). Pearson’s correlation was used for comparing TOR and intensity ratio on a larger dataset of 44 axons imaged for 8 d (Fig. S8) and for Fig. S6. Unless stated otherwise, all measurements are given as mean ± SEM. Results were considered significant when P < 0.05.
Supplementary Material
Acknowledgments
We thank Karel Svoboda for support and for critical input on the initial development of EPBscore; Anthony Holtmaat and Linda Wilbrecht for help with an initial set of experiments; Peter Bloomfield for help with the TB analysis; the Medical Research Council Clinical Sciences Centre microscopy facility and Keng Imm Hng for help with the immunohistochemical analysis; Marco Cantoni for his help with the FIBSEM imaging; and Roberto Fiore for comments on the manuscript. S.S. is supported by National Science Foundation of China Grant 20111300429 and by the Open Research Fund of the State Key Laboratory of Cognitive Neuroscience and Learning. This work was funded by the Medical Research Council.
Footnotes
The authors declare no conflict of interest.
This article is a PNAS Direct Submission.
This article contains supporting information online at www.pnas.org/lookup/suppl/doi:10.1073/pnas.1218731110/-/DCSupplemental.
References
- 1.Burke SN, Barnes CA. Neural plasticity in the ageing brain. Nat Rev Neurosci. 2006;7(1):30–40. doi: 10.1038/nrn1809. [DOI] [PubMed] [Google Scholar]
- 2.Morrison JH, Baxter MG. The ageing cortical synapse: Hallmarks and implications for cognitive decline. Nat Rev Neurosci. 2012;13(4):240–250. doi: 10.1038/nrn3200. [DOI] [PMC free article] [PubMed] [Google Scholar]
- 3.Burke SN, Barnes CA. Senescent synapses and hippocampal circuit dynamics. Trends Neurosci. 2010;33(3):153–161. doi: 10.1016/j.tins.2009.12.003. [DOI] [PMC free article] [PubMed] [Google Scholar]
- 4.Geinisman Y, deToledo-Morrell L, Morrell F, Persina IS, Rossi M. Age-related loss of axospinous synapses formed by two afferent systems in the rat dentate gyrus as revealed by the unbiased stereological dissector technique. Hippocampus. 1992;2(4):437–444. doi: 10.1002/hipo.450020411. [DOI] [PubMed] [Google Scholar]
- 5.Foster TC, Barnes CA, Rao G, McNaughton BL. Increase in perforant path quantal size in aged F-344 rats. Neurobiol Aging. 1991;12(5):441–448. doi: 10.1016/0197-4580(91)90071-q. [DOI] [PubMed] [Google Scholar]
- 6.Kasai H, Matsuzaki M, Noguchi J, Yasumatsu N, Nakahara H. Structure-stability-function relationships of dendritic spines. Trends Neurosci. 2003;26(7):360–368. doi: 10.1016/S0166-2236(03)00162-0. [DOI] [PubMed] [Google Scholar]
- 7.Dumitriu D, et al. Selective changes in thin spine density and morphology in monkey prefrontal cortex correlate with aging-related cognitive impairment. J Neurosci. 2010;30(22):7507–7515. doi: 10.1523/JNEUROSCI.6410-09.2010. [DOI] [PMC free article] [PubMed] [Google Scholar]
- 8.Bloss EB, et al. Evidence for reduced experience-dependent dendritic spine plasticity in the aging prefrontal cortex. J Neurosci. 2011;31(21):7831–7839. doi: 10.1523/JNEUROSCI.0839-11.2011. [DOI] [PMC free article] [PubMed] [Google Scholar]
- 9.Smith TD, et al. Circuit-specific alterations in hippocampal synaptophysin immunoreactivity predict spatial learning impairment in aged rats. J Neurosci. 2000;20(17):6587–6593. doi: 10.1523/JNEUROSCI.20-17-06587.2000. [DOI] [PMC free article] [PubMed] [Google Scholar]
- 10.Slutsky I, et al. Enhancement of learning and memory by elevating brain magnesium. Neuron. 2010;65(2):165–177. doi: 10.1016/j.neuron.2009.12.026. [DOI] [PubMed] [Google Scholar]
- 11.Zuo Y, Yang G, Kwon E, Gan WB. Long-term sensory deprivation prevents dendritic spine loss in primary somatosensory cortex. Nature. 2005;436(7048):261–265. doi: 10.1038/nature03715. [DOI] [PubMed] [Google Scholar]
- 12.Holtmaat A, Wilbrecht L, Knott GW, Welker E, Svoboda K. Experience-dependent and cell-type-specific spine growth in the neocortex. Nature. 2006;441(7096):979–983. doi: 10.1038/nature04783. [DOI] [PubMed] [Google Scholar]
- 13.Yang G, Pan F, Gan WB. Stably maintained dendritic spines are associated with lifelong memories. Nature. 2009;462(7275):920–924. doi: 10.1038/nature08577. [DOI] [PMC free article] [PubMed] [Google Scholar]
- 14.Hofer SB, Mrsic-Flogel TD, Bonhoeffer T, Hübener M. Experience leaves a lasting structural trace in cortical circuits. Nature. 2009;457(7227):313–317. doi: 10.1038/nature07487. [DOI] [PMC free article] [PubMed] [Google Scholar]
- 15.Marik SA, Yamahachi H, McManus JN, Szabo G, Gilbert CD. Axonal dynamics of excitatory and inhibitory neurons in somatosensory cortex. PLoS Biol. 2010;8(6):e1000395. doi: 10.1371/journal.pbio.1000395. [DOI] [PMC free article] [PubMed] [Google Scholar]
- 16.Xu T, et al. Rapid formation and selective stabilization of synapses for enduring motor memories. Nature. 2009;462(7275):915–919. doi: 10.1038/nature08389. [DOI] [PMC free article] [PubMed] [Google Scholar]
- 17.Harris KM, Stevens JK. Dendritic spines of CA 1 pyramidal cells in the rat hippocampus: Serial electron microscopy with reference to their biophysical characteristics. J Neurosci. 1989;9(8):2982–2997. doi: 10.1523/JNEUROSCI.09-08-02982.1989. [DOI] [PMC free article] [PubMed] [Google Scholar]
- 18.Murthy VN, Schikorski T, Stevens CF, Zhu Y. Inactivity produces increases in neurotransmitter release and synapse size. Neuron. 2001;32(4):673–682. doi: 10.1016/s0896-6273(01)00500-1. [DOI] [PubMed] [Google Scholar]
- 19.Kopec CD, Li B, Wei W, Boehm J, Malinow R. Glutamate receptor exocytosis and spine enlargement during chemically induced long-term potentiation. J Neurosci. 2006;26(7):2000–2009. doi: 10.1523/JNEUROSCI.3918-05.2006. [DOI] [PMC free article] [PubMed] [Google Scholar]
- 20.Matz J, Gilyan A, Kolar A, McCarvill T, Krueger SR. Rapid structural alterations of the active zone lead to sustained changes in neurotransmitter release. Proc Natl Acad Sci USA. 2010;107(19):8836–8841. doi: 10.1073/pnas.0906087107. [DOI] [PMC free article] [PubMed] [Google Scholar]
- 21.Ruediger S, et al. Learning-related feedforward inhibitory connectivity growth required for memory precision. Nature. 2011;473(7348):514–518. doi: 10.1038/nature09946. [DOI] [PubMed] [Google Scholar]
- 22.Loewenstein Y, Kuras A, Rumpel S. Multiplicative dynamics underlie the emergence of the log-normal distribution of spine sizes in the neocortex in vivo. J Neurosci. 2011;31(26):9481–9488. doi: 10.1523/JNEUROSCI.6130-10.2011. [DOI] [PMC free article] [PubMed] [Google Scholar]
- 23.Kasai H, Fukuda M, Watanabe S, Hayashi-Takagi A, Noguchi J. Structural dynamics of dendritic spines in memory and cognition. Trends Neurosci. 2010;33(3):121–129. doi: 10.1016/j.tins.2010.01.001. [DOI] [PubMed] [Google Scholar]
- 24.Holtmaat A, et al. Long-term, high-resolution imaging in the mouse neocortex through a chronic cranial window. Nat Protoc. 2009;4(8):1128–1144. doi: 10.1038/nprot.2009.89. [DOI] [PMC free article] [PubMed] [Google Scholar]
- 25.Knott GW, Holtmaat A, Wilbrecht L, Welker E, Svoboda K. Spine growth precedes synapse formation in the adult neocortex in vivo. Nat Neurosci. 2006;9(9):1117–1124. doi: 10.1038/nn1747. [DOI] [PubMed] [Google Scholar]
- 26.De Paola V, et al. Cell type-specific structural plasticity of axonal branches and boutons in the adult neocortex. Neuron. 2006;49(6):861–875. doi: 10.1016/j.neuron.2006.02.017. [DOI] [PubMed] [Google Scholar]
- 27.Feng G, et al. Imaging neuronal subsets in transgenic mice expressing multiple spectral variants of GFP. Neuron. 2000;28(1):41–51. doi: 10.1016/s0896-6273(00)00084-2. [DOI] [PubMed] [Google Scholar]
- 28.Chklovskii DB, Mel BW, Svoboda K. Cortical rewiring and information storage. Nature. 2004;431(7010):782–788. doi: 10.1038/nature03012. [DOI] [PubMed] [Google Scholar]
- 29.Helmstaedter M, Briggman KL, Denk W. High-accuracy neurite reconstruction for high-throughput neuroanatomy. Nat Neurosci. 2011;14(8):1081–1088. doi: 10.1038/nn.2868. [DOI] [PubMed] [Google Scholar]
- 30.Canty AJ, De Paola V. Axonal reconstructions going live. Neuroinformatics. 2011;9(2-3):129–131. doi: 10.1007/s12021-011-9112-3. [DOI] [PMC free article] [PubMed] [Google Scholar]
- 31.Ottersen OP, Helm PJ. How hardwired is the brain? Nature. 2002;420(6917):751–752. doi: 10.1038/420751a. [DOI] [PubMed] [Google Scholar]
- 32.Hübener M, Bonhoeffer T. Searching for engrams. Neuron. 2010;67(3):363–371. doi: 10.1016/j.neuron.2010.06.033. [DOI] [PubMed] [Google Scholar]
- 33.Holtmaat A, Svoboda K. Experience-dependent structural synaptic plasticity in the mammalian brain. Nat Rev Neurosci. 2009;10(9):647–658. doi: 10.1038/nrn2699. [DOI] [PubMed] [Google Scholar]
- 34.Yu X, Zuo Y. Spine plasticity in the motor cortex. Curr Opin Neurobiol. 2011;21(1):169–174. doi: 10.1016/j.conb.2010.07.010. [DOI] [PMC free article] [PubMed] [Google Scholar]
- 35.Samuel MA, Zhang Y, Meister M, Sanes JR. Age-related alterations in neurons of the mouse retina. J Neurosci. 2011;31(44):16033–16044. doi: 10.1523/JNEUROSCI.3580-11.2011. [DOI] [PMC free article] [PubMed] [Google Scholar]
- 36.Hara Y, et al. Synaptic characteristics of dentate gyrus axonal boutons and their relationships with aging, menopause, and memory in female rhesus monkeys. J Neurosci. 2011;31(21):7737–7744. doi: 10.1523/JNEUROSCI.0822-11.2011. [DOI] [PMC free article] [PubMed] [Google Scholar]
- 37.Sale A, et al. Environmental enrichment in adulthood promotes amblyopia recovery through a reduction of intracortical inhibition. Nat Neurosci. 2007;10(6):679–681. doi: 10.1038/nn1899. [DOI] [PubMed] [Google Scholar]
- 38.Guan JS, et al. HDAC2 negatively regulates memory formation and synaptic plasticity. Nature. 2009;459(7243):55–60. doi: 10.1038/nature07925. [DOI] [PMC free article] [PubMed] [Google Scholar]
- 39.De Roo M, Klauser P, Muller D. LTP promotes a selective long-term stabilization and clustering of dendritic spines. PLoS Biol. 2008;6(9):e219. doi: 10.1371/journal.pbio.0060219. [DOI] [PMC free article] [PubMed] [Google Scholar]
- 40.Fu M, Yu X, Lu J, Zuo Y. Repetitive motor learning induces coordinated formation of clustered dendritic spines in vivo. Nature. 2012;483(7387):92–95. doi: 10.1038/nature10844. [DOI] [PMC free article] [PubMed] [Google Scholar]
- 41.Poirazi P, Mel BW. Impact of active dendrites and structural plasticity on the memory capacity of neural tissue. Neuron. 2001;29(3):779–796. doi: 10.1016/s0896-6273(01)00252-5. [DOI] [PubMed] [Google Scholar]
- 42.Yasumatsu N, Matsuzaki M, Miyazaki T, Noguchi J, Kasai H. Principles of long-term dynamics of dendritic spines. J Neurosci. 2008;28(50):13592–13608. doi: 10.1523/JNEUROSCI.0603-08.2008. [DOI] [PMC free article] [PubMed] [Google Scholar]
- 43.Shankar S, Teyler TJ, Robbins N. Aging differentially alters forms of long-term potentiation in rat hippocampal area CA1. J Neurophysiol. 1998;79(1):334–341. doi: 10.1152/jn.1998.79.1.334. [DOI] [PubMed] [Google Scholar]
- 44.Norris CM, Korol DL, Foster TC. Increased susceptibility to induction of long-term depression and long-term potentiation reversal during aging. J Neurosci. 1996;16(17):5382–5392. doi: 10.1523/JNEUROSCI.16-17-05382.1996. [DOI] [PMC free article] [PubMed] [Google Scholar]
- 45.Bach ME, et al. Age-related defects in spatial memory are correlated with defects in the late phase of hippocampal long-term potentiation in vitro and are attenuated by drugs that enhance the cAMP signaling pathway. Proc Natl Acad Sci USA. 1999;96(9):5280–5285. doi: 10.1073/pnas.96.9.5280. [DOI] [PMC free article] [PubMed] [Google Scholar]
- 46.Richard MB, Taylor SR, Greer CA. Age-induced disruption of selective olfactory bulb synaptic circuits. Proc Natl Acad Sci USA. 2010;107(35):15613–15618. doi: 10.1073/pnas.1007931107. [DOI] [PMC free article] [PubMed] [Google Scholar]
- 47.Chen JL, et al. Structural basis for the role of inhibition in facilitating adult brain plasticity. Nat Neurosci. 2011;14(5):587–594. doi: 10.1038/nn.2799. [DOI] [PMC free article] [PubMed] [Google Scholar]
- 48.de Villers-Sidani E, et al. Recovery of functional and structural age-related changes in the rat primary auditory cortex with operant training. Proc Natl Acad Sci USA. 2010;107(31):13900–13905. doi: 10.1073/pnas.1007885107. [DOI] [PMC free article] [PubMed] [Google Scholar]
- 49.Becker N, Wierenga CJ, Fonseca R, Bonhoeffer T, Nägerl UV. LTD induction causes morphological changes of presynaptic boutons and reduces their contacts with spines. Neuron. 2008;60(4):590–597. doi: 10.1016/j.neuron.2008.09.018. [DOI] [PubMed] [Google Scholar]
- 50.Fisher-Lavie A, Zeidan A, Stern M, Garner CC, Ziv NE. Use dependence of presynaptic tenacity. J Neurosci. 2011;31(46):16770–16780. doi: 10.1523/JNEUROSCI.3384-11.2011. [DOI] [PMC free article] [PubMed] [Google Scholar]
- 51.Mahncke HW, et al. Memory enhancement in healthy older adults using a brain plasticity-based training program: A randomized, controlled study. Proc Natl Acad Sci USA. 2006;103(33):12523–12528. doi: 10.1073/pnas.0605194103. [DOI] [PMC free article] [PubMed] [Google Scholar]
- 52.De Paola V, Arber S, Caroni P. AMPA receptors regulate dynamic equilibrium of presynaptic terminals in mature hippocampal networks. Nat Neurosci. 2003;6(5):491–500. doi: 10.1038/nn1046. [DOI] [PubMed] [Google Scholar]
- 53.Xu HT, Pan F, Yang G, Gan WB. Choice of cranial window type for in vivo imaging affects dendritic spine turnover in the cortex. Nat Neurosci. 2007;10(5):549–551. doi: 10.1038/nn1883. [DOI] [PubMed] [Google Scholar]
- 54.Bevins RA, Besheer J. Object recognition in rats and mice: A one-trial non-matching-to-sample learning task to study ‘recognition memory’. Nat Protoc. 2006;1(3):1306–1311. doi: 10.1038/nprot.2006.205. [DOI] [PubMed] [Google Scholar]
- 55.Knott G, Rosset S, Cantoni M. Focussed ion beam milling and scanning electron microscopy of brain tissue. 2011 doi: 10.3791/2588. JoVE, 10.3791/2588. [DOI] [PMC free article] [PubMed] [Google Scholar]
- 56.Bishop D, et al. Near-infrared branding efficiently correlates light and electron microscopy. Nat Methods. 2011;8:568–570. doi: 10.1038/nmeth.1622. [DOI] [PubMed] [Google Scholar]
- 57.Anderson JC, Martin KA. Does bouton morphology optimize axon length? Nat Neurosci. 2001;4(12):1166–1167. doi: 10.1038/nn772. [DOI] [PubMed] [Google Scholar]
Associated Data
This section collects any data citations, data availability statements, or supplementary materials included in this article.