Abstract
High-valent intermediates of binuclear nonheme iron enzymes are structurally unknown despite their importance for understanding enzyme reactivity. Nuclear resonance vibrational spectroscopy combined with density functional theory calculations has been applied to structurally well-characterized high-valent mono- and di-oxo bridged binuclear Fe model complexes. Low-frequency vibrational modes of these high-valent diiron complexes involving Fe motion have been observed and assigned. These are independent of Fe oxidation state and show a strong dependence on spin state. It is important to note that they are sensitive to the nature of the Fe2 core bridges and provide the basis for interpreting parallel nuclear resonance vibrational spectroscopy data on the high-valent oxo intermediates in the binuclear nonheme iron enzymes.
Keywords: iron-oxo cores, Fe enzymes
Class Ia ribonucleotide reductase (RR) (1) and soluble methane monooxygenase (sMMO) (2) are members of the class of binuclear nonheme iron enzymes. These have intrigued researchers due to their significance in the development of anticancer drugs (RR) (3) and biofuel catalysts (sMMO) (4) and their varied reactivities using a conserved 2 His/4 carboxylate ligand set. These enzymes use a biFe active site to activate O2 for hydrogen atom abstraction and hydroxylation via key high-valent intermediates called X (5, 6) and Q (7, 8) in RR and sMMO, respectively. Mössbauer studies on these intermediates have shown that X and Q are antiferromagnetically coupled high-spin Fe(III)Fe(IV) and Fe(IV)2 complexes (9, 10), respectively, and their extended X-ray absorption fine structure (EXAFS) spectra have revealed the presence of a short Fe—Fe distance of 2.5 Å and short Fe—O bonds of 1.8 Å (11, 12). Various structures have been suggested for these intermediates including a {Fe2(μO)2} diamond core, a protonated diamond core, and a mono-oxo bridged core with additional μ-1,1-carboxylate bridges (12–20), but consensus has not been reached. Their structural elucidation is essential for understanding their reaction mechanisms on a molecular level.
Vibrational spectroscopy can provide valuable information on the geometric structures of transient species. However, to this date, efforts to obtain resonance Raman (rR) spectroscopic data on intermediates X and Q have not been successful due to their photolability under laser irradiation (2, 21). For these intermediates, nuclear resonance vibrational spectroscopy (NRVS) is a suitable alternative. NRVS uses third-generation synchrotron radiation to probe vibrational side bands of the 57Fe nuclear transition (22–26). All of the vibrational modes that contain significant Fe displacement are observable in NRVS spectra, providing a complementary and more complete set of information relative to rR spectroscopy. NRVS has been successfully applied to mononuclear nonheme Fe(III)-peroxo (27) and Fe(IV)-oxo intermediates (28) and binuclear nonheme Fe(III)2-peroxo species (29), providing significant insight into their reactivities.
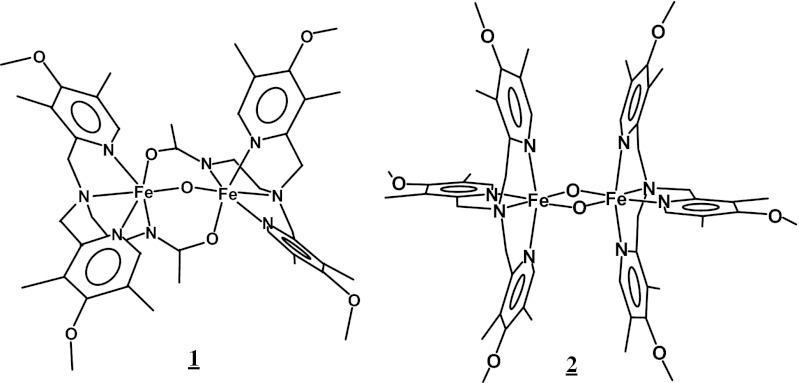
The focus of this study is to establish a basis for the NRVS study of high-valent diiron enzyme intermediates based on well-defined structures. Four structurally characterized synthetic compounds, mono-oxo and di-oxo bridged Fe(III)Fe(IV) and Fe(IV)2 complexes, were chosen for this study (Fig. 1). Complex 1, [Fe2O(L)2] (L = N,N-bis-(3′,5′-dimethyl-4′-methoxypyridyl-2′-methyl)-N′-acetyl-1,2-diaminoethane) (30), contains a monoμ-oxo bridged diiron center that has two additional amide bridges that model the carboxylate bridges of the biFe enzymes. Its Fe(III)Fe(III) form has been crystallized, and its conversions to the Fe(III)Fe(IV) and Fe(IV)2 complexes without structural disruption have been achieved by electrochemical oxidation. Their EXAFS and Mössbauer data show that the high-valent complexes have shorter Fe-ligand bonds than the Fe(III)Fe(III) precursor due to their spin conversion from high-spin to low-spin states. Complex 2, [Fe2O2(L′)2] (L′ = Tris(4-methoxy-3,5-dimethylpyridyl-2-methyl)amine) (31), contains a {Fe2(μO)2} diamond core that has been proposed as a structure for intermediate Q. Its Fe(III)Fe(IV) complex was obtained by oxidation of the mono-oxo bridged [Fe2O(H2O)(OH)(L′)2] complex with H2O2 (32). This oxidation reaction also results in the conversion of the Fes from high to low spin. This Fe(III)Fe(IV) complex is stable and an X-ray crystal structure of an analogous complex [Fe2O2(Tris(5-ethyl-2-pyridylmethyl)amine)2] (2′) is available (33). [Fe2O2(L′)2] can be converted to the Fe(IV)2 form by either electrolysis or chemical oxidation using WCl6, without undergoing any structural disruption according to their EXAFS spectra (31).
Fig. 1.
Structures of 1 and 2.
Here we report the NRVS spectra of the high-valent Fe(III)Fe(IV) and Fe(IV)2 complexes of 1 and 2 and their spectral assignments using density functional theory (DFT) calculations, and evaluate the effects of spin and oxidation state of the Fe centers on their NRVS spectra. The results reveal that low-energy vibrational features appear with prominent NRVS intensities and are characteristic of the core structure. The insights obtained from these model studies are then extended to generate a library of DFT-simulated NRVS spectra for the possible structures of intermediate Q in sMMO.
Results and Analysis
NRVS Spectra of 1 and 2.
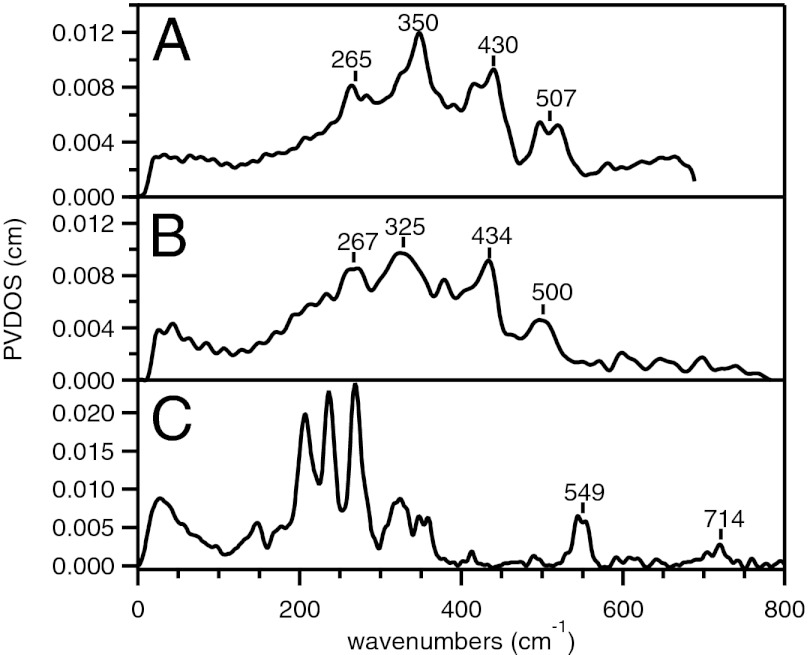
The NRVS spectra of the mono-oxo bridged Fe(IV)2, Fe(III)Fe(IV), and Fe(III)2 complexes of 1 are given in Fig. 2. The Fe(IV)2 and Fe(III)Fe(IV) complexes of 1 display three major broad bands in the energy region between 200 and 450 cm−1 and a smaller feature at ∼500 cm−1. The three bands peak at 265, 350, and 430 cm−1 for the Fe(IV)2 complex (Fig. 2A) and at 267, 325, and 434 cm−1 for the Fe(III)Fe(IV) complex (Fig. 2B). Thus, their NRVS spectral features in the energy region below 450 cm−1 are essentially independent of their oxidation state (Fig. 2 A and B) [and within the resolution of the NRVS experiment (∼8 cm−1), not sensitive to 18O isotope labeling (Fig. S1)]. As an alternative, the NRVS spectrum of the Fe(III)2 starting material of 1 in Fig. 2C shows more intense features mostly in the lower-energy region between 200 and 350 cm−1 and two small features at 549 and 714 cm−1. The two high-energy features are consistent with the rR and IR data of related 56Fe species, respectively (Table S1) (34). Due to the difference in energy of the major NRVS features of the Fe(III)2 precursor relative to the high-valent Fe(IV)2 and Fe(III)Fe(IV) species, samples that had some decay to the Fe(III)2 species (due to accidental warming above −80 °C in transfer) were excluded during data collection. The similarity between the NRVS spectra of the Fe(IV)2 and Fe(III)Fe(IV) species demonstrates that the NRVS spectral difference between the Fe(III)2 precursor and the high-valent species is not due to the change in oxidation state of the Fe centers but to their change in spin state. Although the 2Fe(III)s of the precursor are in the S = 5/2 high-spin states, the 2 Fes of the high-valent complexes are low spin (30). Thus, the bonds are shorter in the latter and their vibrational frequencies are higher. This is consistent with previous EXAFS and Mössbauer studies of 1 (30).
Fig. 2.
NRVS spectra of (A) low-spin Fe(IV)Fe(IV) and (B) low-spin Fe(III)Fe(IV) of 1, and (C) their high-spin Fe(III)Fe(III) precursor.
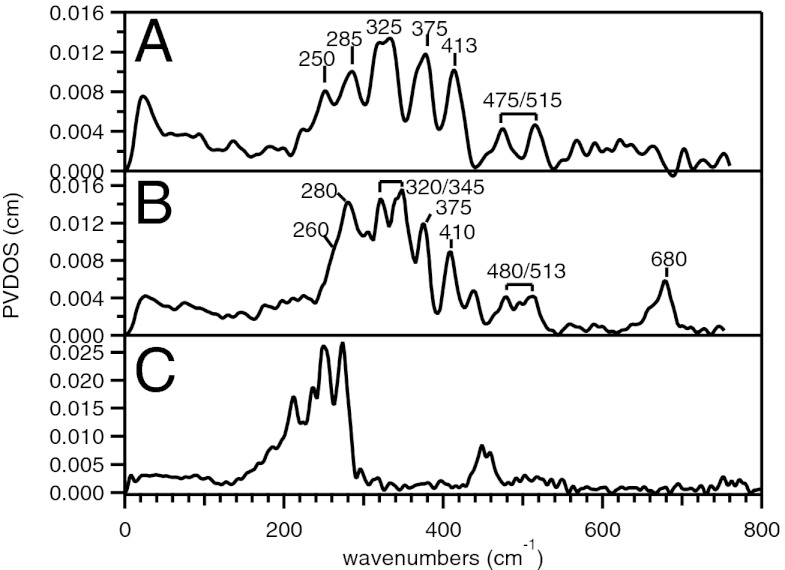
Similarly, the di-oxo bridged low-spin Fe(IV)2 and Fe(III)Fe(IV) complexes 2 were prepared from a high-spin Fe(III)2 precursor (31, 32). Again, although the major NRVS features of the high-valent complexes of 2 are in the energy region between 200 and 450 cm−1, those of the Fe(III)2 precursor appear at lower energy between 200 and 300 cm−1 (Fig. 3) and high-valent data containing this intense decay contribution were excluded from consideration. The Fe(IV)2 complex of 2 displays five discrete bands at 250, 285, 325, 375, and 413 cm−1 (Fig. 3A). These five features are sharper than the major bands of 1, but the increased width of the band in the middle (at 325 cm−1) suggests that it contains contributions from multiple vibrations. The major NRVS features of the Fe(III)Fe(IV) complex of 2 peak at 280, 320, 345, 375, and 410 cm−1 (Fig. 3B), slightly different from those of its Fe(IV)2 complex (Fig. 3A). However, the band at 280 cm−1 in the NRVS spectrum of the Fe(III)Fe(IV) complex displays a low-energy shoulder at ∼260 cm−1, which can be a counterpart of the 250 cm−1 band in the Fe(IV)2 complex. Moreover, the doublet at 320 and 345 cm−1 in the Fe(III)Fe(IV) spectrum corresponds to the relatively broad band at 325 cm−1 in the Fe(IV)2 spectrum. Therefore, allowing for minor energy shifts of the bands, as was found for 1, these low-energy NRVS spectral features of the Fe(IV)2 and Fe(III)Fe(IV) complexes of 2 are very similar to each other and are also not sensitive to 18O isotope labeling (Fig. S2). Finally, in the energy region above 450 cm−1, the Fe(IV)2 and Fe(III)Fe(IV) complexes of 2 show two weaker features at ∼475 and ∼515 cm−1, and in the case of the Fe(III)Fe(IV) complex, an additional higher-energy peak was observable in the NRVS data at 680 cm−1, consistent with rR data on the related 56Fe species (Fig. S3 and Table S2) (35).
Fig. 3.
NRVS spectra of (A) low-spin Fe(IV)Fe(IV) and (B) low-spin Fe(III)Fe(IV) of 2, and (C) their high-spin Fe(III)Fe(III) precursor.
A comparison between the NRVS spectra of high-valent 1 and high-valent 2 reveals that the mono-oxo bridged complex displays a less split peak pattern than the di-oxo bridged complex (three vs. five peak-splitting in the region between 250 and 450 cm−1). This demonstrates that the geometric structures (i.e., mono- vs. bis-oxo bridged) of Fe2-containing cores can be distinguished based on their NRVS spectra.
DFT Simulations of NRVS Spectra and Assignments.
DFT models were constructed from X-ray crystal structures to assign the NRVS features and to understand spectral differences between 1 and 2, using calculations calibrated based on the data for the Fe(III)2 precursor of 1 (Fig. S4). The average Fe—μO bond length decreased upon Fe oxidation from Fe(III)2 to Fe(III)Fe(IV) (by 0.04 Å), but did not significantly change upon further oxidation to Fe(IV)2 (Table S3 and Fig. S5). This is consistent with previous EXAFS observations, which showed that the Fe—μO distance decreased by 0.08 Å upon oxidation from the Fe(III)2 to the Fe(III)Fe(IV) state, but only changed by 0.01 Å upon further oxidation to the Fe(IV)2 state (30).
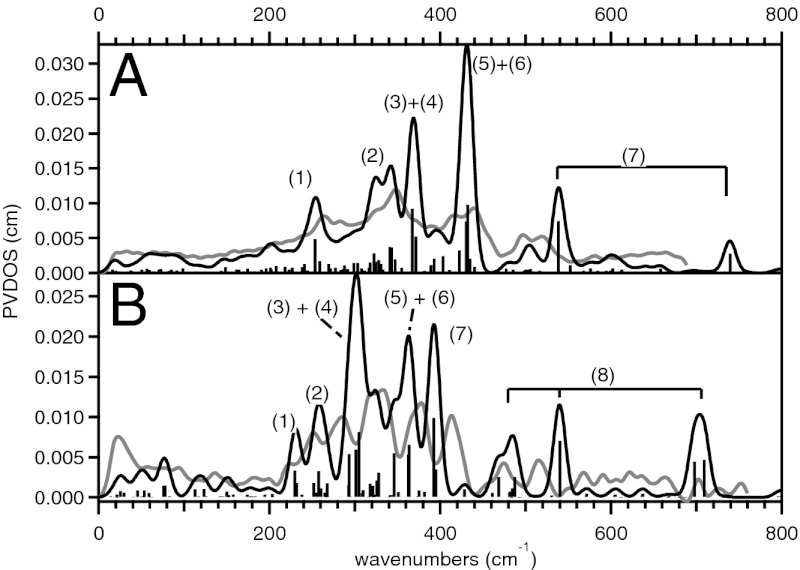
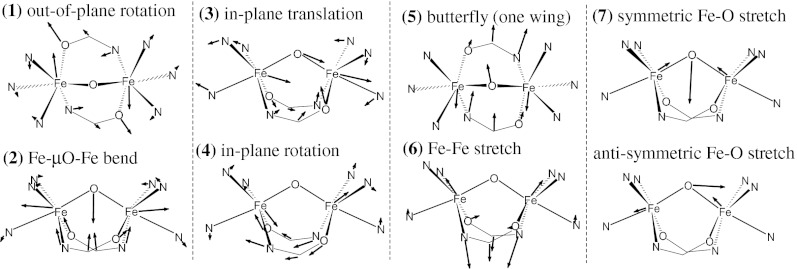
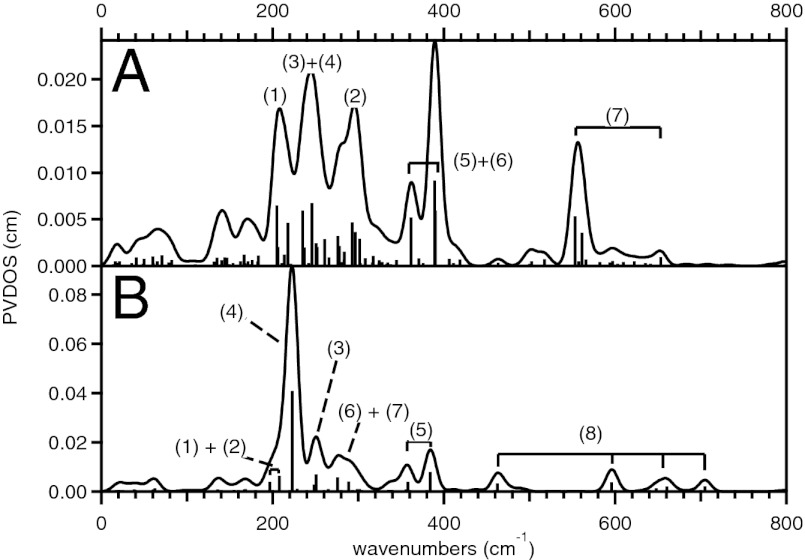
The DFT-predicted NRVS spectra for the Fe(IV)2 and Fe(III)Fe(IV) complexes of 1 are consistent with our experimental data, both reproducing the three-peak pattern in the energy region below 450 cm−1 with the broad middle feature (Fig. 4A and Fig. S6A). The three bands at 265, 350, and 430 cm−1 in the experimental spectrum of the Fe(IV)2 complex (Fig. 2A) are reproduced at 255, 310∼380, and 430 cm−1 in the DFT simulation (Fig. 4A), and their corresponding vibrational modes are depicted in Fig. 5. The lowest-energy peak at 255 cm−1 (265 cm−1 in the experimental spectrum) is associated with the out-of-plane rotation of the {Fe2μO} core with respect to the axis bisecting the Fe—μO—Fe angle (1 in Fig. 5). The middle-energy multiplet at 310–380 cm−1 [350 cm−1; experiment (exp)] contains contributions from the Fe—μO—Fe bend (2 in Fig. 5), the in-plane translation of the {Fe2μO} core (3 in Fig. 5), and the in-plane rotation of the core (4 in Fig. 5). The highest-energy peak of the three-peak pattern at 430 cm−1 (430 cm−1; exp) corresponds to mixed contributions from the out-of-plane rotation of the {Fe2μO} core with respect to the Fe—Fe axis (a “one-winged butterfly” motion; 5 in Fig. 5) and the Fe—Fe stretch (6 in Fig. 5). Finally, the high-energy feature at 540 cm−1 (510 cm−1; exp) is assigned as the symmetric Fe—μO stretch (7 in Fig. 5). The DFT calculations show that although the high-energy (>450 cm−1) Fe—μO stretches vary with the oxidation state of the Fe, the low-energy intense three-peak pattern does not (Fig. S6A).
Fig. 4.
DFT-predicted NRVS spectra of the high-valent Fe(IV)2 species of (A) 1 and (B) 2 (black). Experimental data are plotted in gray for comparison and relevant normal modes are depicted in Figs. 5 and 6. Bars indicate the mode factors (i.e., intensities) of the vibrational modes that contain significant Fe displacement.
Fig. 5.
DFT-calculated vibrational modes of 1. For clarity, only first-coordination-sphere motions are presented.
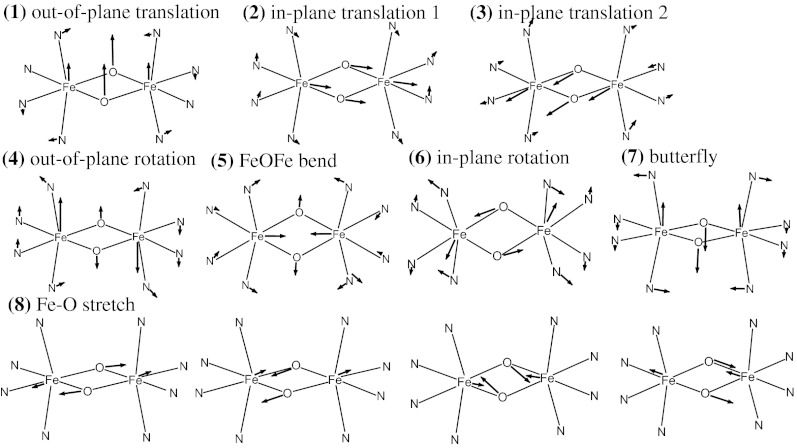
The DFT model of the Fe(III)Fe(IV) complex of 2 was obtained as described for 1, and reasonably matched the crystal structure (Table S4 and Fig. S5) and the experimental NRVS data (Fig. S6B). Fig. 4B shows that the DFT calculation for 2 successfully reproduced the five-band pattern in the NRVS spectrum of the Fe(IV)2 complex (at 250, 285, 325, 375, and 413 cm−1 in Fig. 3A), as it predicts five peaks at 230, 260, 300, 360, and 390 cm−1 in Fig. 4B. Seven vibrational modes in Fig. 6 contribute to these five peaks as indicated in Fig. 4B. The peak at 230 cm−1 (250 cm−1; exp) is associated with the out-of-plane translation of the {Fe2(μO)2} core (1 in Fig. 6), and the peak at 260 cm−1 (285 cm−1; exp) corresponds to the in-plane translation of the core along the Fe—N(pyridine) bonds (2 in Fig. 6). The peak at 300 cm−1 (325 cm−1; exp) contains contributions from two modes, the in-plane translation of the core along the Fe—N(amine) bonds (3 in Fig. 6) and the out-of-plane rotation of the core (4 in Fig. 6). The peak at 360 cm−1 (375 cm−1; exp) also has two contributions, the Fe—μO—Fe bend (5 in Fig. 6) and the in-plane rotation of the {Fe2(μO)2} core (6 in Fig. 6). The peak at 390 cm−1 (413 cm−1; exp) is associated with the out-of-plane bend of the {Fe2(μO)2} core (the “butterfly” mode; 7 in Fig. 6). Finally, four Fe—O stretches are predicted for 2 in the energy region above 450 cm−1. These correspond to the two peaks experimentally observed at 475 and 515 cm−1, and the other two are predicted at >700 cm−1 and not experimentally accessible. As seen for 1, DFT calculations predict that, in contrast to the high-energy features associated with Fe—μO stretches, the low-energy NRVS features are independent of Fe oxidation state (Fig. S6B).
Fig. 6.
DFT-calculated vibrational modes of 2. For clarity, only first-coordination-sphere motions are presented.
Although for 1, the out-of-plane rotation of the core (1 in Fig. 5) contributes to the lowest-energy peak at 255 cm−1 (265 cm−1; exp) and the out-of-plane translation of the core has negligible NRVS intensity, for 2, the corresponding out-of-plane translation (1 in Fig. 6) and rotation (4 in Fig. 6) of the {Fe2(μO)2} core split in energy and contribute to bands at 230 cm−1 (250 cm−1; exp) and 300 cm−1 (325 cm−1; exp), respectively. Similarly, for 1, the in-plane translation and rotation modes are close in energy and contribute to the same broad feature at 310∼380 cm−1 (350 cm−1; exp); however, for 2, the two in-plane translations and the rotation modes split in energy and contribute to three discrete features at 260 cm−1 (285 cm−1; exp), 300 cm−1 (325 cm−1; exp), and 360 cm−1 (375 cm−1; exp). The Fe—μO—Fe bend that contributed to the middle broad band at 310∼380 cm−1 (350 cm−1; exp) in 1 now contributes to the band at 360 cm−1 (375 cm−1; exp) in 2. The butterfly mode at 390 cm−1 (413 cm−1; exp) of 2 correlates to the one-wing butterfly mode at 430 cm−1 (430 cm−1; exp) of 1. These band assignments, summarized in Fig. 4, reveal that the broad experimental NRVS band at ∼350 cm−1 in 1 has multiple contributions, the Fe—μO—Fe bend (2 in Fig. 4) and the in-plane translation (3 in Fig. 4) and rotation (4 in Fig. 4) of the core, and these split into three discrete bands at 285, 325, and 375 cm−1 in the NRVS data of 2 (vibrations in 2–5 in Fig. 6). This splitting occurs because the {Fe2(μO)2} core of 2 translates and rotates along the Fe-terminal ligand bonds (Fig. 6), which have three different stretch force constants associated with the different Fe—N bond lengths and the different basicities of amine and pyridine ligands. Alternatively in 1, the in-plane translations and rotation of the {Fe2(μO)} core bisect the Fe-ligand bonds (Fig. 5), and thus their frequencies reflect an average of all of the Fe-ligand stretch force constants, giving the broad peak.
DFT-Predicted NRVS Spectra of High-Spin Analogs.
Both Fe centers of the high-valent complexes of 1 and 2 are in the low-spin state, and the Mössbauer data on the enzyme intermediates X and Q show that they have high-spin, high-valent Fe centers (9, 10). Considering that the Fe spin state significantly affects the NRVS spectra (compare Figs. 2C and 3C with 2 A and B and 3 A and B), the effect of spin conversion on the NRVS spectra of the high-valent species was evaluated to provide a basis for studies of the enzyme intermediates. Thus, DFT models for the high-spin (hs) analogs of the Fe(IV)2 complexes of 1 and 2, termed hs 1 and hs 2, were generated from their low-spin DFT models that, as described above, successfully reproduced the corresponding experimental NRVS data.
The DFT-optimized structures of hs 1 and hs 2 showed that upon conversion from low to high spin, all of the Fe-ligand bonds were elongated (Tables S3 and S4), and accordingly the energy of most of the major NRVS features of 1 decreased (compare Figs. 4A and 7A). Instead of the three features at 255, 310∼380, and 430 cm−1 in the DFT-predicted spectrum of the low-spin (ls) Fe(IV)2 complex of 1 (ls 1), the predicted NRVS spectrum of hs 1 shows four features in the energy region below 400 cm−1 (at 210, 245, 295, and 380 cm−1). These correspond to mode (1), the combination of modes (3) and (4), mode (2), and the combination of modes (5) and (6), in order of increasing energy. The peak associated with the symmetric Fe—μO stretch (7) appears at 555 cm−1 in hs 1, up-shifted in energy compared with 540 cm−1 in ls 1.
Fig. 7.
DFT-predicted NRVS spectra of high-spin Fe(IV)2 complexes of (A) 1 and (B) 2.
These results show that the lowest- and highest-energy features of the three-peak pattern in ls 1 (255 and 430 cm−1) correspond to the lowest- and highest-energy features of the four-peak pattern in hs 1 (210 and 380 cm−1) and that the broad middle-energy feature of ls 1 (310∼380 cm−1) now splits into two discrete peaks in hs 1 (245 and 295 cm−1). Note that upon going to the hs complex, the energy of the feature associated with in-plane core motions (3 and 4 in Fig. 5) greatly decreased (by ∼125 cm−1), and the energies of other features associated with the out-of-plane rotation of the core (1 in Fig. 5), the Fe—μO—Fe bend (2 in Fig. 5), and the combination of the one-wing butterfly (5 in Fig. 5) and Fe—Fe stretch (6 in Fig. 5) only modestly decreased (by 45, 35, and 50 cm−1, respectively). The significant down-shift in energy of the in-plane core motions reflects the greatly reduced force constants for the Fe-ligand stretches in the high-spin complex (Table S5 and Fig. S7A). This is due to increased occupation of the σ-anti-bonding d orbitals in hs 1 and consistent with the elongation of Fe-ligand bonds upon spin conversion (Table S3). As an alternative, the minor shifts of the lowest- and highest-energy bands in the energy region below 450 cm−1 reflect the contributions of the Fe-amide bridge bend and the internal amide bridge bend to the out-of-plane rotation of the core (1 in Fig. 5) and the combination of the one-wing butterfly (5 in Fig. 5) and Fe—Fe stretch (6 in Fig. 5), the force constants of which are not dependent on the Fe spin state. Finally, the minor shift of the Fe—μO—Fe bend (2 in Fig. 5) and the increase in the energy of the symmetric Fe—μO stretch (7 in Fig. 5) reflect an increase in the Fe—μO—Fe bend force constant (Table S5). This is due to an increase in Fe—μO π bonding character as the oxo-σ bonding character is decreased upon spin conversion.
The elongation of Fe-ligand bonds in the conversion from ls to hs is more severe for 2 than for 1, especially for the Fe-axial ligands (Table S4). In consequence, the simulated NRVS spectral changes upon the spin conversion are more prominent for 2 than for 1. Instead of the five-peak pattern in ls 2 (Fig. 4B), there is now one major intense feature at 223 cm−1 and a weak feature at ∼380 cm−1 in the DFT-simulated spectrum of hs 2 (Fig. 7B). The low-energy intense feature is associated with all of the modes 1∼7 in Fig. 7 except for the Fe—μO—Fe bend (5 in Fig. 7) that have merged into the 200∼300 cm−1 region, and the higher-energy weak feature at 380 cm−1 is the Fe—μO—Fe bend (5 in Fig. 7). Finally, the four Fe—μO stretch vibrations are redistributed but in a similar energy region (485, 540, 698, and 710 cm−1 in ls 2 to 463, 597, 660, and 705 cm−1 in hs 2).
The down-shifted, merged peak at 223 cm−1 in hs 2 (Fig. 7B) reflects the greatly reduced Fe-ligand stretch force constants (Table S6 and Fig. S7B). Due to the occupations of the Fe 3dz2 orbitals in hs 2 that are σ-anti-bonding (strongly with the axial ligands), the force constants of the Fe-ligand stretches decrease and become comparable to those of the ligand-Fe-ligand bends. Therefore, the core motions in 1∼4 and 6∼7 in Fig. 6, which have mixed contributions from both stretches and bends, have similar energies. Note that the mode factors in Fig. 7B show that the intensity of this merged NRVS peak at 223 cm−1 is dominantly from the out-of-plane rotation of the {Fe2(μO)2} core (4 in Fig. 6). This large Fe motion reflects the weaker Fe-axial ligand bonds of hs 2 due to their stronger σ-anti-bonding interaction. Alternatively, the up-shift in energy and decrease in intensity of the Fe—μO—Fe bend upon the spin conversion (compare band 5 in Figs. 7B and 4B) reflects an increased force constant for the Fe—μO—Fe bend as found above for hs 1 (Table S6).
Thus, the simulated NRVS spectra of hs 1 and hs 2 in Fig. 7 exhibit the opposite trend to those of their low-spin counterparts in Fig. 4. The high-spin spectra in Fig. 7 show that the mono-oxo bridged 1 displays a more split peak pattern than the di-oxo bridged 2. This NRVS spectral change in going from high-spin, mono- to di-oxo bridge structure is experimentally supported by data on related high-spin Fe(III)2 complexes (Fig. S8). This spectral difference reflects two structural perturbations from 1 to 2: the removal of amide bridges and the insertion of the second oxo bridge. First, in the spectrum of mono-oxo 1, modes involving Fe-amide and internal amide bridge bends (1, 5, and 6 in Fig. 5) appear as the lowest- and highest-energy features and remain split in energy with prominent intensities (210 and 380 cm−1), regardless of Fe spin state. The corresponding butterfly mode of hs 2 (7 in Fig. 6) is merged into the core motion modes peaking at 223 cm−1, due to the absence of additional amide bridges. Second, the core motions (245 cm−1; 1, 3, and 4 in Fig. 5) and the Fe—μO—Fe bend (295 cm−1; 2 in Fig. 5) show comparable intensities in hs 1, and in hs 2, the Fe—μO—Fe bend (5 in Fig. 6) appears more weakly at higher energy (380 cm−1) than in hs 1 due to additional involvement of O—Fe—O bend force constants in hs 2.
Discussion
The NRVS spectra of mono- and di-oxo bridged Fe(III)Fe(IV) and Fe(IV)2 model complexes have been used to develop a basis for the NRVS analysis of high-valent enzyme intermediates. These spectra reveal that the experimentally accessible NRVS features at energies below 450 cm−1 are almost insensitive to Fe oxidation state but very sensitive to Fe spin state and the bridging ligand structure. Although the NRVS spectra of the low-spin model complexes show that the di-oxo species displays a more split pattern than the mono-oxo species (Fig. 4), the NRVS spectra of high-spin computational models show the opposite trend: the mono-oxo hs 1 shows multiple intense, well-separated peaks associated with the core motions, the Fe—μO—Fe bend, and the amide bridge motions, and the di-oxo hs 2 shows a less split pattern with one intense, low-energy and one weak, high-energy band associated with the core motions and the Fe—μO—Fe bend, respectively. The two bands associated with the core motions and the Fe—μO—Fe bend are less split in energy and more comparable in intensity in hs 1 than in hs 2.
These findings on the model complexes can be used to predict the NRVS spectra of possible structures for Q in sMMO (and X in RR). Four different high-spin structures were constructed with the 2His/4carboxylate enzyme active-site ligands based on proposed structures for Q (12, 18–20). DFT geometry optimizations were performed with α-carbon constraints on structures that have: (i) a mono(μ-oxo) core with both carboxylate bridges closed (i.e., bridging); (ii) a di-(μ-oxo) core with both carboxylate bridges closed; (iii) a di-(μ-oxo) core with one carboxylate bridge open and a terminal H2O ligand at the open Fe site; and (iv) a (μ-oxo)(μ-hydroxo) core with one carboxylate bridge open and a terminal H2O ligand.
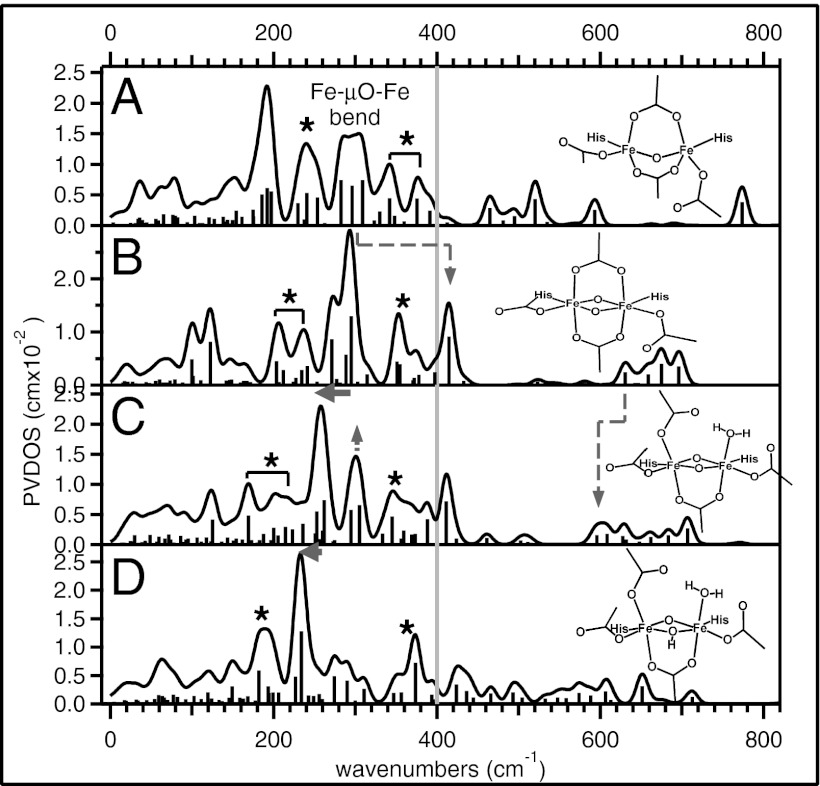
The DFT-predicted NRVS spectrum of the mono-oxo model in Fig. 8A looks similar to the predicted NRVS spectrum of hs 1, showing a multiple-peak pattern in the energy region below 400 cm−1, although bands associated with the out-of-plane rotation, the butterfly, and the Fe—Fe stretch modes (1, 5, and 6 in Fig. 5) in Fig. 7A now involve carboxylate bends instead of amide bends and display less NRVS intensity (denoted with asterisks in Fig. 8A).
Fig. 8.
DFT-predicted NRVS spectra of models that have (A) mono(μ-oxo) with both carboxylate bridges closed, (B) di-(μ-oxo) with both carboxylate bridges closed, (C) di-(μ-oxo) with one carboxylate bridge open with a terminal H2O ligand, and (D) (μ-oxo)(μ-hydroxo) with one carboxylate bridge open with a terminal H2O ligand.
The di-oxo model with closed carboxylate bridges in Fig. 8B is similar to hs 2, as its simulated NRVS spectrum exhibits a major intense peak at ∼290 cm−1, which corresponds to the major peak at 223 cm−1 of hs 2 in Fig. 7B (out-of-plane rotation; 4 in Fig. 6), and an additional feature at 415 cm−1, which corresponds to the peak at 380 cm−1 of hs 2 in Fig. 7B (the Fe—μO—Fe bend; 5 in Fig. 6). These features in Fig. 8B are shifted up in energy from those in Fig. 7B, due to the stronger anionic Fe-carboxylate bonds relative to 2. The presence of the carboxylate bridges, which mix Fe-bridge bend and internal bridge bend into the core motions as seen in 1, split the energy of the out-of-plane translation (1 in Fig. 6) and the butterfly mode (7 in Fig. 6) and generate side-bands at ∼220 and ∼350 cm−1 next to the major (∼290 cm−1) band (denoted with asterisks in Fig. 8B). These features distinguish the model in Fig. 8B from hs 2 (Fig. 7B) that does not have additional axial bridging ligands. The di-oxo model in Fig. 8B can be distinguished from the mono-oxo model in Fig. 8A, because of the dominant intensity of the major band at ∼290 cm−1 (relative to a multiple-peak pattern in Fig. 8A) and the presence of the additional high-energy feature at >400 cm−1 associated with the Fe—μO—Fe bend. This parallels the spectral difference between hs 1 and hs 2 (compare Fig. 7 A and B).
An alternative bis-oxo bridged structure proposed for Q has one of the carboxylate bridges open with a H2O ligating the Fe at the open site. Its DFT-predicted NRVS spectrum is shown in Fig. 8C and is similar to that of the closed model in Fig. 8B, as it also shows one intense feature now at ∼260 cm−1 and an additional feature at 415 cm−1. However, this model (Fig. 8C) can still be distinguished from the closed model (Fig. 8B), because the major peak is down-shifted in energy by ∼30 cm−1 and the feature at ∼300 cm−1 associated with in-plane rotation gains more intensity as Fe motions are less restrained with the opened carboxylate bridge (arrows in Fig. 8C). This opening of the carboxylate bridge also down-shifts one of the Fe—μO stretch peaks from 630 cm−1 in Fig. 8B to 600 cm−1 in Fig. 8C as Fe-carboxylate bends are no longer involved in the motion.
Because the Fe—Fe distance of Q is 2.5 Å from EXAFS, the mono-oxo model in Fig. 8A, which has a predicted Fe—Fe distance of 3.11 Å, is likely excluded. Thus, we also considered a μ-oxo, μ-hydroxo-bridged structure with a shorter Fe—Fe distance (2.93 Å). The model in Fig. 8D was prepared from the model in Fig. 8C that has a Fe—Fe distance of 2.72 Å by protonating one of the oxo bridges. Its DFT-predicted NRVS spectrum in Fig. 8D shows a pattern similar to that of the model in Fig. 8C, but is still distinguishable with a more down-shifted intense band now at ∼230 cm−1.
These predicted NRVS spectra of Q show that NRVS features in the energy region below 450 cm−1 can be characteristic of geometric structure, in particular, oxygen bridging, carboxylate bridging, and protonation level of the core. This model-calibrated NRVS study of high-valent complexes can now be applied to determine the geometric structures of the high-valent intermediates in the binuclear nonheme iron enzymes.
Materials and Methods
Sample Preparation.
For NRVS data collection, 1-mm-thick samples, either solutions or solids, were placed in a cell made of Lucite and covered with polyimide tape. The yields given below for high-valent samples were determined by Mössbauer spectroscopy.
The Fe(III)Fe(IV) and Fe(IV)2 complexes of 1 were prepared by bulk electrolysis of the Fe(III)2 precursor at −40 °C following the published procedure in ref. 30 and obtained with >95% and 85% yield, respectively. The 5-mM Fe(III)Fe(IV) and 3-mM Fe(IV)2 complexes in CH3CN solutions were frozen for NRVS samples, and the Fe(III)2 precursor sample contained pure solid. The Fe(III)2 and Fe(III)Fe(IV) samples of 2 were prepared in CH3CN solution as described in ref. 31, with final concentrations of 15 and 7 mM, respectively. The Fe(IV)2 complex of 2 was prepared by one-electron oxidation of the Fe(III)Fe(IV) complex dissolved in CH3CN at −40 °C using WCl6 under an inert atmosphere. A fine red powder was obtained by adding Et2O to the reaction mixture and washing it with 3:1 Et2O-MeCN after filtration. This powder had 50 wt% of the Fe(IV)2 complex of 2 with > 70% yield and was used for the NRVS sample. The 18O-labeled Fe(IV)2 complex of 2 was prepared in the same way with 18O-labeled Fe(III)Fe(IV) precursor.
NRVS Spectroscopy.
NRVS data were collected on the beam line 3-ID at the Advanced Photon Source and the nuclear resonant scattering beam line (BL09XU) at SPring-8. The reproducibility of each scan was monitored to check for photoreduction of the sample. Multiple data sets were combined and processed using the PADD and PHOENIX programs to produce partial vibrational density of states (PVDOS) spectra (36).
DFT Calculations.
The X-ray crystal structure of the high-spin Fe(III)2 precursor of 1 (30) was optimized using spin-unrestricted DFT calculations with the Gaussian 09 package (37). To calibrate the calculations, the fraction of Hartree–Fock (HF) exchange was varied from 0% to 20%, and the 90% Becke–Perdew86 (BP86)/10% HF hybrid functional was chosen based on reproducibility of the optimized structure and simulated NRVS spectrum of the Fe(III)2 complex of 1 (Table S3 and Figs. S1 and S2). The 6–31G* basis set reproduced the results for the Fe(III)2 complex of 1 as obtained with the 6–311G* basis set (Fig. S4), so the former was used for all other calculations to save computational cost. NRVS data were simulated from DFT frequency calculations using the GenNRVS program. The energy-minimized Fe(III)2 structure of 1 was then used to obtain the optimized structures of its Fe(III)Fe(IV) and Fe(IV)2 complexes. Although the Mössbauer data on the Fe(III)Fe(IV) complex of 1 suggested a electron delocalized Fe3.5+Fe3.5+ core (30), DFT calculations produced either a localized Fe(III)Fe(IV) or Fe(IV)Fe(III) core at essentially equivalent energies. Using their average geometry raised the free energy by only 2.6 kcal/mol and did not create imaginary frequencies; thus this average geometry structure was used for the NRVS simulation of the Fe(III)Fe(IV) complex of 1. For 2, the X-ray crystal structure of the Fe(III)Fe(IV) species (2′) (33) that is equivalent to 2 was used to obtain DFT models for the high-valent complexes. Geometry optimizations and frequency calculations were also performed using the 10% HF functional, and the Fe(IV)2 structure of 2 was optimized from its Fe(III)Fe(IV) structure. For the high-spin analogs of 1 and 2, the geometries of their low-spin models were reoptimized with the high-spin wave functions defined using Gaussian 09 fragment input. For simulating the NRVS spectra of possible Q structures, the α carbons of the first sphere ligand sets of the sMMO structure (PDB 1FYZ) (38) were replaced with H atoms, constrained during optimization, and immobilized with heavy masses for predicting localized normal modes.
Supplementary Material
Acknowledgments
Use of synchrotron radiation at the BL09XU of SPring-8 and the Advanced Photon Source at Argonne National Laboratory was supported by Japan Synchrotron Radiation Research Institute (Proposals 2010B1569 and 2011A1326) and the Department of Energy, Office of Science, Office of Basic Energy Sciences (Contract DE-AC02-06CH11357), respectively. Financial support for this research was provided by National Science Foundation Grant MCB-0919027 (to E.I.S.), National Institutes of Health Grants GM-40392 (to E.I.S.) and GM-38767 (to L.Q.), Japan Society for the Promotion of Science Grants-in-Aid for Young Scientists [B] 21750064 (to T.O.) and Japan Science and Technology Agency JST-Core Research for Evolutional Science and Technology (to M.S.).
Footnotes
The authors declare no conflict of interest.
This article contains supporting information online at www.pnas.org/lookup/suppl/doi:10.1073/pnas.1304238110/-/DCSupplemental.
References
- 1.Stubbe J. Di-iron-tyrosyl radical ribonucleotide reductases. Curr Opin Chem Biol. 2003;7(2):183–188. doi: 10.1016/s1367-5931(03)00025-5. [DOI] [PubMed] [Google Scholar]
- 2.Tinberg CE, Lippard SJ. Dioxygen activation in soluble methane monooxygenase. Acc Chem Res. 2011;44(4):280–288. doi: 10.1021/ar1001473. [DOI] [PMC free article] [PubMed] [Google Scholar]
- 3.Shao J, Zhou B, Chu B, Yen Y. Ribonucleotide reductase inhibitors and future drug design. Curr Cancer Drug Targets. 2006;6(5):409–431. doi: 10.2174/156800906777723949. [DOI] [PubMed] [Google Scholar]
- 4.Lee SW, Keeney DR, Lim DH, Dispirito AA, Semrau JD. Mixed pollutant degradation by Methylosinus trichosporium OB3b expressing either soluble or particulate methane monooxygenase: can the tortoise beat the hare? Appl Environ Microbiol. 2006;72(12):7503–7509. doi: 10.1128/AEM.01604-06. [DOI] [PMC free article] [PubMed] [Google Scholar]
- 5.Baldwin J, et al. Mechanism of rapid electron transfer during oxygen activation in the R2 subunit of escherichia coli ribonucleotide reductase. 1. Evidence for a transient tryptophan radical. J Am Chem Soc. 2000;122:12195–12206. [Google Scholar]
- 6.Bollinger J, et al. Mechanism of assembly of the tyrosyl radical-diiron(III) cofactor of escherichia-coli ribonucleotide reductase. 3. Kinetics of the limiting Fe2+ reaction by optical, EPR, and Mossbauer spectroscopies. J Am Chem Soc. 1994;116:8024–8032. [Google Scholar]
- 7.Brazeau BJ, Lipscomb JD. Kinetics and activation thermodynamics of methane monooxygenase compound Q formation and reaction with substrates. Biochemistry. 2000;39(44):13503–13515. doi: 10.1021/bi001473l. [DOI] [PubMed] [Google Scholar]
- 8.Tinberg CE, Lippard SJ. Oxidation reactions performed by soluble methane monooxygenase hydroxylase intermediates H(peroxo) and Q proceed by distinct mechanisms. Biochemistry. 2010;49(36):7902–7912. doi: 10.1021/bi1009375. [DOI] [PMC free article] [PubMed] [Google Scholar]
- 9.Sturgeon BE, et al. Reconsideration of X, the diiron intermediate formed during cofactor assembly in E. coli ribonucleotide reductase. J Am Chem Soc. 1996;118:7551–7557. [Google Scholar]
- 10.Lee SK, Fox BG, Froland WA, Lipscomb JD, Münck E. A transient intermediate of the methane monooxygenase catalytic cycle containing an FeIVFeIV cluster. J Am Chem Soc. 1993;115:6450–6451. [Google Scholar]
- 11.Riggs-Gelasco P, et al. EXAFS characterization of the intermediate X generated during the assembly of the escherichia coli ribonucleotide reductase R2 diferric tyrosyl radical cofactor. J Am Chem Soc. 1998;120:849–860. [Google Scholar]
- 12.Shu L, et al. An Fe2IVO2 diamond core structure for the key intermediate Q of methane monooxygenase. Science. 1997;275(5299):515–518. doi: 10.1126/science.275.5299.515. [DOI] [PubMed] [Google Scholar]
- 13.Siegbahn PEM. Theoretical model studies of the iron dimer complex of MMO and RNR. Inorg Chem. 1999;38(12):2880–2889. doi: 10.1021/ic981332w. [DOI] [PubMed] [Google Scholar]
- 14.Han WG, Noodleman L. DFT calculations for intermediate and active states of the diiron center with a tryptophan or tyrosine radical in Escherichia coli ribonucleotide reductase. Inorg Chem. 2011;50(6):2302–2320. doi: 10.1021/ic1020127. [DOI] [PMC free article] [PubMed] [Google Scholar]
- 15.Han WG, Noodleman L. DFT calculations of comparative energetics and ENDOR/Mössbauer properties for two protonation states of the iron dimer cluster of ribonucleotide reductase intermediate X. Dalton Trans. 2009;30(30):6045–6057. doi: 10.1039/b903847g. [DOI] [PMC free article] [PubMed] [Google Scholar]
- 16.Shanmugam M, Doan PE, Lees NS, Stubbe J, Hoffman BM. Identification of protonated oxygenic ligands of ribonucleotide reductase intermediate X. J Am Chem Soc. 2009;131(9):3370–3376. doi: 10.1021/ja809223s. [DOI] [PMC free article] [PubMed] [Google Scholar]
- 17.Mitić N, Clay MD, Saleh L, Bollinger JM, Jr, Solomon EI. Spectroscopic and electronic structure studies of intermediate X in ribonucleotide reductase R2 and two variants: a description of the FeIV-oxo bond in the FeIII-O-FeIV dimer. J Am Chem Soc. 2007;129(29):9049–9065. doi: 10.1021/ja070909i. [DOI] [PMC free article] [PubMed] [Google Scholar]
- 18.Han WG, Noodleman L. Structural model studies for the high-valent intermediate Q of methane monooxygenase from broken-symmetry density functional calculations. Inorg Chim Acta. 2008;361(4):973–986. doi: 10.1016/j.ica.2007.06.007. [DOI] [PMC free article] [PubMed] [Google Scholar]
- 19.Baik MH, Gherman BF, Friesner RA, Lippard SJ. Hydroxylation of methane by non-heme diiron enzymes: molecular orbital analysis of C-H bond activation by reactive intermediate Q. J Am Chem Soc. 2002;124(49):14608–14615. doi: 10.1021/ja026794u. [DOI] [PubMed] [Google Scholar]
- 20.Siegbahn PEM, Crabtree RH. Mechanism of C-H activation by diiron methane monooxygenases: Quantum chemical studies. J Am Chem Soc. 1997;119:3103–3113. [Google Scholar]
- 21.Lee SK, Nesheim JC, Lipscomb JD. Transient intermediates of the methane monooxygenase catalytic cycle. J Biol Chem. 1993;268(29):21569–21577. [PubMed] [Google Scholar]
- 22.Seto M, Yoda Y, Kikuta S, Zhang XW, Ando M. Observation of nuclear resonant scattering accompanied by phonon excitation using synchrotron radiation. Phys Rev Lett. 1995;74(19):3828–3831. doi: 10.1103/PhysRevLett.74.3828. [DOI] [PubMed] [Google Scholar]
- 23.Sturhahn W, et al. Phonon density of states measured by inelastic nuclear resonant scattering. Phys Rev Lett. 1995;74(19):3832–3835. doi: 10.1103/PhysRevLett.74.3832. [DOI] [PubMed] [Google Scholar]
- 24.Alp EE, Mooney TM, Toellner T, Sturhahn W. Nuclear resonant scattering beamline at the advanced photon source. Hyperfine Interact. 1994;90:323–334. [Google Scholar]
- 25.Sturhahn W. Nuclear resonant spectroscopy. J Phys Condens Matter. 2004;16:S497–S530. [Google Scholar]
- 26.Scheidt WR, Durbin SM, Sage JT. Nuclear resonance vibrational spectroscopy—NRVS. J Inorg Biochem. 2005;99(1):60–71. doi: 10.1016/j.jinorgbio.2004.11.004. [DOI] [PubMed] [Google Scholar]
- 27.Liu LV, et al. Definition of the intermediates and mechanism of the anticancer drug bleomycin using nuclear resonance vibrational spectroscopy and related methods. Proc Natl Acad Sci USA. 2010;107(52):22419–22424. doi: 10.1073/pnas.1016323107. [DOI] [PMC free article] [PubMed] [Google Scholar]
- 28.Wong SD, et al. Nuclear resonance vibrational spectroscopy on the FeIV=O S=2 non-heme site in TMG3tren: Experimentally calibrated insights into reactivity. Angew Chem Int Ed. 2011;50:3215–3218. doi: 10.1002/anie.201007692. [DOI] [PMC free article] [PubMed] [Google Scholar]
- 29.Park K, et al. NRVS and DFT study of peroxo-bridged biferric complexes: Structural insight into peroxy intermediates of binuclear non-heme iron enzymes. Angew Chem Int Ed. 2013;52:1294–1298. doi: 10.1002/anie.201208240. [DOI] [PubMed] [Google Scholar]
- 30.Wang D, Farquhar ER, Stubna A, Münck E, Que L. A diiron(IV) complex that cleaves strong C-H and O-H bonds. Nat Chem. 2009;1(2):145–150. doi: 10.1038/nchem.162. [DOI] [PMC free article] [PubMed] [Google Scholar]
- 31.Xue G, et al. A synthetic precedent for the [FeIV2(μ-O)2] diamond core proposed for methane monooxygenase intermediate Q. Proc Natl Acad Sci USA. 2007;104(52):20713–20718. doi: 10.1073/pnas.0708516105. [DOI] [PMC free article] [PubMed] [Google Scholar]
- 32.Dong Y, et al. A high-valent nonheme iron intermediate. structure and properties of [Fe2(m-O)2(5-me-TPA)2](ClO4)3. J Am Chem Soc. 1995;117:2778–2792. [Google Scholar]
- 33.Hsu H, Dong Y, Shu L, Young V, Que L. Crystal structure of a synthetic high-valent complex with an Fe2(mu-O)2 diamond core. Implications for the core structures of methane monooxygenase intermediate Q and ribonucleotide reductase intermediate X. J Am Chem Soc. 1999;121:5230–5237. [Google Scholar]
- 34.Sanders-Loehr J, et al. Electronic and Raman spectroscopic properties of oxo-bridged dinuclear iron centers in proteins and model compounds. J Am Chem Soc. 1989;111:8084–8093. [Google Scholar]
- 35.Wilkinson EC, et al. Raman signature of the Fe2O2 “diamond” core. J Am Chem Soc. 1998;120:955–962. [Google Scholar]
- 36.Sturhahn W. CONUSS and PHOENIX: Evaluation of nuclear resonant scattering data. Hyperfine Interact. 2000;125:149–172. [Google Scholar]
- 37.Frisch MJ, et al. 2010. Gaussian 09, revision B.01.
- 38.Whittington DA, Lippard SJ. Crystal structures of the soluble methane monooxygenase hydroxylase from Methylococcus capsulatus (Bath) demonstrating geometrical variability at the dinuclear iron active site. J Am Chem Soc. 2001;123(5):827–838. doi: 10.1021/ja003240n. [DOI] [PubMed] [Google Scholar]
Associated Data
This section collects any data citations, data availability statements, or supplementary materials included in this article.


