

Abstract
Objective. To determine the association between characteristics of colleges and schools of pharmacy and their rankings according to US News and World Report.
Methods. The 2008 US News and World Report, mean ranking scores (ranging from 2.0 to 5.0) for 78 US colleges and schools of pharmacy were compared with college and school characteristics, including academic program, students, faculty, and scholarship. The adjusted difference in mean ranking score associated with each characteristic was determined using a multivariate mixed linear regression model.
Results. The most powerful identified predictors of mean ranking score included the amount of grant funding (National Institutes of Health [NIH] and non-NIH funding) a college or school of pharmacy received and the yearly publication rates of its department of pharmacy (p≤0.001 for both). The adjusted mean ranking scores for colleges and schools receiving >$5 million and $1 million to $5 million in scholarly grant funding were respectively 0.77 and 0.26 points higher than those receiving none. Adjusted mean ranking scores for colleges and schools whose departments of pharmacy practice had publishing rates of >20 papers and 11 to 20 papers were respectively 0.40 and 0.17 points higher than those publishing ≤10 (p<0.05 for both).
Conclusion. The characteristic of colleges and schools of pharmacy most associated with US News and World Report rankings appears to be their scholarly productivity.
Keywords: pharmacy education, ranking, assessment, teaching, publications, scholarship
INTRODUCTION
Nearly 30 years ago, US News and World Report (USNWR) began publishing rankings of US colleges and universities. Although this practice started purely as a reputation survey, the methodology behind these rankings has evolved for some fields, such as liberal arts, but not in pharmacy, to include objective indicators of academic excellence (eg, Carnegie Classification of Institutions of Higher Education designation, peer assessment, student retention, faculty and financial resources, student selectivity, alumni giving, graduation rate performance, and high school counselor ratings) in addition to perceived reputation.1
Despite the comprehensive nature of the undergraduate rankings, USNWR uses a different, less stringent methodology for health science schools.2 The rankings for these institutions, including pharmacy colleges and schools, are still based solely on a peer-assessment survey instrument completed by deans and other administrators. The peer assessment survey from which this information is taken, however, had a response rate of only 56%.2 Further, those who were asked to complete the survey instrument did not provide any information on what school characteristics they used to determine their responses/scoring.
Despite research suggesting that students base their matriculation decisions more on overall academic reputation or prestige than on specific rank,3 undergraduate colleges and health-science schools have begun to question the methodology of the rankings and to push back against them. In 2007, a group of US colleges began boycotting the rankings by refusing to complete reputation survey instruments or provide essential data.4 Ascione’s recent editorial in the Journal highlighted the folly of the pharmacy ranking methodology and recommended potential actions by deans of colleges and schools of pharmacy to eliminate or improve the ranking process.5 Although medical school rankings are based on 7 more indicators than are pharmacy rankings, a panel of medical school deans, experts, and students debated the methodology for USNWR’s “Best Medical Schools” rankings in 2011, questioning the use of Medical College Admission Test (MCAT) scores and research dollars as criteria, along with the weighting for each component.6
Considering that pharmacy and other health science colleges and schools rankings are subjected to weak ranking methodology, the desire for stronger methods of evaluating these educational institutions requires knowing what characteristics influence USNWR pharmacy rankings. To address this issue, we sought to determine the association between USNWR college or school of pharmacy rankings and their characteristics, using as many of the same indicators used by the undergraduate USNWR ranking method as possible and adding pharmacy-specific indicators.
METHODS
All colleges and schools of pharmacy ranked in the USNWR pharmacy rankings were eligible for inclusion in this analysis. The mean rank score provided by USNWR, rather than the overall rank, served as the dependent variable. This study used pharmacy schools’ rankings based on the survey instrument administered by USNWR in 2007 and published in 2008.
USNWR Data Gathering
Two USNWR survey instruments were sent to each college and school of pharmacy and were completed by the institutions’ deans and another administrator. USNWR survey respondents were asked to rank the academic quality of programs on a 5-point scale: outstanding (5), strong (4), good (3), adequate (2), or marginal (1). A mean rank score was calculated from the returned survey instruments. These mean rank scores were used to determine rankings, with the college or school receiving the highest mean rank score being ranked as number 1. Institutions receiving a mean rank score below USNWR’s cutoff of 2.0 were listed in alphabetical order at the end of the ranking list but were not given an overall rank and, thus, were not included in the current analysis.
Data Gathering for Current Study
A wide variety of independent variables was selected in order to produce a model representing demographic/characteristic, admissions/enrollment, student, faculty, and scholarship data. Demographic data included census region, year established, public/private institution, program length, student/faculty ratio, if part of academic health center, if dual degrees offered, if doctor of philosophy (PhD) offered, if nontraditional postbaccalaureate degree offered, first-year tuition rate, and if the institution had been on probation at any time since 2000. Census information was determined using the US census regions and divisions available from the US Department of Commerce’s Census Bureau. All colleges and schools were categorized according to the 4 census regions (Northeast, South, Midwest, and West). Information pertaining to the year a given institution was established was obtained by reviewing its Web site. Probation status information was provided by an ACPE staff member and verified on the Web site. To align college and school data with the date of the peer assessment survey, AACP provided student/faculty ratio data for 2007. All other demographic/characteristic information was obtained from the Pharmacy School Admission Requirements (PSAR) data, which were provided by AACP for academic years 2006-2007 and 2007-2008. The PSAR is based on data provided by individual colleges and schools of pharmacy. For cases in which demographic/characteristic information was not available, the next available year for the variable for the college or school was used. Admissions/enrollment variables included whether the Pharmacy College Admission Test (PCAT) or an interview was required, whether a baccalaureate degree was preferred, applicant-to-enrolled ratio, and first-year class size. First-year class size was used as a measure of overall enrollment.
Student-related variables included North American Pharmacist Licensure Examination (NAPLEX) pass rate and mean grade point average (GPA) for the first year class in 2006. Whereas mean GPA was obtained from the PSAR, NAPLEX pass rates were obtained from a National Association of Boards of Pharmacy report released in February 2011.7 For any college or school without an available NAPLEX pass rate for 2007, the first available NAPLEX pass rate after 2007 was used. Multistate Pharmacy Jurisprudence Examination pass rates were not included as a variable because some states do not use this examination for licensure.
Ratio of full professors and associate professors to assistant professors and total numbers of PhD and doctor of pharmacy (PharmD) faculty members were used as characteristics of the faculty at each college or school. The ratio of faculty members and total number of PhD and PharmD full-time equivalent faculty members was gathered from data obtained from AACP.
The final information gathered pertained to the scholarly reputation and productivity of the college or school faculty. Using ranking data available from the Carnegie Foundation for the Advancement of Teaching on their Web site, colleges and schools were classified according to whether they were on a research-intensive campus, affiliated with a research-intensive institution even if not located on that campus, or not research intensive. Institutions were also classified based on whether a faculty member at the college or school had received the Robert K. Chalmers Distinguished Pharmacy Educator award, the Rufus A. Lyman award, or the Volwiler Research Achievement award within the previous 5 years, using data available in the AACP Roster of Faculty and Professional Staff 2007/2008. As a measure of pharmaceutical science faculty scholarly productivity, the grand total of funding from the National Institutes of Health (NIH), non-NIH federal agencies, and the institution’s foundation/association was obtained from AACP.
As a measure of pharmacy practice faculty productivity, publication rates for 2007 were used. This information was obtained using data on file from a previous study for which only cumulative data had been used. Although the college- or school-specific data were never published, the list of publications by pharmacy practice faculty members in 2007 had been identified using the advanced search function in 2 bibliographic databases: Web of Science and PubMed. The list of full-time nonemeritus pharmacy practice faculty members, including department heads and deans regardless of faculty rank or tenure status, had been obtained from the AACP Roster for all Regular Institution Members in the United States for 2007-2008. For each institution, the full names of all faculty members and the name of the university had been used for the search. The search had been limited to articles published in 2007, written in English, and of the publication type “article.” Once the results had been obtained, duplicate publications, commentaries, and editorials were excluded.
Statistical Analysis
To determine how various college and school characteristics influenced mean USNWR ranking scores (the dependent variable), univariate and multivariate analyses were performed. Univariate analysis examined mean ranking scores stratified by categories of various dependent variables. Independent variables included college- or school-level academic program, students, faculty, and scholarship characteristics. All independent variables exhibiting a p value of <0.05 in the univariate analysis were then entered into the multivariate regression analysis (“full model”).
Regression analysis was conducted using a multivariate linear mixed model method. Fixed-effects were assumed for all college- and school-level independent variables included in the model. A p value of <0.05 was considered significant in the multivariate regression model. After running a full model, a “most parsimonious” model was built by removing all independent variables that failed to reach significance in the full model and rerunning the analysis. All statistical analyses were performed using SPSS 15.0 (SPSS Inc., Chicago, IL).
RESULTS
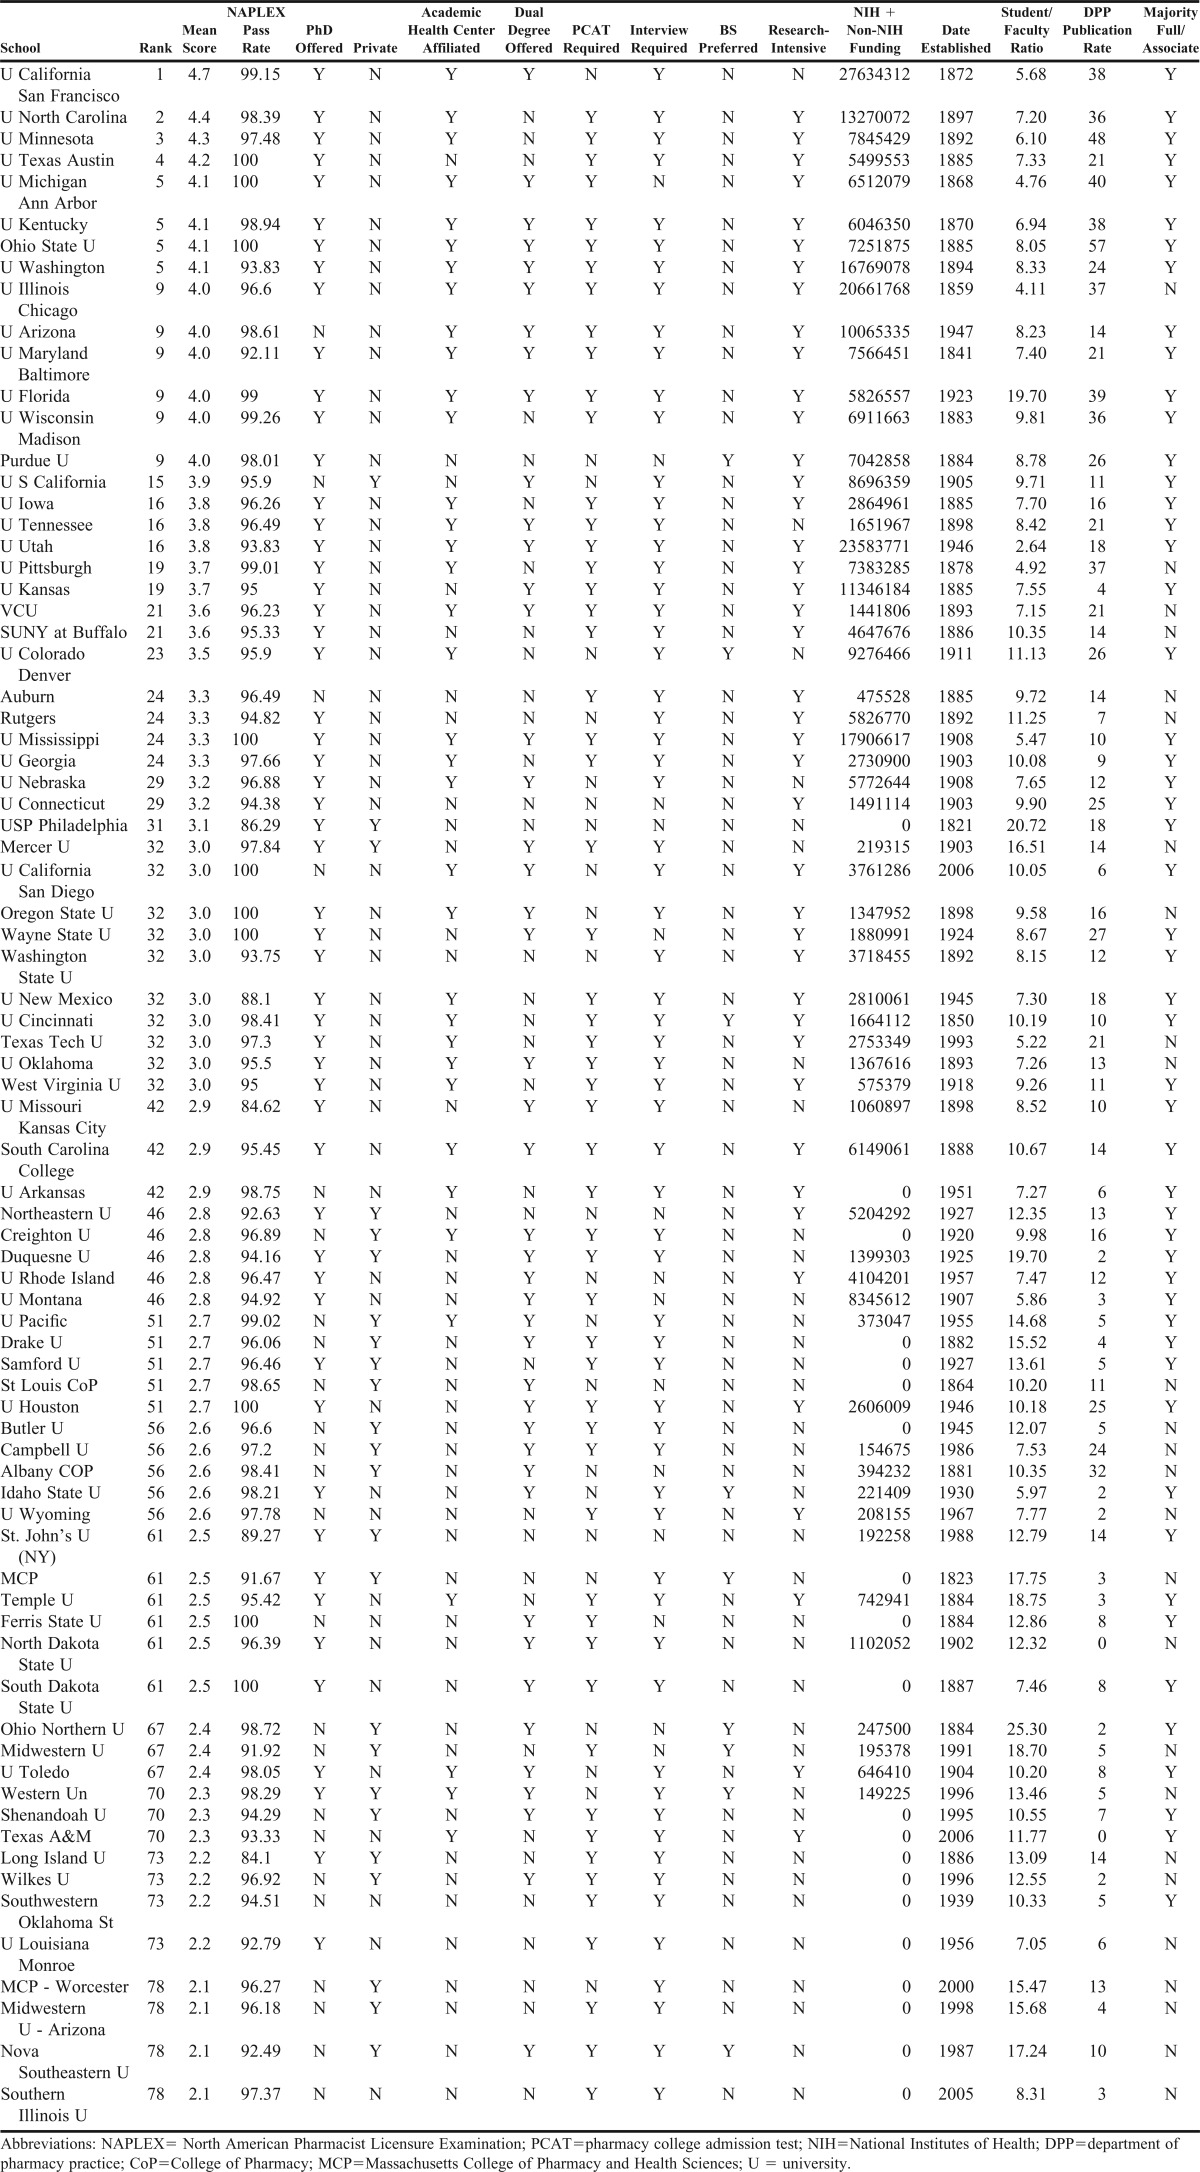
One hundred colleges and schools of pharmacy were included in the peer-assessment survey to determine ranking by USNWR in 2008. Of these, 78 were included in our analysis. According to the USNWR’s Web site, only fully accredited programs in good standing at the time of the survey were ranked.2 Despite this claim, Southern Illinois University, which did not obtain full accreditation status until 2009, was ranked; thus, it is included in the current analysis. Nineteen colleges and schools that had been excluded from USNWR rankings because their mean rank scores were less than 2.0 were unavailable for inclusion in the current analysis. Northeastern Ohio Universities was removed from the analysis because there were incomplete or unobtainable data for many of the independent variables. Although South Carolina College of Pharmacy (SCCP), the University of South Carolina (USC), and the Medical University of South Carolina (MUSC) were all ranked by USNWR in 2008, complete data were not available for any of these colleges and schools. With the formation of SCCP in 2004 through the merger of the other 2 schools, many variables were unavailable for USC and MUSC after 2004, but some data for SCCP were not yet available in 2007. To prevent exclusion of these schools from this analysis, data for all 3 schools were combined to create a complete set of variables. Except for the use of MUSC’s date of establishment, available data for SCCP were the preferred data. When necessary, USC and MUSC data were weighted, in particular for NAPLEX pass rate and faculty rank ratio. Characteristics of colleges and schools included in the final analysis are presented in Appendix 1.
Upon univariate analysis, characteristics found to be significantly correlated with mean ranking score were included in our full multivariate regression model. These included: affiliation with an academic health center, grant funding, years the school/college has existed, student/faculty ratio, ratio of senior to junior faculty members, publication rates by pharmacy practice faculty members, tuition rate, and whether the school/college offered a PhD program, was private or public, preferred a prior baccalaureate degree for admission, and was research intensive.
After the multivariate linear mixed-model method was implemented, characteristics that remained significant included affiliation with an academic health center, grant funding, years the college or school has existed, student/faculty ratio, and the department of pharmacy practice publication rates (Table 1). After nonsignificant variables were removed and the analysis was rerun, these same 5 characteristics were shown to be independent predictors of mean ranking score in the most parsimonious model (Table 2).
Table 1.
Results of Subgroup and Mixed Linear Model Regression Analyses (“Full Model”) Examining Characteristics of Colleges and Schools of Pharmacy Associated With High USNWR Rankings
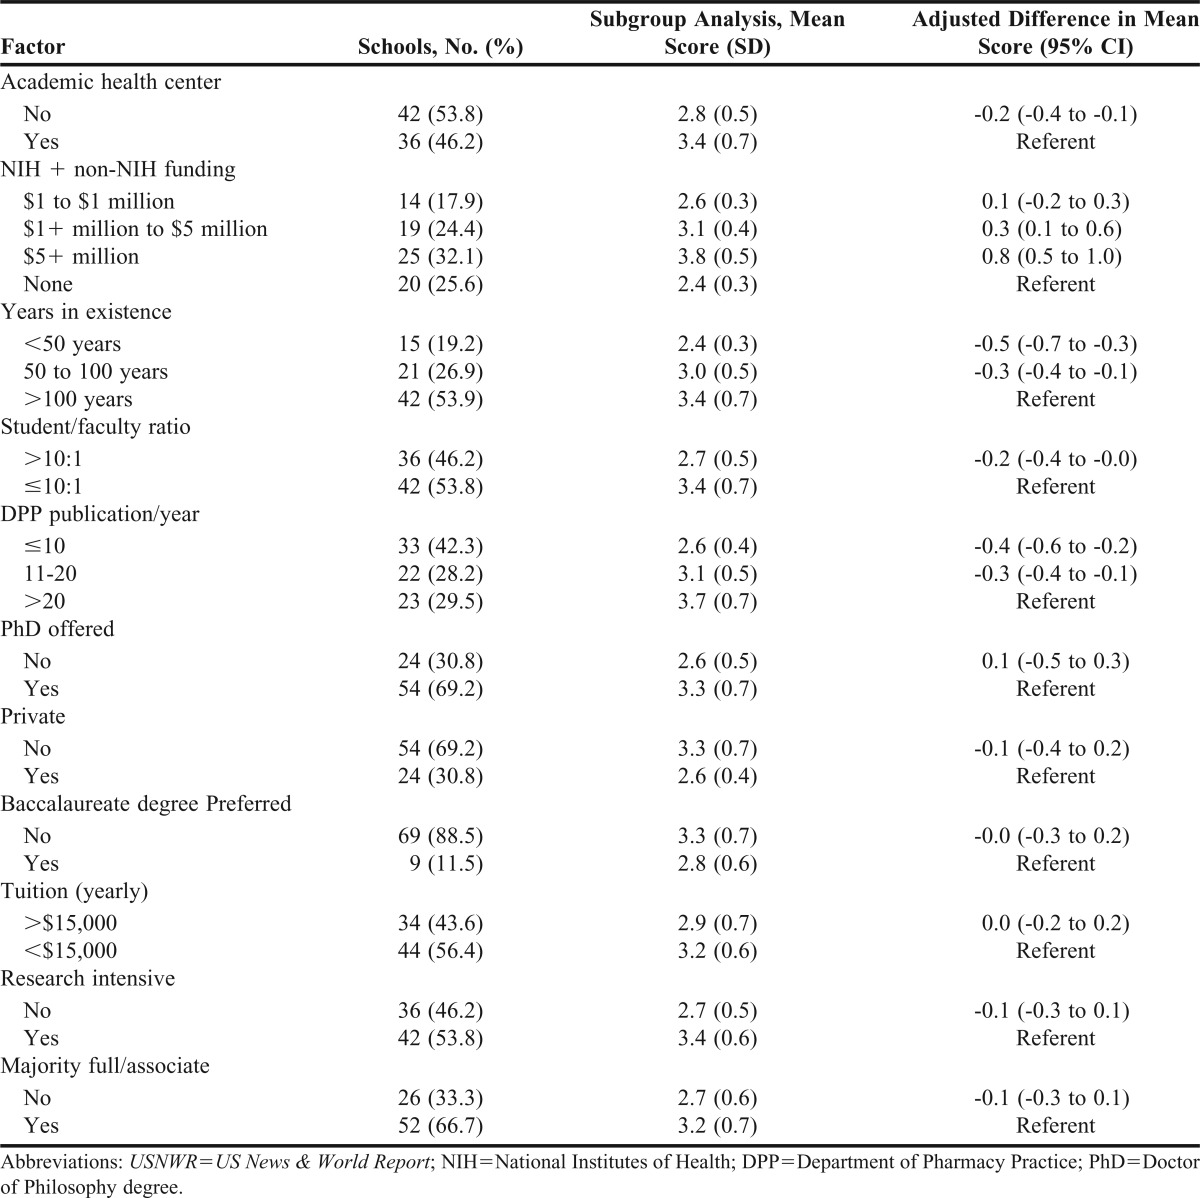
Table 2.
Results of Subgroup and Mixed Linear Model Regression Analyses (“Most Parsimonious Model”) Examining Characteristics of Colleges and Schools of Pharmacy Associated with High USNWR Rankings
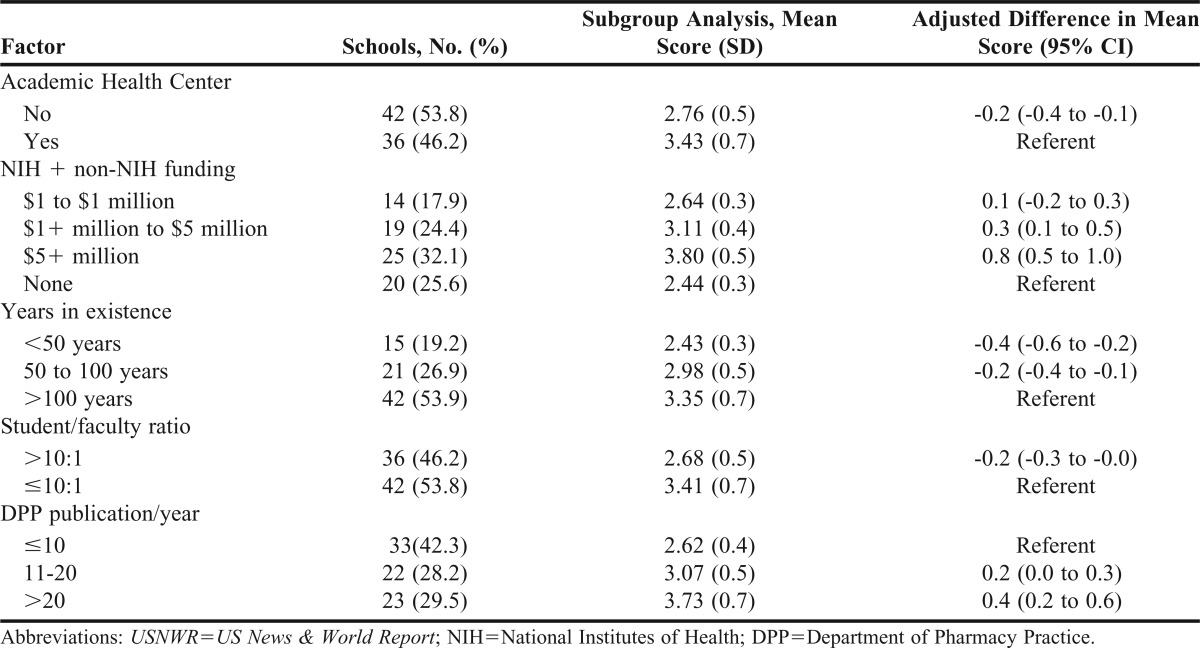
The most powerful identified predictors were the amount of NIH and non-NIH grant funding and pharmacy practice faculty yearly publication rates (p≤0.001 for both). The adjusted mean ranking score for colleges and schools receiving $5+ million, and $1+ million to $5 million in scholarly grant funding were respectively 0.77 and 0.26 points higher than those receiving none. Adjusted mean ranking scores for colleges and schools whose departments of pharmacy practice published >20 and 11-20 papers were respectively 0.40 and 0.17 points higher than those publishing ≤10 (p<0.05 for both). Other characteristics found to significantly impact mean ranking score included affiliation with an academic health center (-0.22), a student-to-faculty ratio >10:1 (-0.16), and the number of years since a college or school was established (0.23 and 0.41 lower scores for colleges and schools, <50 years old and 50-100 years old, respectively, compared with those >100 years old).
DISCUSSION
The biggest benefit of a high USNWR rank relates to admissions. In 2006, more than 16% of high school students reported rankings as “very important” in their school selection, with more than 40% of students at highly selective, private schools and nearly 25 percent of students at highly selective, public schools reporting rankings as “very important.”8 This student view on the importance of ranking translates into increased applications. When a school moves to the front page of the USNWR rankings, a substantial increase in applications is seen the following year,9 providing the school with a more competitive applicant pool and allowing the school to select the top students for their program.
Employers, donors, institution administrators, and the institution at large also use the rankings. When students are looking for postgraduation employment, employers also use the ranking. Faced with applicants holding the same degrees and other qualifications, they turn to the rankings to determine the best applicant. Rankings, which alumni view as a sign of how well the school is performing, can also influence donation decisions. Even nonalumni may learn about the school through these rankings and want to donate. Despite essentially ignoring the rankings when they were first released, institutions now aggressively use them to promote themselves. A top ranking provides a school with bragging rights and propaganda for fundraising and the recruitment of not only students but faculty members and administrators as well.
The downside to the rankings is seen when scores are lower than in previous years or than anticipated. Low scores need to be explained, often to alumni, trustees, donors, parents, potential students, and even the media. Unfortunately, rankings do not affect all colleges and schools equally. The colleges and schools that benefit most from the visibility and prestige gained by higher rankings are the same ones that feel pressure as a result of a lower score. Well-branded colleges and schools do not rely as heavily on a successful ranking because they already have gained prestige and higher visibility.
With so many stakeholders relying on the rankings as a measure of academic excellence, USNWR developed a complex system to determine ranking among undergraduate institutions.10 Despite the comprehensive system used for undergraduate institutions, the methodology for ranking pharmacy colleges and schools continues to be a peer-only assessment, yet colleges and schools of pharmacy, still view USNWR rankings as an important measure of success. Institutions receiving a high ranking are known to include this information on their Web sites, in school literature for student and faculty recruitment, and in literature sent to alumni and donors. Colleges and schools have also been known to include goals in their strategic plans for improving their USNWR ranking. Although some would prefer to disregard the ranking as useless based on the methodology used by USNWR, future and current students, along with their parents and other key stakeholders, take them seriously; therefore, colleges and schools must as well. According to an editorial in the Journal, a drop of only a few spots in a school’s ranking can require deans to proactively defend their ranking to their constituents, even when their raw score has remained stable.5
Whereas the USNWR rankings for pharmacy colleges and schools use only peer assessment survey instruments, this study identified characteristics of colleges and schools more likely to receive a higher ranking as well as those more likely to receive a lower ranking. The most powerful predictors of a higher ranking were related to scholarly productivity of both pharmaceutical science and pharmacy practice faculty members. The most powerful predictors of higher mean ranking scores were NIH and non-NIH grant funding, particularly that exceeding $5 million, and yearly publication rate by pharmacy practice faculty members, particularly that exceeding 20 publications per year. Predictors of lower mean ranking scores included newly established colleges and schools, those with higher student-to-faculty ratios, and those affiliated with an academic health center.
Many colleges and schools with NIH and non-NIH grant funding of $5 million or more have similar characteristics. As might be expected, 84% are Carnegie-rated as research-intensive institutions, compared with only 39.6% that receive less than $5 million in grant funding. Ninety-two percent of the colleges and schools with greater funding are public institutions, compared with only 58.5% with less funding. All but 1 of these colleges and schools were established more than 50 years ago, while 68% were established more than 100 years ago. In 2008, the average longevity of these institutions was 113.8 ± 25 years. They also tended to have larger faculties, with 68% having more than 50 faculty members. This finding may account for the low student-to-faculty ratios at older colleges and schools: 80% had ratios between 1 and 10 students per faculty member with an average first-year enrollment of 132.4 ± 56.1. Despite having similar first-year enrollment (mean=134.3 ± 59.4), only 26.4% of colleges and schools of pharmacy with less grant funding had at least 50 faculty members.
As might be expected, considering that colleges and schools associated with an academic health center had higher mean ranking scores, 72% of colleges and schools with $5 million or more in grant funding were associated with academic health centers, compared with only 33.9% with less grant funding. This finding demonstrates the strength of grant funding as a predictor of USNWR mean ranking scores.
There was a similar correlation between the level of grant funding a college or school of pharmacy received and its pharmacy practice publication rate. Sixty percent of colleges and schools with at least $5 million in grant funding were also producing more than 20 pharmacy practice publications (mean=25.2 ± 14.7) per year, compared with 15.1% of colleges and schools receiving less grant funding (mean=10.7 ± 7.7).
Colleges and schools producing at least 20 pharmacy practice publications per year were predominantly Carnegie-rated as research intensive (78.3%) and public (91.3%). In contrast, approximately 44% of institutions with fewer than 20 publications were research intensive and 60% were public. As it relates to research-intensive institutions with lower publication rates, this finding may be attributable to the research-intensive culture not being inherent in pharmacy practice environments or to fewer faculty members at these institutions.
Nearly 75% of colleges and schools with higher publication rates were established more than 100 years ago with a mean longevity of 109.5 ± 36.4 years. Only 2 of these 23 institutions were less than 50 years old, while nearly 25% producing fewer publications were less than 50 years old. Nearly 70% of the institutions with higher publishing rates were associated with an academic health center, possibly providing increased opportunities for research and collaborations, whereas only 36% of colleges or schools with fewer publications were associated with an academic health center.
There were inherent limitations in the selection of variables to measure in this study. For some variables, a cut point needed to be selected, such as grant funding and student-to-faculty ratios. For grant funding, an attempt was made to create 3 relatively evenly sized groups. In the end, the cut-points selected actually helped to categorize pharmacy colleges and schools as having little to no funding (<$1 million), moderately high funding, and immense funding (>$5 million). The student-to-faculty ratio of 10:1 was selected as the cut point because it was roughly average for the colleges and schools in our study. This cut point does not take into consideration teaching methods, issues with student progression, multiple campuses, evidence that faculty members have time for scholarship, or if a qualitative blend of necessary science and clinical disciplines exists. For the variable of probationary status within the last 10 years, only 2 colleges and schools with USNWR rankings had been on probation. Another limitation is that this study included only USNWR-ranked colleges and schools; therefore, the findings may be applicable only to the colleges and schools that were ranked by the USNWR and included in our analysis.
Although identifying indicators that should be used in the development of a new ranking system was not 1 of the study objectives, another limitation of the study relating to the selection of variables was the lack of student outcomes data other than NAPLEX pass rates. Many of the variables we used related to incoming students (rather than performance of graduating students and recent graduates), faculty performance, and college or school characteristics.
This study was unique in its methodology to identify predictors of pharmacy school ranking. In contrast, the study by Thompson and Sharp attempted to develop a ranking system based on perception, funding, and publication rankings.11 Their study, published in 2002, was based on 1996 USNWR rankings, in conjunction with NIH awards over a 20-year time frame (1981-2000) and publications per college per year over a 22-year period (1976-1997). No other studies were found to predict pharmacy school quality measures, and no studies were found in English language journals evaluating ranking of medical or dental schools.
In fall 2011, USNWR administered its peer-assessment survey instrument to colleges and schools of pharmacy in order to provide new rankings for 2012. Although this study was initiated before the release of the 2012 rankings, we opted to use the 2008 rankings rather than waiting for the 2012 rankings. We made this decision because of a change in the USNWR ranking methodology for 2012 and because there would be a delay in data availability. For 2012, USNWR changed its earlier policy of ranking only fully accredited colleges and schools to ranking programs with full accreditation, candidate status, or precandidate status. In particular, 2012 rankings of newer institutions represent the reputation of the parent institution, not the pharmacy college or school. Additionally, data associated with many variables used in this study were not available for 2011, such as NIH rankings, or until full accreditation was achieved, such as NAPLEX pass rates.
CONCLUSION
The scholarly productivity of colleges and schools of pharmacy appears to be the characteristic most associated with US News and World Report rankings. Other characteristics found to predict mean ranking score were affiliation with an academic health center, student-to-faculty ratio, and the number of years since a college or was established. Until the USNWR further advances its methodology on ranking pharmacy colleges and schools, the findings of this study can be used to educate institution stakeholders regarding the characteristics that most significantly influence rankings and whether those characteristics align with the institution’s mission.
Appendix 1.
Characteristics of Schools and Colleges of Pharmacy Ranked in US News and World Report (2008) and Included in Final Analysis of the Current Study
REFERENCES
- 1.Confessore N. What makes a college good? Atlantic Magazine Web site. 2003 http://www.theatlantic.com/magazine/archive/2003/11/what-makes-a-college-good/2814/. Accessed January 12, 2012. [Google Scholar]
- 2.Morse R, Flanigan S. Methodology: Graduate health rankings. US News & World Report Web site. http://usnews.com/education/best-graduate-schools/articles/2011/03/14/health-rankings-methodology-2012. Accessed December 6, 2011. [Google Scholar]
- 3.Pryor JH, Hurtado S, Saenz VB, Korn JS, Santos JL, Korn WS. The American Freshman: National Norms for Fall 2006. Los Angeles: Higher Education Research Institute, UCLA; 2006. Available at: http://heri.ucla.edu/PDFs/06CIRPFS_Norms_Narrative.pdf. Accessed September 18, 2012.
- 4.Jaschik S. Battle lines on ‘U.S. News.’ Inside Higher Ed Web site. 2007 http://www.insidehighered.com/news/2007/05/07/usnews. Accessed September 19, 2012. [Google Scholar]
- 5.Ascione FJ. In pursuit of prestige: the folly of the US News and World Report survey. Am J Pharm Educ. 2012;76(6):Article 103. doi: 10.5688/ajpe766103. [DOI] [PMC free article] [PubMed] [Google Scholar]
- 6.Sayre C. “Medical school deans take on the rankings.” US News & World Report Web site. 2011 http://www.usnews.com/education/best-graduate-schools/top-medical-schools/articles/2011/11/10/medical-school-deans-take-on-the-rankings. Accessed September 19, 2012. [Google Scholar]
- 7.NAPLEX®Passing Rates for First-time Candidates per Pharmacy School from 2007 to 2011. National Association of Boards of Pharmacy. http://www.nabp.net/programs/assets/NAPLEX%20passing%20rates.pdf. Accessed March 7, 2013. [Google Scholar]
- 8.College rankings and college choice: how important are college rankings in students’ college choice process? Vol. 2007. Los Angeles: Higher Education Research Institute, UCLA; http://www.heri.ucla.edu/PDFs/pubs/briefs/brief-081707-CollegeRankings.pdf. Accessed February 1, 2012. [Google Scholar]
- 9.Bowman NA, Bastedo MN. Getting on the front page: organizational reputation, status signals, and the impact of the US News and World Report on student decisions. Res High Educ. 2009;50(5):415–436. [Google Scholar]
- 10.Morse R, Flanigan S. How US News calculates the college rankings. US News & World Report Web site. http://www.usnews.com/education/best-colleges/articles/2011/09/12/how-us-news-calculates-the-college-rankings-2012. Accessed January 12, 2012. [Google Scholar]
- 11.Thompson DF, Sharp RP. Ranking of US pharmacy schools based on perception, funding, and publications. Ann Pharmacother. 2002;36(9):1477–1478. doi: 10.1345/aph.1C020. [DOI] [PubMed] [Google Scholar]