

Abstract
OBJECTIVE
Zinc-α2-glycoprotein (ZAG) has been proposed to play a role in the pathogenesis of insulin resistance. Previous studies in humans and in rodents have produced conflicting results regarding the link between ZAG and insulin resistance. The objective of this study was to examine the relationships between ZAG and insulin resistance in cross-sectional and interventional studies.
RESEARCH DESIGN AND METHODS
Serum ZAG (determined with ELISA) was compared with various parameters related to insulin resistance in subjects with normal glucose tolerance, impaired glucose tolerance (IGT), and newly diagnosed type 2 diabetes mellitus (T2DM), and in women with or without polycystic ovary syndrome (PCOS). Euglycemic-hyperinsulinemic clamps were performed in healthy and PCOS women. Real-time RT-PCR and Western blotting were used to assess mRNA and protein expression of ZAG. The effect of a glucagon-like peptide-1 agonist on ZAG was studied in a 12-week liraglutide treatment trial.
RESULTS
Circulating ZAG was lower in patients with IGT and newly diagnosed T2DM than in controls. Circulating ZAG correlated positively with HDL cholesterol and adiponectin, and correlated inversely with BMI, waist-to-hip ratio, body fat percentage, triglycerides, fasting blood glucose, fasting insulin, HbA1c, and homeostasis model assessment of insulin resistance (HOMA-IR). On multivariate analysis, ZAG was independently associated with BMI, HOMA-IR, and adiponectin. ZAG mRNA and protein were decreased in adipose tissue of T2DM patients. Moreover, circulating ZAG levels were lower in women with PCOS than in women with high insulin sensitivity. Liraglutide treatment for 12 weeks significantly increased circulating ZAG levels.
CONCLUSIONS
We conclude that ZAG may be an adipokine associated with insulin resistance.
Adipose tissue is recognized as an active endocrine organ producing proteins (adipokines), such as adiponectin (ADI), that modulate insulin sensitivity and thus can play a role in the pathogenesis of insulin resistance, diabetes, and atherosclerosis (1–4).
Zinc-α2-glycoprotein (ZAG) is a secreted soluble protein that has been found in plasma and is expressed in several human tissues, including subcutaneous and visceral adipocytes (5,6). ZAG has a molecular mass of 41 kDa (7). Its name is derived from its tendency to precipitate with zinc and from its electrophoretic migration in the region of α2-globulins. A plethora of biological functions have been ascribed to ZAG, including a role in the immune response and in the inhibition of tumor proliferation (8,9). Furthermore, studies in ZAG-deficient mice have suggested that ZAG contributes to the control of body weight and lipolysis (10). ZAG mRNA and protein expression are downregulated in adipose tissue of ob/ob mice that have decreased circulating ZAG levels (11). Furthermore, treatment with purified ZAG caused a reduction in body fat in obese and normal weight mice (12,13). In humans, ZAG mRNA levels have been reported to be decreased in fat of obese women (14) and men (6). A recent study in humans has shown expression of ZAG mRNA in visceral and subcutaneous adipose tissue to be negatively correlated with the BMI, plasma insulin, and leptin mRNA (15). Recently, Yeung et al. (16) have demonstrated that serum ZAG correlated positively with triglycerides (TGs) and other components of the metabolic syndrome, suggesting that ZAG could be used as a potential biomarker for risk stratification of cardiovascular disease. However, other studies have failed to find a link between ZAG, insulin resistance, and obesity (17,18). These discrepant findings might be attributable to differences in study design, patient selection, sample size, and methodological problems. In addition, little is known about the regulation of ZAG in humans. Therefore, we have evaluated serum ZAG levels in normal glucose-tolerant (NGT) subjects, in patients with impaired glucose tolerance (IGT), in patients with newly diagnosed type 2 diabetes (nT2DM), and in young women with or without insulin resistance. We also have evaluated the effects of an oral glucose challenge, hyperinsulinemia, and liraglutide on circulating ZAG. Finally, we have examined ZAG mRNA and protein expression in fat and muscle of nondiabetic and T2DM subjects.
RESEARCH DESIGN AND METHODS
Cross-sectional studies
Studies with NGT, IGT, and diabetic subjects.
One hundred patients with nT2DM (nT2DM group), 85 subjects with IGT (IGT group), and 100 healthy controls were studied. The diagnoses of IGT and T2DM were based on oral glucose tolerance tests (OGTT) and World Health Organization 1998 diagnostic criteria (19). The subjects with T2DM or IGT were not treated with hypoglycemic agents or insulin. Excluded were type 1 diabetic patients and patients with macrovascular or microvascular complications, liver cirrhosis, congestive heart failure, or other major diseases. Healthy controls were recruited from subjects who underwent routine medical check-ups. These subjects had fasting plasma glucose levels <6.1 mmol/L and a 2-h OGTT glucose level <7.8 mmol/L, had no family history of T2DM, and were not using medications known to affect glucose tolerance.
Study of insulin-resistant and noninsulin-resistant women.
We also studied 15 women with normal insulin sensitivity and 15 women with polycystic ovarian syndrome (PCOS). The diagnosis of PCOS was based on all three criteria of the revised 2003 Rotterdam European Society of Human Reproduction and Embryology (ESHRE)/American Society of Reproductive Medicine (ASRM) PCOS Consensus Workshop Group diagnostic criteria. The three criteria are oligo-ovulation or anovulation, clinical or biochemical signs of hyperandrogenism, and polycystic ovaries (20) after exclusion of other known causes of hyperandrogenemia and ovulatory dysfunction. All control subjects had a normal menstrual cycle, and none had clinical or biochemical hyperandrogenism. Exclusion criteria for both groups included the use of hormones and medications that affect insulin sensitivity within the past 3 months. The study was approved by the Human Research Ethics Committee of Chongqing Medical University, and informed consent was obtained from all patients and controls.
Interventional studies
OGTT. After an 8- to 10-h overnight fast, OGTT was performed in 30 healthy subjects with normal weight (17 women and 13 men) who were recruited from the cross-sectional study (NGT group). These subjects ingested, in <5 min, 75 g glucose according to the World Health Organization guidelines, and venous blood was collected before (time 0) and at 30, 60, and 120 min after glucose ingestion for further analyses. Blood was immediately centrifuged, and the serum was separated and stored at −80°C for measurement of glucose, insulin, ZAG, and ADI.
Euglycemic-hyperinsulinemic clamps.
Euglycemic-hyperinsulinemic clamps (EHCs) were performed in 15 young women with PCOS and in 15 healthy women aged from 18 to 34 years. All had regular menstrual cycles and were studied during the follicular phases, as previously described (21). Briefly, after an overnight fast, an intravenous catheter was placed in an antecubital vein to infuse insulin and glucose. Another catheter was placed retrograde in the dorsal vein of the contralateral hand for blood withdrawal. Regular human insulin (1 mU/kg/min) was infused for 2 h and a variable rate infusion of 20% glucose was administered to maintain euglycemia. The rate of glucose disposal was defined as the glucose infusion rate during the stable period of the clamp. During the clamp, blood samples for ZAG and ADI measurements were obtained at 0, 80, and 120 min.
Liraglutide treatment.
Twenty patients from the nT2DM group (10 men and 10 women; age 55.4 ± 9.9 years) received either subcutaneous liraglutide (1.2 mg/day, n = 10) or placebo (n = 10) injections once daily for 12 weeks. Inclusion criteria were age 40–75, BMI 20–40 kg/m2, and hemoglobin A1c (HbA1c) levels between 6.5% and 9.0%. Subjects with three consecutive fasting blood glucose (FBG) values >13.3 mmol/L were withdrawn from the study. Participants provided written informed consent before the trial. Fasting blood samples for ZAG and ADI measurements were obtained at 0800 h (pretreatment) on day 2 of the last admission.
Human tissue studies
Muscle and fat biopsies were performed in 10 patients with T2DM (4 men and 6 women; age 52.4 ± 10.2 years; BMI, 25.40 ± 6.51 kg/m2) and in 10 healthy controls (5 men and 5 women; age 51.6 ± 9.7 years; BMI, 24.70 ± 5.60 kg/m2). On the day of the study, under anesthesia, an incision was made through the skin at the lateral aspect of the upper thigh and ∼200 mg of subcutaneous adipose tissue and muscle were mobilized and excised. The excised fat and muscle samples were dropped immediately into isopentane and kept at the freezing point (−160°C) by liquid nitrogen until being used for RNA and protein extraction.
Measurements of plasma adipokines
Serum ZAG concentrations were determined with an ELISA obtained from Ray Biotech following the manufacturer’s protocol. The limit of detection was 0.02 μg/mL, and intra-assay and interassay variations were 2.56% and 6.63%, respectively. Serum ADI level was measured with an ELISA from Adipobiotech (22).
Anthropometric and biochemical measurements
Anthropometric and body composition measurements were performed in all study participants before breakfast. BMI was calculated as weight divided by height squared. Waist circumference and hip circumference were measured by the same observer to the nearest 0.1 cm for calculation of the waist-to-hip ratio (WHR). The homeostasis model assessment of insulin resistance (HOMA-IR) and HOMA of insulin secretion (HOMA- IS) were calculated using the following equations (23): HOMA-IR = fasting insulin (μU/mL) × FBG (mmol/L)/22.5, and HOMA-IS = 20 × fasting insulin (μU/mL)/FBG (mmol/L) – 3.5. Plasma glucose and HbA1c were measured by the glucose-oxidase method and anion exchange high-performance liquid chromatography, respectively. Insulin was measured by radioimmunoassay using human insulin as standard (Institute of Atomic Energy, China). Free fatty acid was measured with a commercial kit (Randox Laboratories, Antrim, U.K.). Total cholesterol, HDL cholesterol, LDL cholesterol, and TG were analyzed enzymatically using an autoanalyzer (Hitachi, Tokyo, Japan). Testosterone, luteinizing hormone, progesterone, follicular-stimulating hormone, and 17β-estradiol were determined by specific chemiluminescence assays (automated Elecsys 2010 immunoanalyzer; Roche Diagnostics GmbH, Mannheim, Germany).
Analysis of mRNA expression
Total RNA was isolated from frozen muscle or fat (100 mg) using Trizol reagent (Invitrogen, Carlsbad, CA) according to the manufacturer’s instructions. After treatment with DNase I (Invitrogen), purified RNA was used as a template for first-strand cDNA synthesis using SuperScript III (Invitrogen). Quantitative real-time RT-PCR was performed using LC-Fast Start DNA SYBR Green I chemistry (Roche Diagnostics) on a LightCycler 2.0 platform (Roche Diagnostics). Gene expressions were analyzed using the comparative threshold cycle (Ct) method in relation to the levels of the β-actin. The sequences for ZAG were: sense, 5′-AGGGAAGGTTTGGTTGTG-3′ and antisense, 5′-G GCTGGGATTTCTTTGTT-3′.
Western blot analyses
Muscle and fat were homogenized in 20 mmol/L MOPS, 2 mmol/L EGTA, 30 mmol/L sodium fluoride, 40 mmol/L β-glycerophosphate, 10 mmol/L sodium pyrophosphate, 2 mmol/L orthovanadate, 0.5% NP-40, and complete phosphatase inhibitor cocktail (Roche). Protein concentration was measured with a BCA protein quantification kit (Pierce Biotechnology). Tissue extracts (70 μg) were separated by SDS-polyacrylamide gel electrophoresis and transferred to polyvinylidene fluoride membranes in a transfer buffer containing 20 mmol/L Tris, 150 mmol/L glycine, and 20% methanol. Immunoblots were then blocked in Tris-buffered saline containing 0.1% Tween-20 and 5% skimmed milk overnight at 4°C and incubated with primary ZAG antibody (1:200 dilution; Santa Cruz Biotechnology) and β-actin (1:500 dilution; Research Diagnostics) for 2 h at room temperature. After three consecutive 5-min washes in Tris-buffered saline with Tween, blots were incubated with horseradish peroxidase–conjugated secondary antibody (1:500 dilution; Invitrogen) for 1 h at room temperature. The blots were scanned using the Odyssey Infrared Imaging System (LI-COR Biosciences) and quantification of antigen–antibody complexes was performed using Quantity One analysis software (Bio-Rad).
Statistical analysis
All analyses were performed with SPSS version 15.0 (SPSS, Chicago, IL). Data are expressed as mean ± SE. Normal distribution of the data was tested using Kolmogorox-Smirnov test. Several variables were skewed and logarithmically transformed to obtain a normal distribution. Comparisons between groups were performed with general linear model with adjustment for covariates or Student t test. Correlations between variables were assessed using Pearson correlation analyses by controlling for the covariates. Multiple linear regression was performed to determine variables that had independent associations with serum ZAG, and included were all varia bles with significant associations or correlations with serum ZAG and those with possible biological relevance. The trends of ZAG levels associated with IGT and T2DM were analyzed using the Cochran-Armitage trend test. P < 0.05 was considered significant.
RESULTS
Circulating ZAG levels and their association with anthropometric and biochemical parameters in NGT, IGT, and nT2DM
Table 1 summarizes the demographic, anthropometric, and metabolic parameters of the 285 middle-aged subjects enrolled in the cross-sectional study. Serum ZAG levels were significantly lower in men (n = 153; 46.32 ± 19.59 mg/L) than in women (n = 132; 50.88 ± 16.69 mg/L; P < 0.05; Fig. 1A). Furthermore, overweight or obese subjects (BMI ≥25 kg/m2) had significantly lower circulating ZAG levels than lean individuals (BMI <25 kg/m2; NGT 54.5 ± 16.1 vs. 61.1 ± 16.0 mg/L; IGT 41.7 ± 15.0 vs. 53.68 ± 19.58 mg/L; nT2DM 33.0 ± 12.6 vs. 42.0 ± 12.4 mg/L; P < 0.05 or P < 0.01; Fig. 1B). These differences remained statistically significant after age adjustment (P < 0.01). Significantly lower serum concentrations of ZAG also were observed in subjects with nT2DM or IGT compared with NGT subjects (both P < 0.01; Table1), and in nT2DM compared with IGT patients (P < 0.01; Fig. 1C). These differences remained significant after adjustment for age, BMI, and sex. Similar results were observed in circulating ADI (Table 1). We next investigated the relationship of circulating ZAG with various other parameters. Serum ZAG correlated positively with HDL cholesterol and correlated negatively with BMI, WHR, percentage of body fat, diastolic blood pressure, TG, FBG, fasting insulin, HbA1c, and HOMA-IR. In addition, we observed strong positive correlations of serum ZAG with circulating ADI (Supplementary Table 1). All these correlations remained statistically significant after adjustment for age. Last, we performed multiple stepwise regressions to determine variables that had independent associations with circulating ZAG. The results showed that only BMI, diastolic blood pressure, HOMA-IR, and ADI were independently related factors with circulating ZAG (Supplementary Table 1). The multiple regression equation was: YZAG = 96.289 − 3.218 XHOMA-IR − 1.217 XBMI − 0.22 Xdiastolic blood pressure + 0.254Xadiponectin.
Table 1.
Main clinical features and plasma ZAG levels in NGT, IGT, and T2DM groups
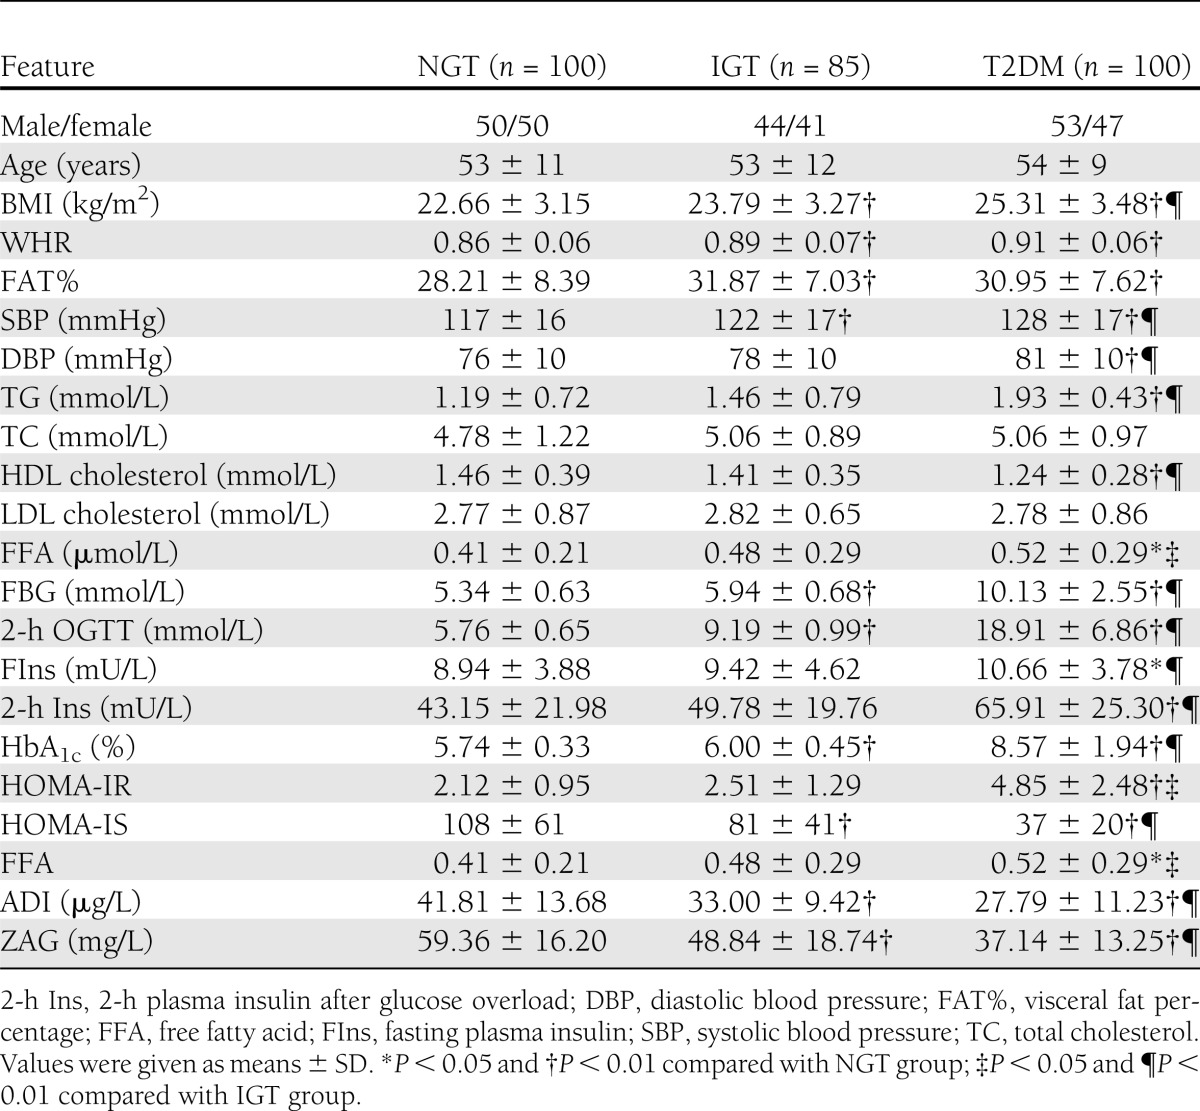
Figure 1.

Circulating ZAG level in study population. A: Circulating ZAG levels according to sex (n = 132 females and 153 males). B: Circulating ZAG levels according to BMI subgroups (normal weight BMI <25 kg/m2 and overweight/obese BMI ≥25 kg/m2 vs. normal weight; *P < 0.05 and **P < 0.01 vs. NGT ▲P < 0.05 and ▲▲P < 0.01 vs. IGT #P < 0.05). C: Circulating ZAG levels according to NGT, IGT, and nT2DM (vs. NGT *P < 0.01 and vs. IGT ▲P < 0.01). Values were given as means ± SD.
Circulating ZAG levels also were significantly correlated with IGT and T2DM, even after controlling for anthropometric variables, blood pressure, lipid profile, age, sex, BMI, WHR, percentage of body fat, and FBG (all P < 0.01; Supplementary Table 2). Increasing levels of ZAG showed a significant linear trend and were independently associated with IGT and T2DM, especially when concentrations were analyzed by row mean scores difference and the Cochran-Armitage trend test (Supplementary Table 3).
mRNA expression and protein levels of ZAG in muscle and adipose tissue of subjects with NGT and nT2DM
To determine whether ZAG mRNA and protein expression in muscle and in fat were altered in human insulin resistance, we performed real-time RT-PCR and Western blotting analysis in muscle and adipose tissue biopsy samples obtained from 10 healthy and 10 nT2DM subjects. As shown in Fig. 2A–D, ZAG protein expression in adipose tissues was markedly higher than in skeletal muscle, suggesting that adipose tissue seems to be an important contributor to ZAG systemic levels. In addition, ZAG mRNA expression was lower in adipose tissues from nT2DM patients than controls (by ~1.5-fold; P < 0.05) (Fig. 2A). Similar to mRNA expression, ZAG protein content in adipose tissues also was decreased in nT2DM patients compared with controls (by ~2.4-fold; P < 0.05) (Fig. 2C).
Figure 2.

Levels of ZAG mRNA and protein in skeletal muscle and adipose tissues from control subjects (n = 10) and patients with T2DM (n = 10). Results were quantified by densitometry, and data are means ± SD. A: ZAG mRNA expression in adipose tissues. B: ZAG mRNA expression in skeletal muscle. C: ZAG protein level in adipose tissues. D: ZAG protein level in skeletal muscle. *P < 0.05 and **P < 0.01 compared with NGT subjects.
Circulating ZAG levels in women with PCOS and low insulin sensitivity and controls with high insulin sensitivity
In a second cross-sectional study, we studied 15 normal-weight women with high insulin sensitivity and 15 women with PCOS and low insulin sensitivity. The mean BMI was 21.64 ± 3.48 kg/m2 for the women with high insulin sensitivity and 26.30 ± 5.51 kg/m2 for the women with PCOS and low insulin sensitivity (P < 0.05). There was no significant difference in age between the two groups (27.40 ± 4.95 vs. 26.40 ± 1.90 years). There were significant differences in glucose tolerance, insulin levels, HOMA-IR, TG, HDL cholesterol, testosterone, and luteinizing hormone (Supplementary Table 4). However, women with PCOS and low insulin sensitivity had significantly lower serum ZAG (37.84 ± 12.47 vs. 61.53 ± 17.92 mg/L; P < 0.01) and ADI (24.17 ± 4.93 vs. 30.78 ± 6.40 mg/L; P < 0.05) compared with women with high insulin sensitivity, and these differences remained statistically significant after age and BMI adjustment. Pearson correlations showed that ZAG did not correlate with sex hormones in women with or without PCOS (data not shown).
Effects of an oral glucose challenge, hyperinsulinemia, and liraglutide on circulating ZAG
To evaluate whether ZAG is affected by elevated glycemia and insulin, we examined the effects of OGTT on circulating ZAG in 30 subjects with NGT. As expected, glucose and insulin concentrations significantly increased at 0.5, 1, and 2 h after an oral glucose challenge (glucose: from 5.39 ± 0.42 to 7.96 ± 1.98, and then to 5.76 ± 0.65 mmol/L; insulin: from 8.94 ± 3.88 to 49.17 ± 18.71, and then to 43.15 ± 21.98 mU/L). Also, as shown in Fig. 3A, in response to OGTT-induced high glucose and insulin levels, serum ZAG gradually decreased from 59.31 ± 20.03 to 47.19 ± 15.12 mg/L in these subjects. ADI peaked at 30 min and returned to baseline after 120 min (Fig. 3B).
Figure 3.

Interventional studies. A: Serum ZAG levels in healthy subjects during OGTT (*P < 0.01 compared with 0 min; n = 30). B: Serum ADI levels in healthy subjects during OGTT (*P < 0.05 vs. 0 min; n = 30). C: Serum ZAG levels in women with PCOS and in healthy women during EHC (*P < 0.01 vs. 0 min; ▲P < 0.01 vs. 80 min; n = 15). D: Serum ADI levels in both PCOS and healthy women during EHC (*P < 0.01 vs. 0 min; n = 30). E: ZAG levels before and after treatment with liraglutide or placebo in nT2DM patients (*P < 0.01 vs. pretreatment). F: ADI levels pretreatment and posttreatment with liraglutide or placebo in nT2DM patients (*P < 0.01 vs. pretreatment). Values are given as means ± SD.
We next asked whether circulating ZAG levels are affected by euglycemic hyperinsulinemia. EHC were performed in 15 women with high insulin sensitivity and 15 women with PCOS and low insulin sensitivity. During the EHC, insulin concentrations were increased from 20.51 ± 8.68 to 90.66 ± 10.97 mU/L in PCOS women, and from 5.32 ± 0.71 to 67.09 ± 8.40 mU/L in the controls. The glucose infusion rates were markedly lower in PCOS women than in the controls (3.82 ± 1.83 vs. 11.07 ± 2.86 mg/kg/min; P < 0.01), indicating insulin resistance in the PCOS women. In response to hyperinsulinemia, serum ZAG levels increased gradually in PCOS subjects (from 37.84 ± 12.47 to 53.28 ± 15.24 mg/L; P < 0.01) and then decreased to 24.98 ± 14.46 mg/L at 120 min (vs. 80 min; P < 0.01; Fig. 3C). ZAG levels in women with high insulin sensitivity decreased nonsignificantly during the EHC. Circulating ADI decreased significantly in women with high insulin sensitivity and tended to decrease in PCOS women during the EHC (Fig. 3D). Finally, we also evaluated whether liraglutide administration affected ZAG levels in nT2DM patients. After 12 weeks of liraglutide treatment, serum ZAG had increased significantly from 32.88 ± 6.26 to 49.53 ± 12.04 mg/L (P < 0.01). By comparison, ZAG levels remained unchanged in the placebo-treated group (35.82 ± 3.41 to 36.27 ± 7.44 mg/L; Fig. 3E). As expected, liraglutide, but not placebo treatment, increased ADI levels in T2DM patients (42.84 ± 5.74 vs. 33.10 ± 10.96 μg/L; P < 0.05; Fig. 3F). Other effects of liraglutide are shown in the Supplementary Table 5.
CONCLUSIONS
ZAG has been considered a new candidate factor involved in the pathogenesis of insulin resistance. However, previous studies in human and rodents have produced conflicting results regarding the link between ZAG, insulin resistance, or obesity (16–18). Therefore, we considered it important to examine in a series of cross-sectional and interventional studies whether ZAG correlates with obesity, insulin resistance, fasting lipid profile, or ADI (another adipocyte-secreted hormone that has important associations with obesity and insulin resistance). In the current study, we found that compared with controls, circulating ZAG levels were lower in those with obesity, IGT, or nT2DM, suggesting that serum ZAG levels may be related to insulin resistance. In previous studies, circulating ZAG levels were found to be elevated or decreased or unchanged in subjects with the metabolic syndrome, obesity, or T2DM (16–18). The discrepant findings between those and our studies might be attributable to differences of the criteria adopted for the definition of the metabolic syndrome or obesity, sample size, and methodological limitations. The reason for the observed reduced ZAG level in obesity, IGT, and nT2DM needs to be further explored in future studies. Moreover, we also found that circulating ZAG level correlated significantly with adiposity (WHR and BMI), fasting insulin, HOMA-IR, dyslipidemia, and glucose metabolism. It is also of interest to note that ZAG levels in females were higher than in males. A possible explanation is that this protein may have sex-specific activity or regulation, or because of other factors, including higher body fat percentage, in women that might lead to changes. Further studies are needed to address this issue. In the current study, we also observed strong positive correlations between circulating ZAG and ADI concentrations in contrast to the study by Yeung et al., who did not observe a significant correlation between serum ZAG and ADI (16). These differences could be attributable to several factors. For instance, in contrast to the study by Yeung et al., our study subjects were not using any blood glucose–lowering medications. Also, only one serum ZAG determination was performed by Yeung et al., which may not have accurately reflected the development over time of a relationship between serum ZAG levels and insulin resistance or obesity.
We also have demonstrated, for the first time, that circulating ZAG was lower in diabetic than in prediabetic (IGT) patients. Furthermore, we compared circulating ZAG in young women with PCOS or high insulin sensitivity and found decreased ZAG levels in women with PCOS. This finding further supported the notion that ZAG might act as a circulating biomarker of adiposity and obesity-related insulin resistance.
Next, we evaluated the effects of an oral glucose challenge on circulating ZAG. We found that during an OGTT, circulating ZAG gradually decreased in response to the glucose challenge. However, this result cannot rule out possible effects of hyperinsulinemia induced by OGTT on ZAG levels. To delineate potential interactions of insulin with ZAG, we performed EHC in 15 subjects with PCOS and in 15 subjects with high insulin sensitivity. Because ∼50% women with PCOS have no insulin resistance, it was necessary to find PCOS women with insulin resistance (by EHC) for comparison with ZAG levels in young women with or without insulin resistance. Furthermore, it was also of interest to investigate whether there are different secretion patterns of ZAG at the euglycemic-hyperinsulinemic state in young women with or without insulin resistance.
During EHC, circulating ZAG in PCOS women was increased at 80 min and then decreased at 120 min, whereas ZAG levels remained unchanged in women with high insulin sensitivity. Because insulin levels were higher in PCOS women than in the controls with high insulin sensitivity, this result leads us to speculate that a certain threshold of insulin levels may be required for its effect on circulating ZAG, so that an elevation of insulin above the threshold in PCOS women is sufficient to induce its inhibitory effect on circulating ZAG.
In an interventional study, we evaluated whether liraglutide, a glucagon-like peptide-1 analogue, would affect ZAG levels in T2DM patients. After 16 weeks of liraglutide treatment, circulating ZAG had increased significantly above baseline, suggesting yet another beneficial effect of liraglutide, a drug known to improve glycemic control and insulin sensitivity. It also was noteworthy that the effect of liraglutide on ZAG was similar to its effect on ADI, an insulin sensitizer, suggesting that ZAG and ADI may be regulated similarly. However, our results do not permit us to conclude that it was a direct effect of liraglutide on circulating ZAG, an indirect effect of the decrease in insulin levels, or improved insulin sensitivity. Thus, further studies will be required to address this issue. Finally, we investigated ZAG mRNA and protein expression in muscle and fat of healthy and T2DM subjects. We found that ZAG protein expression in adipose tissues was markedly higher than in skeletal muscle in normal subjects. However, conflicting results have been presented regarding whether there is a significant contribution of adipose tissue to the circulating ZAG levels. Recently, Selva et al. (17) found a significant positive correlation between ZAG serum levels and mRNA levels of ZAG in adipose tissues. Therefore, they thought that adipose tissue was an important contributor to ZAG systemic levels. More recently, Ryden et al. (24) also have shown that ZAG secretion from adipose tissue increased significantly, whereas serum levels remained unaltered in obese subjects consuming a very low-calorie diet. They concluded that ZAG was released from human adipose tissue, but that this tissue did not contribute significantly to the circulating ZAG levels. However, because only 10 healthy subjects were enrolled in this study, further detailed studies are needed to conclusively address this issue. Here, we also have provided evidence of ZAG expression in human muscle, which suggested that muscle may not be an important contributor to circulating ZAG levels.
Together with its circulating levels, both ZAG mRNA and protein levels were markedly decreased in adipose tissue of T2DM patients. This is consistent with two recent reports that have shown that ZAG mRNA or protein expression was reduced in adipose tissue of mice fed a high-fat diet and ob/ob mice (11,25). However, another study showed that the expression of ZAG was significantly upregulated in KK/Ta mice (26). Whether these differences are attributable to species or to other differences remains to be explored.
In summary, to gain insight into the physiological role of circulating ZAG in humans, we have performed a series of cross-sectional and interventional studies and have determined circulating ZAG levels in groups with varying degrees of glucose tolerance, including NGT, IGT, and nT2DM, and in young women with and without PCOS. We found that ZAG was associated with markers of insulin resistance or obesity and was affected by oral glucose challenge, hyperinsulinemia, and liraglutide. We also found evidence to suggest that adipose tissue may be a primary source of circulating ZAG in humans, and that the downregulation of ZAG expression in adipose tissue may be responsible for the reduced circulating ZAG levels in T2DM patients. Therefore, our findings support the hypothesis that ZAG may be involved in the development of insulin resistance.
Acknowledgments
This work was supported by research grants from the National Natural Science Foundation of China (30871199, 81270913, 81070640, 30971388, and 30771037), Doctoral Fund of Ministry of Education of China (20105503110002), and Natural Science Foundation Key Project of CQ cstc (cstc2012 jjB10022) to G.Y., and by an American Diabetes Association grant (1-10-CT-06 to G.B.).
No potential conflicts of interest relevant to this article were reported.
M.Y., R.L., S.L., Y.L., Y.Z., L.Z., D.L., Y.W., and Z.X. researched data. G.B. reviewed and edited the manuscript. S.C., L.L., and G.Y. researched data and wrote and edited the manuscript. G.Y. is the guarantor of this work and, as such, had full access to all the data in the study and takes responsibility for the integrity of the data and the accuracy of the data analysis.
Footnotes
Clinical trial reg. no. ChiCTR-OCC-11001422, www.chictr.org.
This article contains Supplementary Data online at http://care.diabetesjournals.org/lookup/suppl/doi:10.2337/dc12-0940/-/DC1.
References
- 1.Bloomgarden ZT. Adiposity and diabetes. Diabetes Care 2002;25:2342–2349 [DOI] [PubMed] [Google Scholar]
- 2.Kershaw EE, Flier JS. Adipose tissue as an endocrine organ. J Clin Endocrinol Metab 2004;89:2548–2556 [DOI] [PubMed] [Google Scholar]
- 3.Arner P. Insulin resistance in type 2 diabetes — role of the adipokines. Curr Mol Med 2005;5:333–339 [DOI] [PubMed] [Google Scholar]
- 4.Fantuzzi G. Adipose tissue, adipokines, and inflammation. J Allergy Clin Immunol 2005;115:911–919; quiz 920 [DOI] [PubMed] [Google Scholar]
- 5.Tada T, Ohkubo I, Niwa M, Sasaki M, Tateyama H, Eimoto T. Immunohistochemical localization of Zn-alpha 2-glycoprotein in normal human tissues. J Histochem Cytochem 1991;39:1221–1226 [DOI] [PubMed] [Google Scholar]
- 6.Marrades MP, Martínez JA, Moreno-Aliaga MJ. ZAG, a lipid mobilizing adipokine, is downregulated in human obesity. J Physiol Biochem 2008;64:61–66 [DOI] [PubMed] [Google Scholar]
- 7.Sanchez LM, Chirino AJ, Bjorkman P. Crystal structure of human ZAG, a fat-depleting factor related to MHC molecules. Science 1999;283:1914–1919 [DOI] [PubMed] [Google Scholar]
- 8.Hassan MI, Waheed A, Yadav S, Singh TP, Ahmad F. Zinc α 2-glycoprotein: a multidisciplinary protein. Mol Cancer Res 2008;6:892–906 [DOI] [PubMed] [Google Scholar]
- 9.López-Boado YS, Díez-Itza I, Tolivia J, López-Otín C. Glucocorticoids and androgens up-regulate the Zn-α 2-glycoprotein messenger RNA in human breast cancer cells. Breast Cancer Res Treat 1994;29:247–258 [DOI] [PubMed] [Google Scholar]
- 10.Rolli V, Radosavljevic M, Astier V, et al. Lipolysis is altered in MHC class I zinc-α(2)-glycoprotein deficient mice. FEBS Lett 2007;581:394–400 [DOI] [PubMed] [Google Scholar]
- 11.Mracek T, Gao D, Tzanavari T, et al. Downregulation of zinc-α2-glycoprotein in adipose tissue and liver of obese ob/ob mice and by tumour necrosis factor-α in adipocytes. J Endocrinol 2010;204:165–172 [DOI] [PMC free article] [PubMed] [Google Scholar]
- 12.Hirai K, Hussey HJ, Barber MD, Price SA, Tisdale MJ. Biological evaluation of a lipid-mobilizing factor isolated from the urine of cancer patients. Cancer Res 1998;58:2359–2365 [PubMed] [Google Scholar]
- 13.Bing C, Russell ST, Beckett EE, et al. Expression of uncoupling proteins-1, -2 and -3 mRNA is induced by an adenocarcinoma-derived lipid-mobilizing factor. Br J Cancer 2002;86:612–618 [DOI] [PMC free article] [PubMed] [Google Scholar]
- 14.Dahlman I, Kaaman M, Olsson T, et al. A unique role of monocyte chemoattractant protein 1 among chemokines in adipose tissue of obese subjects. J Clin Endocrinol Metab 2005;90:5834–5840 [DOI] [PubMed] [Google Scholar]
- 15.Mracek T, Ding Q, Tzanavari T, et al. The adipokine zinc-α2-glycoprotein (ZAG) is downregulated with fat mass expansion in obesity. Clin Endocrinol (Oxf) 2010;72:334–341 [DOI] [PubMed] [Google Scholar]
- 16.Yeung DC, Lam KS, Wang Y, Tso AW, Xu A. Serum zinc-α2-glycoprotein correlates with adiposity, triglycerides, and the key components of the metabolic syndrome in Chinese subjects. J Clin Endocrinol Metab 2009;94:2531–2536 [DOI] [PubMed] [Google Scholar]
- 17.Selva DM, Lecube A, Hernández C, Baena JA, Fort JM, Simó R. Lower zinc-α2-glycoprotein production by adipose tissue and liver in obese patients unrelated to insulin resistance. J Clin Endocrinol Metab 2009;94:4499–4507 [DOI] [PubMed] [Google Scholar]
- 18.Stejskal D, Karpísek M, Reutová H, Stejskal P, Kotolová H, Kollár P. Determination of serum zinc-α-2-glycoprotein in patients with metabolic syndrome by a new ELISA. Clin Biochem 2008;41:313–316 [DOI] [PubMed] [Google Scholar]
- 19.Alberti KG, Zimmet PZ. Definition, diagnosis and classification of diabetes mellitus and its complications. Part 1: diagnosis and classification of diabetes mellitus provisional report of a WHO consultation. Diabet Med 1998;15:539–553 [DOI] [PubMed] [Google Scholar]
- 20.Rotterdam ESHRE/ASRM-Sponsored PCOS consensus workshop group Revised 2003 consensus on diagnostic criteria and long-term health risks related to polycystic ovary syndrome (PCOS). Hum Reprod 2004;19:41–47 [DOI] [PubMed] [Google Scholar]
- 21.Li K, Li L, Yang M, et al. Short-term continuous subcutaneous insulin infusion decreases the plasma vaspin levels in patients with type 2 diabetes mellitus concomitant with improvement in insulin sensitivity. Eur J Endocrinol 2011;164:905–910 [DOI] [PubMed] [Google Scholar]
- 22.Tso AW, Sham PC, Wat NM, et al. Polymorphisms of the gene encoding adiponectin and glycaemic outcome of Chinese subjects with impaired glucose tolerance: a 5-year follow-up study. Diabetologia 2006;49:1806–1815 [DOI] [PubMed] [Google Scholar]
- 23.Albareda M, Rodríguez-Espinosa J, Murugo M, de Leiva A, Corcoy R. Assessment of insulin sensitivity and beta-cell function from measurements in the fasting state and during an oral glucose tolerance test. Diabetologia 2000;43:1507–1511 [DOI] [PubMed] [Google Scholar]
- 24.Rydén M, Agustsson T, Andersson J, Bolinder J, Toft E, Arner P. Adipose zinc-α2-glycoprotein is a catabolic marker in cancer and noncancerous states. J Intern Med 2012;271:414–420 [DOI] [PubMed] [Google Scholar]
- 25.Gong FY, Zhang SJ, Deng JY, et al. Zinc-alpha2-glycoprotein is involved in regulation of body weight through inhibition of lipogenic enzymes in adipose tissue. Int J Obes (Lond) 2009;33:1023–1030 [DOI] [PubMed] [Google Scholar]
- 26.Gohda T, Makita Y, Shike T, et al. Identification of epistatic interaction involved in obesity using the KK/Ta mouse as a Type 2 diabetes model: is Zn-α2 glycoprotein-1 a candidate gene for obesity? Diabetes 2003;52:2175–2181 [DOI] [PubMed] [Google Scholar]