

Abstract
OBJECTIVE
To examine whether the patterns of insulin concentration during the oral glucose tolerance test (OGTT) predict type 2 diabetes.
RESEARCH DESIGN AND METHODS
We followed 400 nondiabetic Japanese Americans for 10–11 years. Insulin concentrations at 30, 60, and 120 min during a 2-h 75-g OGTT at baseline were used to derive the following possible patterns of insulin: pattern 1 (30-min peak, higher insulin level at 60 than at 120 min), pattern 2 (30-min peak, lower or equal level at 60 vs. 120 min), pattern 3 (60-min peak); pattern 4 (120-min peak, lower level at 30 than at 60 min), and pattern 5 (120-min peak, equal or higher level at 30 vs. 60 min). Insulin sensitivity was estimated by homeostasis model assessment of insulin resistance (HOMA-IR) and Matsuda index. Insulin secretion was estimated by the insulinogenic index (IGI) [Δinsulin/Δglucose (30–0 min)] and disposition index (IGI/HOMA-IR).
RESULTS
There were 86 incident cases of type 2 diabetes. The cumulative incidence was 3.2, 9.8, 15.4, 47.8, and 37.5% for patterns 1, 2, 3, 4, and 5, respectively. Compared with pattern 1, patterns 4 and 5, characterized by a lasting late insulin response, were associated with significantly less insulin sensitivity as measured by the Matsuda index and lower early insulin response by the disposition index. The multiple-adjusted odds ratios of type 2 diabetes were 12.55 (95% CI 4.79–32.89) for pattern 4 and 8.34 (2.38–29.27) for pattern 5 compared with patterns 1 and 2. This association was independent of insulin secretion and sensitivity.
CONCLUSIONS
The patterns of insulin concentration during an OGTT strongly predict the development of type 2 diabetes.
Type 2 diabetes is characterized by both insulin resistance and β-cell dysfunction (1). The insulin response to intravenous glucose, be it as a hyperglycemic clamp or a bolus injection, is composed of first and second phases (2,3). The acute or first-phase insulin response occurs between 0 and 10 min. However, the intravenous route of glucose administration is not as physiological as oral glucose. The latter results in release of incretins that enhance insulin secretion (4); thus, the oral glucose tolerance test (OGTT) might provide more physiological conditions for estimation of β-cell function than does a test based on intravenous glucose administration.
The insulin response during an OGTT is composed of early and late phases that are influenced by insulin sensitivity (5). Because both insulin sensitivity and insulin response should have varying influences on the patterns of insulin concentration during an OGTT, these patterns might provide important and valuable information for predicting the subsequent incidence of type 2 diabetes. To our knowledge, however, there have been no prospective studies examining this. We therefore characterized the patterns of insulin concentration during an OGTT and examined the relationship of these patterns with the risk of incident type 2 diabetes.
RESEARCH DESIGN AND METHODS
The study population included second- and third-generation Japanese Americans who were between 34 and 76 years of age enrolled in the Japanese American Community Diabetes Study. Details about the selection and recruitment of this study population have been published previously (6,7). Subjects were chosen from volunteers through community-wide recruitment and were representative of Japanese-American residents of King County, Washington, in demographic characteristics such as age, residence, and parental immigration pattern. A comprehensive mailing list and telephone directory that included almost 95% of the Japanese-American population of King County, Washington, was used. All participants were of 100% Japanese ancestry. Subjects returned for follow-up examination 5–6 and 10–11 years after a baseline evaluation.
For the current analysis, we excluded 166 of the 658 subjects in the original cohort because at baseline they had a history of diabetes or were taking oral hypoglycemic medications or insulin or had fasting plasma glucose ≥126 mg/dL or 2-h plasma glucose after a 75-g OGTT ≥200 mg/dL. We excluded an additional 88 persons because of death, loss to follow-up, or withdrawal from the study. We excluded another four persons who completed follow-up but had missing covariate information. Thus, the analytic cohort consisted of 400 persons. The follow-up rate in the current study was 81.3% (400 of 492) at the 10- to 11-year examination.
Data collection
All baseline and follow-up evaluations were performed at the General Clinical Research Center, University of Washington. The protocol for this research was reviewed and approved by the Human Subjects Review Committee at the University of Washington. We obtained signed informed consent from all participants. Blood samples were drawn after an overnight 10-h fast. We classified all subjects as having normal glucose tolerance, prediabetes [impaired fasting glucose (IFG) or impaired glucose tolerance (IGT)], or type 2 diabetes based on a 75-g OGTT and the American Diabetes Association 2003 criteria (8). Diabetes was diagnosed if subjects were taking oral hypoglycemic medications or insulin, if the fasting plasma glucose level was ≥126 mg/dL, or if the 2-h value was ≥200 mg/dL. IGT was diagnosed if subjects had no history of diabetes and if the fasting plasma glucose level was <126 mg/dL but the 2-h value was ≥140 and <200 mg/dL. Prediabetes was defined as follows: isolated IFG–fasting glucose 100 to <126 mg/dL, 2-h glucose <140 mg/dL; isolated IGT–fasting glucose <100 mg/dL, 2-h glucose 140 to <200 mg/dL; and combined IFG– and IGT–fasting glucose 100 to <126 mg/dL and 2-h glucose 140 to <200 mg/dL. Subjects with fasting plasma glucose <100 mg/dL and 2-h OGTT value <140 mg/dL were included in the normal glucose tolerance category. We classified subjects as type 2 diabetic if they met the above criteria at the follow-up examination at 5–6 or 10–11 years.
Plasma glucose was assayed by an automated glucose oxidase method and plasma insulin by radioimmunoassay as previously described (9). Insulin sensitivity as a measure of basal insulin sensitivity during an OGTT was estimated by using homeostasis model assessment of insulin resistance (HOMA-IR), calculated as [fasting glucose (mg/dL)] × [fasting insulin (μU/mL)]/405 (10). Insulin sensitivity as a measure of basal and stimulated insulin sensitivity during an OGTT was estimated by the Matsuda index: 10,000/square root of [fasting glucose (mg/dL) × fasting insulin (μU/mL)] × [mean glucose (mg/dL) × mean insulin (μU/mL) during an OGTT] (mean glucose and insulin calculated using the trapezoidal rule) (11,12). Early insulin response during an OGTT was estimated as the insulinogenic index, [Δinsulin (30–0 min)/Δglucose (30–0 min)], and the disposition index of the early phase during an OGTT, [Δinsulin (30–0 min)/Δglucose (30–0 min)]/HOMA-IR (5,13). The disposition index provides a measure of β-cell function adjusted for insulin sensitivity (5,13). BMI was calculated as the weight in kilograms divided by the square of height in meters. Family history of diabetes was deemed positive if any first-degree relative had diabetes.
Insulin concentrations during the OGTT at baseline were used to define the following possible patterns (Fig. 1): pattern 1, peak of insulin during an OGTT at 30 min and higher insulin level at 60 vs. 120 min; pattern 2, peak of insulin at 30 min and lower or equal insulin level at 60 vs. 120 min; pattern 3, peak of insulin at 60 min; pattern 4, peak of insulin at 120 min and lower insulin level at 30 vs. 60 min; and pattern 5, peak of insulin at 120 min and higher or equal insulin level at 30 vs. 60 min. If two equal peaks occurred during the OGTT, the earlier occurrence was designated as the peak time.
Figure 1.
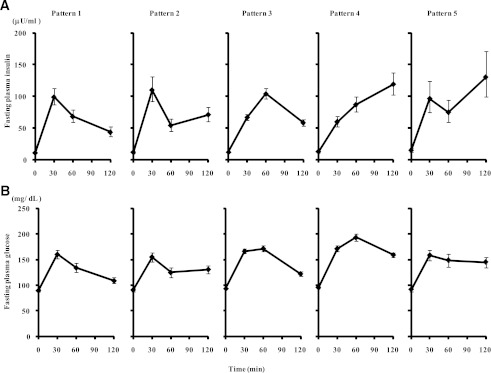
A: Insulin concentration patterns during an OGTT (geometric means [95% CI]): pattern 1, peak of insulin during an OGTT at 30 min and insulin levels at 60 min greater than those at 120 min; pattern 2, peak of insulin at 30 min and insulin levels at 60 min less or equal to those at 120 min; pattern 3, peak of insulin at 60 min; pattern 4, peak of insulin at 120 min and insulin levels at 30 min lower than those at 60 min; and pattern 5, peak of insulin at 120 min and insulin levels at 30 min greater or equal to those at 60 min. B: Plasma glucose pattern during an OGTT for each of these insulin patterns (means [95% CI]).
Statistical analysis
Baseline characteristics of subjects by insulin concentration patterns were compared using ANOVA with Dunnett’s test for multiple comparisons for continuous variables or logistic regression analysis for categorical variables. In both analyses, the reference category was pattern 1 (Fig. 1). Data that were not normally distributed were log transformed to achieve normal distribution before ANOVA tests were performed.
We used multiple logistic regression analysis to estimate the odds ratio for incidence of type 2 diabetes in relation to insulin concentration patterns after adjustment for baseline covariates. Nonlinear effects of continuous independent variables were evaluated by categorizing a continuous variable into quintiles and visually assessing a scatterplot of each variable’s coefficient in the multiple logistic regression models against the median value of each class of dichotomous variables (14). Nonlinear effects of continuous independent variables were also evaluated using quadratic, square root, and log transformations, which were tested in logistic regression models to determine whether these improved the fit of the linear models. The presence of effect modification was tested by the insertion of first-order interaction terms into appropriate regression models. Multicollinearity was assessed by using the generalized variance inflation factor (VIF) (15,16). A VIF >10 is regarded as indicating serious multicollinearity, and values >5.0 may be a cause for concern (15). We calculated the 95% CI for each odds ratio. P values were two tailed. We performed statistical analyses using Stata SE, version 10.0 (Stata, College Station, TX), and R for Windows, version 2.14 (R Development Core Team).
RESULTS
Baseline characteristics of the study subjects
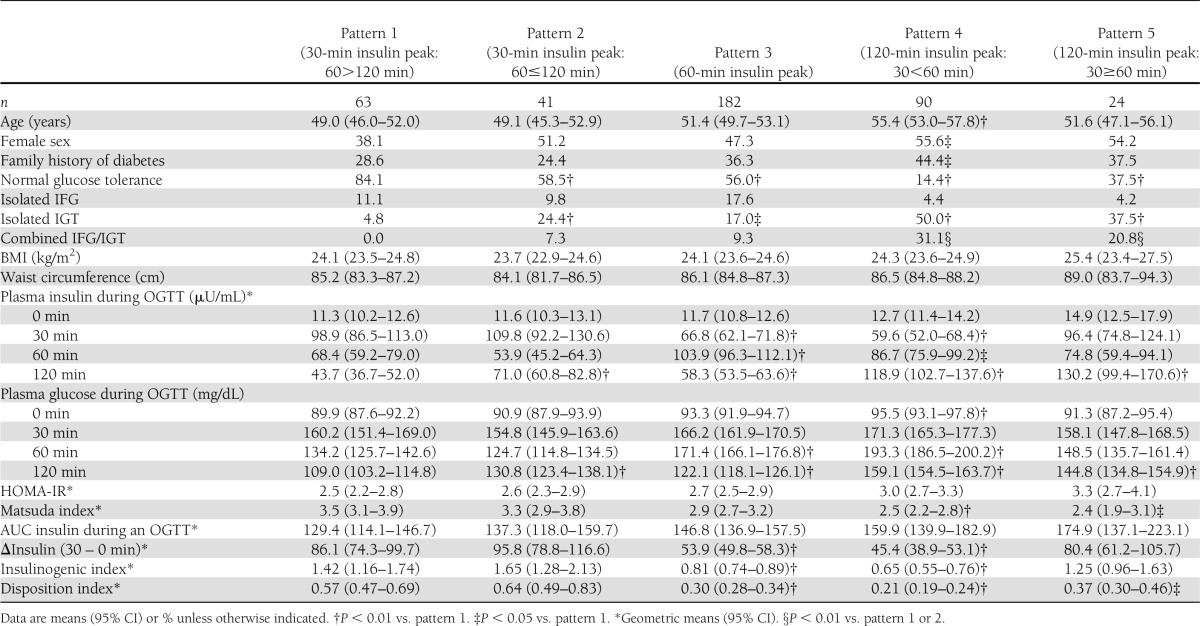
Baseline characteristics of the study subjects according to patterns of insulin concentrations are shown in Table 1. Patterns 4 and 5 had an extremely high prevalence of IGT, both as isolated IGT and combined IGT plus IFG, and low prevalence of isolated IFG. The prevalence of IGT and of isolated IGT by insulin patterns at baseline was as follows: IGT, 4.8, 31.7, 26.3, 81.1, and 58.3% for patterns 1, 2, 3, 4, and 5, respectively; and isolated IGT, 4.8, 24.4, 17.0, 50.0, and 37.5% for patterns 1, 2, 3, 4, and 5, respectively. The prevalence of IFG and isolated IFG by patterns of insulin at baseline were as follows: IFG, 11.1, 17.1, 26.9, 35.5, and 25.0% for patterns 1, 2, 3, 4, and 5, respectively; and isolated IFG, 11.1, 9.8, 17.6, 4.4, and 4.2% for patterns 1, 2, 3, 4, and 5, respectively. Pattern 4 also had the highest proportion of family history of type 2 diabetes. Mean BMI and waist circumference were not significantly different among the five patterns.
Table 1.
Characteristics of study participants at baseline by insulin concentration patterns during OGTT
Insulin sensitivity and concentration during the OGTT
The association between insulin sensitivity and insulin concentrations during the OGTT is shown in Table 1. Patterns 4 and 5 with a lasting late response of insulin had significantly less early insulin response compared with pattern 1. Neither fasting plasma insulin nor HOMA-IR as measures of basal insulin sensitivity was significantly different among the five patterns, although these levels tended to be higher in patterns 4 and 5 compared with pattern 1. On the other hand, the Matsuda index as a measure of basal and stimulated insulin sensitivity was significantly lower in patterns 4 and 5 compared with pattern 1 (P < 0.001 and P = 0.015, respectively). Therefore, patterns 4 and 5 reflect lower insulin sensitivity than pattern 1. Insulinogenic index, reflecting the early insulin response, was significantly lower in patterns 3 (P < 0.001) and 4 (P < 0.001) but not significantly different in pattern 5 (P = 0.869) compared with pattern 1. To further assess the ability of this early insulin response to compensate for differences in insulin sensitivity, we examined the association between the disposition index (insulinogenic index/HOMA-IR) and the five insulin patterns. The disposition index was significantly decreased in pattern 3, 4, and 5 compared with pattern 1 (P < 0.001, < 0.001, and 0.041, respectively).
Insulin concentration patterns and the incidence of type 2 diabetes
Over the 10–11 years of follow-up, there were 86 incident cases of type 2 diabetes: 43 at 5–6 years and 43 between 5–6 and 10–11 years. The total cumulative incidence was 3.2, 9.8, 15.4, 47.8, and 37.5% for patterns 1, 2, 3, 4, and 5, respectively. The cumulative incidence at the 5–6 years’ follow-up examination was 3.2, 2.4, 5.5, 27.8, and 20.8% for patterns 1, 2, 3, 4, and 5, respectively. The cumulative incidence during the next 5 years was 0.0, 7.3, 9.9, 20.0, and 16.7% for patterns 1, 2, 3, 4, and 5, respectively. Logistic regression modeling of diabetes incidence required several transformations of independent variables. Insulinogenic index, HOMA-IR, and disposition index in the models presented in Table 2 did not fulfill the criteria for linearity assumption that the logit of the outcome variable is a linear combination of the independent variables. To account for the nonlinearity of these variables, we fitted models using tertiles of HOMA-IR, insulinogenic index, and disposition index as presented in Table 2. We examined the significance of the first-order interaction terms in all models in Table 2 between insulin concentration patterns and the other variables. None of these interactions were statistically significant.
Table 2.
Odds of incident diabetes by OGTT insulin patterns

We tested a number of regression models to assess the relationship between patterns of insulin concentrations and the incidence of type 2 diabetes (Table 2). After adjustment for age, sex, family history of diabetes, and BMI, these patterns were associated with the subsequent odds of developing type 2 diabetes (model 1) (Table 2). These associations were independent of the early insulin response during an OGTT and basal or basal and stimulated insulin sensitivity (models 2–6) (Table 2). Patterns 4 and 5, characterized by a later insulin peak, diminished early insulin response, and less insulin sensitivity, were associated with higher odds of developing type 2 diabetes than the other patterns. Additional adjustment for the disposition and Matsuda indices (model 5) (Table 2) in place of the insulinogenic index, HOMA-IR, and fasting plasma insulin resulted in generally similar findings showing highest odds of type 2 diabetes associated with patterns 4 and 5. Adjustment for IGT (model 6) (Table 2) resulted in generally similar findings showing highest odds of type 2 diabetes associated with patterns 4 and 5. Adjustment for 2-h glucose instead of IGT resulted in generally similar findings showing highest odds of type 2 diabetes associated with patterns 4 and 5 [odds ratio 3.19 (95% CI 1.00–10.16) and 4.14 (1.03–16.70), respectively]. In all models, fasting plasma insulin, HOMA-IR, or Matsuda index and the insulinogenic or disposition indices were significantly associated with the odds of incident type 2 diabetes (models 2–6). The evidence for multicollinearity was absent, as the generalized VIF for independent variables in all models in Table 2 and the above models was less than five.
To explore whether the pattern of insulin concentration during an OGTT had additional information for the risk of type 2 diabetes beyond IGT, we examined the combined effect of insulin pattern and IGT on the incidence of type 2 diabetes (Table 3). Since there were only three subjects with pattern 1 and IGT, we combined patterns 1 and 2. Likewise, we combined patterns 4 and 5 because there were only 14 subjects with pattern 5 and IGT. In both subjects with IGT and subjects without IGT, insulin patterns were associated with incidence of type 2 diabetes (Table 3). Similarly, we examined the combined effect of insulin pattern and insulin sensitivity or insulin response during an OGTT on the incidence of type 2 diabetes according to HOMA-IR, Matsuda index, or disposition index dichotomized at the median value (Table 3). The pattern of insulin had additional information for the risk of type 2 diabetes beyond HOMA-IR, Matsuda index, or disposition index.
Table 3.
Odds of incident diabetes by OGTT insulin patterns according to subjects characterized by presence or absence of IGT or dichotomized at the median value of HOMA-IR, Matsuda index, 2-h insulin during an OGTT, AUC for insulin during an OGTT, or the disposition index
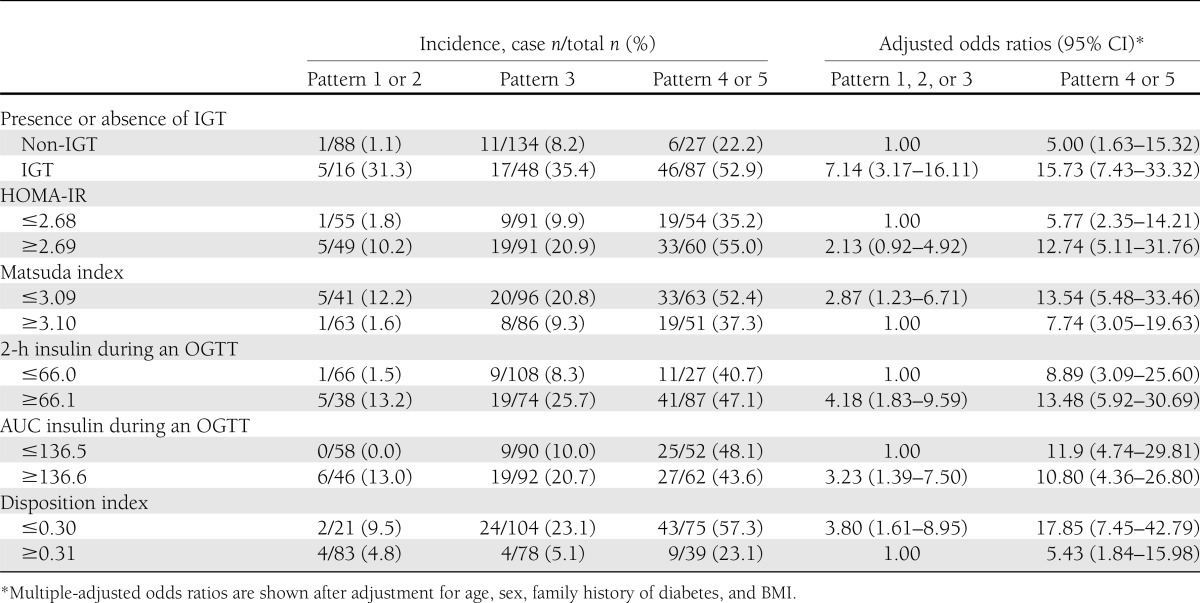
The 2-h insulin and the area under the curve (AUC) for insulin during an OGTT have been reported to be associated with insulin sensitivity (17). Adjustment for 2-h insulin or AUC for insulin during an OGTT in place of fasting plasma insulin, HOMA-IR, or Matsuda index in models 2–4 of Table 2 resulted in generally similar findings showing highest odds of type 2 diabetes associated with patterns 4 and 5 (data not shown). Furthermore, when we examined the effect of insulin pattern on the incidence of type 2 diabetes according to 2-h insulin or AUC for insulin during an OGTT dichotomized at the median value, the pattern of insulin had additional information for the risk of type 2 diabetes beyond 2-h insulin or AUC for insulin (Table 3).
CONCLUSIONS
These prospective data demonstrate that patterns of insulin concentrations during an OGTT are closely associated with the odds of subsequent type 2 diabetes, with later peaks in the insulin levels associated with highest odds as seen in patterns 4 and 5. Despite strong associations between some of these patterns with insulin sensitivity and early secretion as reflected by the Matsuda, insulinogenic, and disposition indices, models adjusted for these measures demonstrated an independent association between OGTT insulin concentration pattern and incident diabetes. This finding argues that these patterns, although associated with both insulin secretion and sensitivity, nevertheless contain additional information pertinent to predicting the subsequent development of type 2 diabetes. These findings were additionally independent of age, sex, family history of diabetes, and BMI at baseline.
Insulin concentration patterns during an OGTT have not been the focus of much prior research. Only a few cross-sectional studies relating insulin secretion patterns to prevalence of IGT or IFG are available (18,19). Abdul-Ghani et al. (18) reported in 319 Mexican-American subjects of the Veterans Administration Genetic Study that the insulin secretion pattern during an OGTT rose progressively from 60 to 120 min in subjects with IGT, while it declined toward baseline after 60 min in those with normal glucose tolerance. Hanefeld et al. (19) reported in the Risk Factor in Impaired Glucose Tolerance for Atherosclerosis and Diabetes Study that subjects with IGT reached their peak level of insulin during an OGTT after 90 min, while those with normal glucose tolerance reached it after 60 min (19). In our study, the prevalence of IGT was higher in patterns 4 and 5, which were characterized by a later insulin concentration peak during an OGTT than patterns 1, 2, or 3. However, not all subjects with IGT had later insulin concentration peaks during an OGTT: namely, 42% of all subjects with IGT had a 30- or 60-min peak of insulin concentration. Furthermore, in both groups with IGT and groups without IGT, later peaks in insulin were associated with higher odds of type 2 diabetes (Table 3). Thus, insulin concentration patterns during an OGTT have additional valuable information with respect to risk of type 2 diabetes. To our knowledge, this is the first prospective study to evaluate the association between patterns of insulin concentrations during an OGTT and the incidence of type 2 diabetes,
We did not examine possible mechanisms underlying the association between patterns of insulin during an OGTT and the risk of future type 2 diabetes beyond the measurements available to us. Both β-cell dysfunction and decreased insulin sensitivity play key roles in the pathogenesis of type 2 diabetes (1). Thus, if insulin sensitivity decreases, insulin secretory response of β cells must increase to preserve normal glucose tolerance. Our results suggest that the pattern of insulin during an OGTT reflects this relationship. Patterns 1, 2, and 3 did not significantly differ with regard to fasting plasma insulin level, HOMA-IR, or Matsuda index, but pattern 3 showed a significantly diminished insulinogenic index and disposition index than patterns 1 and 2, indicating reduced β-cell capacity. Pattern 4 was associated with further deterioration of β-cell function and insulin sensitivity—a combination that resulted in the worst glucose tolerance and risk for diabetes. Pattern 5 was associated with worse insulin sensitivity than pattern 4 and despite more robust β-cell function, risk for diabetes was greater than for pattern 4 in some adjusted models (models 4–6) (Table 2). However, both early β-cell dysfunction and decreased insulin sensitivity did not completely explain the association between insulin patterns and risk of type 2 diabetes because adjustment for fasting plasma insulin, HOMA-IR, or Matsuda index and the insulinogenic or disposition indices did not diminish the significant association between these patterns and the subsequent odds of type 2 diabetes. Thus, this association may also have effects on the incidence of type 2 diabetes through mechanisms unrelated to measures of β-cell function or insulin sensitivity in our study, and further research will be needed to explore this association.
There are some limitations to our study. First, since this study focused on one ethnic group, it remains to be seen whether these associations might also exist in other ethnicities. Second, surrogate measures were used to estimate insulin sensitivity and secretion. Any error that occurred as a result of these indirect measures, however, is likely to be random, as opposed to systematic, thereby biasing study results toward null values (20). Therefore, significant differences probably reflect underestimates of the true effect, although lack of observed differences might also be explained by this random misclassification bias rather than absence of a true effect. Third, we used plasma insulin values at 0, 30, 60, and 120 min during the OGTT to classify subjects according to insulin concentration patterns during an OGTT by its peak time of insulin. A 90-min value might have further improved discrimination regarding degree of odds for future type 2 diabetes. The omission of the 90-min value might have also compromised somewhat the accuracy of our estimates of the Matsuda index, which was originally developed using the 90-min value and the area under the insulin concentration curve.
In conclusion, the current study provides evidence that the insulin concentration pattern during an OGTT serves as a powerful predictor of future type 2 diabetes odds among Japanese Americans. Although many of these patterns were correlated with measures of insulin sensitivity and secretion, they nevertheless showed independent associations with diabetes incidence. The OGTT pattern of insulin concentration therefore might serve as a useful adjunct in the prediction of future type 2 diabetes odds.
Acknowledgments
This work was supported by National Institutes of Health grants DK-31170, HL-49293, and DK-02654; facilities and services were provided by the Diabetes and Endocrinology Research Center (DK-17047), Clinical Nutrition Research Unit (DK-35816), and the General Clinical Research Center (RR-00037) at the University of Washington. T.H. was supported in part by a research grant from the Japanese Ministry of Education, Science, Sports, and Culture (23390177). VA Puget Sound Health Care System provided support for the participation of E.J.B. and S.E.K.
No potential conflicts of interest relevant to this article were reported.
T.H. conceived of the study, analyzed data, and wrote the manuscript. E.J.B. collected and analyzed data and wrote the manuscript. K.K.S. analyzed data and wrote the manuscript. M.J.M., D.L.L., and W.Y.F. collected and assembled data, contributed to the discussion, and reviewed and edited the manuscript. S.E.K. contributed to the discussion and reviewed and edited the manuscript. T.H. and E.J.B. are the guarantors of this work and, as such, had full access to all the data in the study and take responsibility for the integrity of the data and the accuracy of the data analysis.
Parts of this study were presented in abstract form at the 69th Scientific Sessions of the American Diabetes Association, New Orleans, Louisiana, 5–9 June 2009.
The authors gratefully acknowledge the skilled assistance of staff members, especially Jane B. Shofer of the Center for Studies in Demography and Ecology, University of Washington. The authors are grateful to the King County Japanese-American community for their support and cooperation.
References
- 1.Kahn SE. The relative contributions of insulin resistance and beta-cell dysfunction to the pathophysiology of Type 2 diabetes. Diabetologia 2003;46:3–19 [DOI] [PubMed] [Google Scholar]
- 2.DeFronzo RA, Tobin JD, Andres R. Glucose clamp technique: a method for quantifying insulin secretion and resistance. Am J Physiol 1979;237:E214–E223 [DOI] [PubMed] [Google Scholar]
- 3.Korytkowski MT, Berga SL, Horwitz MJ. Comparison of the minimal model and the hyperglycemic clamp for measuring insulin sensitivity and acute insulin response to glucose. Metabolism 1995;44:1121–1125 [DOI] [PubMed] [Google Scholar]
- 4.Creutzfeldt W. The incretin concept today. Diabetologia 1979;16:75–85 [DOI] [PubMed] [Google Scholar]
- 5.Abdul-Ghani MA, Tripathy D, DeFronzo RA. Contributions of beta-cell dysfunction and insulin resistance to the pathogenesis of impaired glucose tolerance and impaired fasting glucose. Diabetes Care 2006;29:1130–1139 [DOI] [PubMed] [Google Scholar]
- 6.Fujimoto WY, Leonetti DL, Kinyoun JL, Shuman WP, Stolov WC, Wahl PW. Prevalence of complications among second-generation Japanese-American men with diabetes, impaired glucose tolerance, or normal glucose tolerance. Diabetes 1987;36:730–739 [DOI] [PubMed] [Google Scholar]
- 7.Fujimoto WY, Bergstrom RW, Leonetti DL, Newell-Morris LL, Shuman WP, Wahl PW. Metabolic and adipose risk factors for NIDDM and coronary disease in third-generation Japanese-American men and women with impaired glucose tolerance. Diabetologia 1994;37:524–532 [DOI] [PubMed] [Google Scholar]
- 8.Genuth S, Alberti KG, Bennett P, et al. Expert Committee on the Diagnosis and Classification of Diabetes Mellitus Follow-up report on the diagnosis of diabetes mellitus. Diabetes Care 2003;26:3160–3167 [DOI] [PubMed] [Google Scholar]
- 9.Boyko EJ, Fujimoto WY, Leonetti DL, Newell-Morris L. Visceral adiposity and risk of type 2 diabetes: a prospective study among Japanese Americans. Diabetes Care 2000;23:465–471 [DOI] [PubMed] [Google Scholar]
- 10.Matthews DR, Hosker JP, Rudenski AS, Naylor BA, Treacher DF, Turner RC. Homeostasis model assessment: insulin resistance and beta-cell function from fasting plasma glucose and insulin concentrations in man. Diabetologia 1985;28:412–419 [DOI] [PubMed] [Google Scholar]
- 11.Matsuda M, DeFronzo RA. Insulin sensitivity indices obtained from oral glucose tolerance testing: comparison with the euglycemic insulin clamp. Diabetes Care 1999;22:1462–1470 [DOI] [PubMed] [Google Scholar]
- 12.DeFronzo RA, Matsuda M. Reduced time points to calculate the composite index. Diabetes Care 2010;33:e93. [DOI] [PubMed] [Google Scholar]
- 13.Utzschneider KM, Prigeon RL, Faulenbach MV, et al. Oral disposition index predicts the development of future diabetes above and beyond fasting and 2-h glucose levels. Diabetes Care 2009;32:335–341 [DOI] [PMC free article] [PubMed] [Google Scholar]
- 14.Katz MH. Multivariable Analysis: A Practical Guide to Clinicians. 2nd ed. New York, Cambridge University Press, 2006, p. 43–46 [Google Scholar]
- 15.Fox J, Monette G. Generalized collinearity diagnostics. J Am Stat Assoc 1992;87:178–183 [Google Scholar]
- 16.Menard SW. An introduction to logistic regression diagnostics. In Applied Logistic Regression Analysis. 2nd ed. London, Sage Publication, 2001, p. 75–78 [Google Scholar]
- 17.Yeni-Komshian H, Carantoni M, Abbasi F, Reaven GM. Relationship between several surrogate estimates of insulin resistance and quantification of insulin-mediated glucose disposal in 490 healthy nondiabetic volunteers. Diabetes Care 2000;23:171–175 [DOI] [PubMed] [Google Scholar]
- 18.Abdul-Ghani MA, Jenkinson CP, Richardson DK, Tripathy D, DeFronzo RA. Insulin secretion and action in subjects with impaired fasting glucose and impaired glucose tolerance: results from the Veterans Administration Genetic Epidemiology Study. Diabetes 2006;55:1430–1435 [DOI] [PubMed] [Google Scholar]
- 19.Hanefeld M, Koehler C, Fuecker K, Henkel E, Schaper F, Temelkova-Kurktschiev T, Impaired Glucose Tolerance for Atherosclerosis and Diabetes study Insulin secretion and insulin sensitivity pattern is different in isolated impaired glucose tolerance and impaired fasting glucose: the risk factor in Impaired Glucose Tolerance for Atherosclerosis and Diabetes study. Diabetes Care 2003;26:868–874 [DOI] [PubMed] [Google Scholar]
- 20.Rothman KJ, Greenland S. Introduction to regression models. In Modern Epidemiology. Philadelphia, Lippincott-Raven, 1998, p. 127–399 [Google Scholar]