

Abstract
Objective
We sought to determine the frequency and type of decision support alerts by location and ordering provider role during Computerized Provider Order Entry (CPOE) medication ordering. Using these data we adjusted the decision support tools to reduce the number of alerts.
Design
Retrospective analyses were performed of dose range checks (DRC), drug-drug interaction and drug-allergy alerts from our electronic medical record. During seven sampling periods (each two weeks long) between April 2006 and October 2008 all alerts in these categories were analyzed. Another audit was performed of all DRC alerts by ordering provider role from November 2008 through January 2009. Medication ordering error counts were obtained from a voluntary error reporting system.
Measurement/Results
Between April 2006 and October 2008 the percent of medication orders that triggered a dose range alert decreased from 23.9% to 7.4%. The relative risk (RR) for getting an alert was higher at the start of the interventions versus later (RR= 2.40, 95% CI 2.28-2.52; p< 0.0001). The percentage of medication orders that triggered alerts for drug-drug interactions also decreased from 13.5% to 4.8%. The RR for getting a drug interaction alert at the start was 1.63, 95% CI 1.60-1.66; p< 0.0001. Alerts decreased in all clinical areas without an increase in reported medication errors.
Conclusion
We reduced the quantity of decision support alerts in CPOE using a systematic approach without an increase in reported medication errors
Keywords: Computerized provider order entry, CPOE, clinical decision support, alert fatigue
Introduction
While it may seem empirically obvious that having alerts programmed in a Computerized Provider Order Entry (CPOE) system would reduce the number of errors during the ordering process it is not clear where the ideal balance between too many and too few alerts should be set. There are also few if any studies describing a systematic methodology to categorize alerts and reduce the frequency of alerts in a pediatric setting covering both inpatient and ambulatory (specialty) clinics using commercially available CPOE and decision support tools. We sought to reduce decision support alerts that display to providers during the CPOE process. We will describe a series of interventions and the corresponding reduction in alerts.
Background
The Institute of Medicine (IOM) report “To Err is Human: Building a Safer Health System” was released in 1999 [1] and spurred a debate in the public and health community on how to improve patient safety. The IOM specifically recommended the use of electronic medication order entry with computerized decision support. Subsequently the Leapfrog group included (CPOE) to their scorecard as a measure of a health care organization’s quality and safety ranking [2]. Fortescue et al. reported in 2003 on a review of over ten thousand inpatient orders that showed an error rate of 5.7% with 74% of these errors occurring in the ordering stage [3]. Their analysis concluded that a great majority of these errors could have been prevented by three strategies, one of which included CPOE with clinical decision support. The reduction of medication errors with CPOE systems has been validated by several inpatient pediatric studies [4-6]. More recently, Leapfrog now includes dose range checking and other decision support features in their 2009 CPOE scorecard.
The use of real time clinical decision support with CPOE systems has been shown to decrease errors in digoxin dosing [7], renal dosing [8], drug laboratory interactions in an ambulatory setting [9], antibiotic selection [10], and in ambulatory ordering in elderly [11]. A meta-analysis showed that CPOE and clinical decision support systems can reduce medical errors but lacked sufficient power to detect improvement in adverse drug events [12]. The authors also pointed out that these studies were performed on home grown systems and not on large commercial applications.
Despite these studies showing improvement in safety during the ordering process several studies reported rates of providers overriding alerts ranging from 50% to over 90% of the time [9, 13-15]. A recent study of the Veteran’s Administration CPOE system by Lin et al. looked at critical drug-drug and drug-allergy alerts and found an override rate of 87% for these important alerts [16]. A similar override rate was found in an analysis of ambulatory prescribing [17]. There is a growing concern about unintended consequences of CPOE including desensitization to alerts or “alert fatigue” [18] or poor signal-to-noise ratio [19]. Efforts to improve the signal-to-noise ratio and appropriateness of alerts have resulted in decreased alert burden but it is not known if the quality of clinical care has improved [20]. There are few if any studies that have looked at strategies to reduce the alerts that occur during the CPOE process.
Research Hypothesis
The frequency of decision support alerts can be systematically reduced over time without increasing the reported rate of errors associated with the CPOE process.
Methods
Setting
Seattle Children’s Hospital (SCH) is the tertiary referral center for pediatric care (0 to 21 years of age) for the states of Washington, Alaska, Montana and Idaho. It also serves as the primary pediatric community hospital for the Seattle area. The hospital is the primary teaching site for pediatrics and pediatric subspecialties for the University of Washington and for other residency programs within Washington State. During the course of the period of this study there were approximately 13,000 inpatient, 38,000 ED, 13,000 surgical and 200,000 ambulatory specialty clinic visits per year.
Software
CPOE was implemented in November of 2003 for all orders on all inpatient units, intensive care units, ED, and the peri-operative areas using the Cerner Millennium system (Kansas City, MO). In January 2006 the Cerner Millennium PharmNet software was implemented which displays alerts to the pharmacist’s verification screens. In June of 2006 the CPOE rollout continued in the subspecialty ambulatory clinics for all orders including take home prescriptions.
The dose range and drug interaction software module (Cerner Multum) was incorporated in each phase of the CPOE implementation. The Multum database came with standard content that could be modified at the system level but not by individual users. Drug doses were checked for under or over dosing based on body weight, body surface area, age, or other standard dosing parameters (e.g route). Drug-drug interaction alerts in Multum were classified as high, medium or low severity. While we do not have access to the Multum classification logic the following examples of high severity drug-drug pairs that result in interaction alerts should be illustrative: selective serotonin reuptake inhibitors and monoamine oxidase inhibitors or enoxaparin and aspirin. Multum did not have disease or provider/role specific dosing or provider specific drug interaction checking modules at the time of this study. SCH also did not use alerts for duplicate medication order checking at the time of this study.
Prior to the 2003 CPOE implementation, SCH customized the Multum dose range tables for 250 of the most frequently used drugs in the SCH formulary. The dose range check (DRC) customizations were designed to fit the formulary of our institution where our formulary was different from the standard age and weight based dosing in Multum. In addition, SCH configured the drug-drug interaction alerts to show only high severity alerts to the ordering providers.
Alert Feedback to Ordering Provider
The DRC system alerted providers for dosing outside of the specified ranges (e.g. dose per kg, body surface area, or age) or for doses for which there were no established dose ranges. The DRC alerts displayed as a pop up window after the order was signed but before the order was transmitted to pharmacy. Providers were given the suggested proper dosing and offered the choice to override the alert, modify the order or cancel the order. If the provider choose to override the alert they then had to select a reason from a menu or choose “other” and enter a free text reason. Example menu choices included: disagree with recommendation; treatment plan requirement; etc. A provider could receive more than one DRC alert per order based on the following sequence:
-
1.
Provider entered order that had a DRC violation and received an alert
-
2.
Provider responded to and modified dose but new dose still violated DRC rule
-
3.
Provider responded to second alert and again either canceled order, modified the order or overrode the alert
A different user feedback display was seen for allergy alerts and drug-drug interaction alerts. The allergy alert was displayed after the order was signed. Drug-drug interaction alerts warned the provider of drug combinations that could have changed the metabolism or biologic effect of the drugs or could have increased side effects of one or both medications. The provider could continue with the order or cancel the order. The system configuration did not allow accurate capture of provider response to the drug-drug or allergy alerts.
Alert Data
Retrospective analyses were performed of all DRC, drug-drug interaction and drug-allergy alerts during seven separate sampling periods: April 6-20, 2006; April 21–May 4, 2006; September 29–October 13, 2006; May 6-20, 2007; August 27–September 10th, 2007; and October 1-14, 2007 and Oct 1-14, 2008. The dates were chosen based on pharmacist availability to extract the data.
The type of alert, location and alert details were pulled into a report for each of the time periods above. Override data were also captured for the DRC alerts. These data were used to quantify the number of alerts, clinical location where the alert occurred and the provider role (e.g. physician, nurse practitioner) in order to assess if there were unique patterns of alerts by location or provider type. In addition, the first 100 alerts in each period were further characterized by one of the authors (RV) into the following four areas:
-
1.
No dose range adjustment possible due to software or knowledge limitations (Examples: dosing interval too long to calculate appropriate cumulative daily dose (e.g. dosing interval greater than 24 hours); or no established dosing in pediatrics)
-
2.
Alert logic not correct (e.g. dosing range logic did not match formulary and clinical practice)
-
3.
Unable to determine (provider cancelled order which does not prompt or record reason for cancelled order) or
-
4.
Legitimate alert due to provider error (provider dosing incorrect for weight, age, route or other error according to formulary standards and clinical practice).
These detailed data were used to make changes to the DRC logic tables (see section “Decision Support Changes” below). All medication orders and DRC alerts for the period November 1st 2008 through January 31st 2009 were analyzed for the type of medication order (acetaminophen, etc) and the order provider role (e.g. attending physician). This sample was specific to DRC alerts. The analysis was used to determine the quantity of alerts by provider type to see if a particular DRC was significantly impacting a specific role and contributing to potential alert fatigue.
Medication Error Data
Medication error data were extracted from a separate voluntary error and complaint reporting database. Any staff could enter data through a secure web portal to report patient safety issues including medication errors. Seattle Children’s encouraged staff to use this system and each year an increased number of reports were logged. The number of complaints and errors increased from 8967 in 2006 to 11,109 in 2009. Medication errors were extracted from this system. Authors (EH, JL) regularly reviewed these data as part of their medication and patient safety roles.
Decision Support Changes
All authors met as a group and reviewed the data for each type of alert and to discuss principles for adjusting the decision support rules. The institutional roles of the authors included the Pediatrician in Chief and Chief Medical Information Officer (MDB), the Pharmacy Quality Manager (EH), the Director of Patient Safety (JL) and the Informatics Pharmacists (RV, KK, WP). After these changes were agreed upon, the informatics pharmacists changed the decision support rules. These same pharmacists were responsible for all aspects for the pharmacy system configuration and worked with the Pharmacy Quality Manager (EH) to assure the online medication formulary recommendations were updated to remain consistent with the CPOE ordering system. Pharmacists spent a total of approximately 160 hours divided as follows: developing the database queries (16 hours); data extraction and analysis (84 hours); adjusting the DRC tables (30 hours); and drug interaction changes (30 hours).
Dose range limits were changed for 287 medications. Example adjustment included increasing the dose range upper limits of normal (e.g. cephalosporin antibiotics), eliminating the lower limit of normal for medications that could be tapered (e.g. steroids, opioids/analgesics, anticoagulants) or allowing a higher variance from the normal dose range (e.g. the variance for both upper and lower range of normal for the drug levetiracetam was increased from 25% to 50%). An additional 74 medications had decisions support rules changed to add, modify or inactivate age, weight or route logic in order to decrease alerts and better match the formulary.
Drug-drug interaction checking changes included downgrading of the drug-drug severity classification for selected medications (e.g between tumor necrosis factor (TNF) blockers and immune-suppressive or myelosuppressive agents or between albuterol and propranolol). The decision to downgrade the drug-drug interaction alerts were made based on the likelihood and severity of a patient safety event if the alert was not present. For example, the providers who ordered TNF and other immunosuppressive agents were either oncologists or transplant providers who were well aware of these interactions and the alert was not going to alter standardized drug treatment protocols. The drug-drug interaction changes are shown in ►Appendix Table 1. Once a drug-drug interaction combination was downgraded from severe to moderate the providers would no longer receive the interaction warning (see Section “Software” above).
Statistical Tests
Relative risks, confidence intervals and p values were obtained using the Center’s for Disease Control EpiInfo software version 6.04.d Stat Calc Chi-square test to determine the statistical difference in alert rates for the sampling periods.
Results
Dose Range Checking Alerts: April 2006 through August 2008 Audits
The number of DRC alerts and percentage of orders that triggered an alert by clinical area are shown on ►Table 1 and ►Figure 1 (insert about here). The percent of medication orders that triggered a DRC alert for all providers plus pharmacists decreased from 23.9% in May of 2006 to 7.4% in October of 2008. Provider alerts decreased from 13.2% to 4.8%.
Table 1.
Dose range checking (DRC) audits
| DRC Audit Time Period | April 2006 | May 2006 | Sept 2006 | May 2007 | Aug 2007 | Oct 2007 | Oct 2008 |
|---|---|---|---|---|---|---|---|
| Number or Percentage of Alerts/Clinical Area | |||||||
| Ambulatory Clinics | 525 | 329 | 1007 | 393 | 367 | 388 | 489 |
| Emergency Department | 189 | 232 | 282 | 130 | 113 | 160 | 98 |
| Inpatient Units | 1276 | 1171 | 1215 | 540 | 670 | 520 | 483 |
| Post Operative Care Unit (PACU) | 236 | 226 | 193 | 67 | 39 | 37 | 118 |
| Pharmacy | 1790 | 1735 | 1273 | 697 | 760 | 567 | 635 |
| Total DRC | 4016 | 3693 | 3970 | 1827 | 1949 | 1672 | 1823 |
| Total Pharmacy Orders | 16,820 | 17,018 | 19,802 | 19,509 | 20,727 | 19,876 | 24,634 |
| % Alerts for Providers/Med Order | 13.2% | 11.5% | 13.6% | 5.8% | 5.7% | 5.6% | 4.8% |
| % Alerts for Pharmacist/ Med Order | 10.6% | 10.2% | 6.4% | 3.6% | 3.7% | 2.9% | 2.6% |
| Total % Alerts/Med Order | 23.9% | 21.7% | 20.0% | 9.4% | 9.4% | 8.4% | 7.4% |
Med = Medication
Fig. 1.
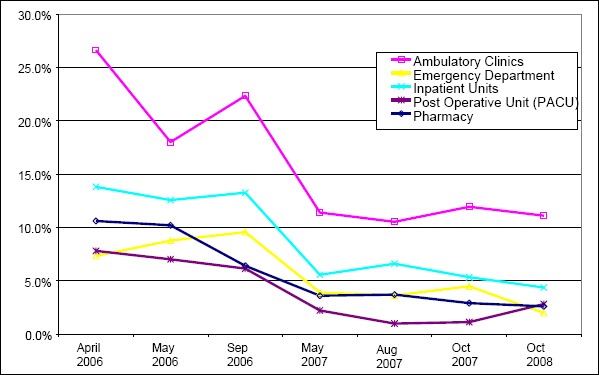
Percent of medication orders with a dose range checking (DRC) alert
The increase in the total number of DRC alerts in the September 2006 data collection period corresponded to the first few months post implementation of CPOE in the ambulatory clinic and mandatory use of the prescription writer in the ambulatory clinics.
In order to compare the early versus later rate of DRC alerts, we examined the first two time periods of 2006 versus the last two time periods (2007 and 2008). This analysis also allowed us to exclude the September 2006 data due to the special cause effect of the ambulatory clinic CPOE implementation. The total number of DRC alerts were significantly lower for each clinical area, providers as a whole, pharmacists as a whole and for all DRC alerts as a whole (►Table 2).
Table 2.
Relative risk of receiving a dosing alert at start of interventions versus later
| DRC Audit Period | Early | Late | Relative Risk (RR) | ||||
|---|---|---|---|---|---|---|---|
| April – May 2006 | October 2007 & 2008 | Early vs. Late | |||||
| Alert | No Alert | Alert | No Alert | RR | 95% CI | P | |
| Ambulatory Clinics | 854 | 2946 | 877 | 6782 | 1.63 | 1.54-1.72 | <0.00001 |
| Emergency Department | 421 | 4807 | 258 | 8262 | 1.69 | 1.58-1.80 | <0.00001 |
| Inpatient Units | 2447 | 16,111 | 1003 | 19,805 | 1.58 | 1.54-1.62 | <0.00001 |
| Post Operative Unit (PACU) | 462 | 5788 | 155 | 7303 | 1.69 | 1.61-1.78 | <0.00001 |
| Pharmacy | 3525 | 30,313 | 1202 | 43,308 | 1.81 | 1.78-1.85 | <0.00001 |
| Total all Prescriber alerts | 4184 | 29,652 | 2293 | 42,152 | 2.40 | 2.28-2.52 | <0.00001 |
| Total all Prescriber and Pharmacy alerts | 7709 | 59,965 | 3495 | 85,460 | 1.67 | 1.65-1.69 | <0.00001 |
DRC = Dose Range Check alert, CI = confidence interval
We further analyzed the reduction in DRC alerts for specific medications by comparing the start of the study period (April 2006) versus later (May 2007). As shown in ►Table 1 the total number of DRC alerts in the Inpatient, Emergency, PACU and Ambulatory settings was 2226 in April 2006 versus 1130 during May 2007. In the April 2006 audit there were 66 medications that had at least ten alerts versus 33 medications in the May 2007 audit period. Similarly there were nine medications with greater than 40 alerts in the April audit versus only one in the May 2007 audit. The ten most frequent DRC alerts in April 2006 all showed significant decreases in alerts by May of 2007 (►Table 3).
Table 3.
Top 10 dose range checking (DRC) alerts – April 2006
| Medication | April 2006 Audit | May 2007 Audit |
|---|---|---|
| Morphine | 137 | 14 |
| Acetaminophen | 107 | 23 |
| Lorazepam | 91 | 20 |
| Ondansetron | 81 | 27 |
| Lanzoprazole | 47 | 10 |
| Metoclopramide | 45 | 2 |
| Tacrolimus | 41 | 14 |
| Amoxicillin-Clavulanate | 40 | 12 |
| Diazepam | 40 | 13 |
| Levothyroxine | 38 | 5 |
Comparison for top 10 medications to trigger a DRC in April 2006 audit and subsequent alerts for same medications in May 2007 audit.
The percent of DRC alerts where the provider overrode the alert was high in all settings and did not change during the time period (►Table 4).
Table 4.
Override rates for dose range checking (DRC) alerts
| DRC Audit Period | April 2006 | May 2006 | Sept 2006 | May 2007 | Aug 2007 | Oct 2007 | Oct 2008 |
|---|---|---|---|---|---|---|---|
| Override Percent | |||||||
| Ambulatory Clinics | 85.5% | 82.7% | 89.6% | 88.0% | 81.7% | 89.4% | 87.1% |
| Emergency Department | 79.9% | 77.2% | 75.2% | 82.3% | 79.6% | 70.6% | 75.5% |
| Inpatient Units | 85.5% | 83.3% | 84.0% | 86.5% | 83.6% | 84.8% | 86.5% |
| Post Operative Care Unit (PACU) | 65.7% | 73.0% | 83.4% | 74.6% | 79.5% | 54.1% | 66.9% |
DRC Alerts by Provider Role and Medication: November 2008 through January 2009 Audits
During the time period of November 2008 through January 2009 there were 14,325 DRC Alerts. ►Table 5 shows the frequency of alerts for all medications that had at least 100 alerts. It was possible to receive more than one alert per order (see explanation in Methods section). Using the results shown in ►Table 5 we targeted specific changes to the DRC rules to reduce the number of alerts. For example, levetiracetam orders resulted in the second most DRC alerts in our sample. Following the review of these data, we revised the DRC table for levetiracetam in mid February 2009. The revisions added more data for age and weight specific criteria to the alert logic for this medication.
Table 5.
Dose range checking (DRC) alerts by medication type
| Medication Order Name | Order Total | Alerts | % Alerts per Order |
|---|---|---|---|
| acetaminophen | 12,329 | 1124 | 9.1% |
| levetiracetam | 681 | 489 | 71.8% |
| albuterol | 4481 | 361 | 8.1% |
| ibuprofen | 3643 | 300 | 8.2% |
| pantoprazole | 344 | 218 | 63.4% |
| sulfamethoxazole-trimethoprim | 1078 | 214 | 19.9% |
| vancomycin | 712 | 210 | 29.5% |
| amoxicillin-clavulanate | 748 | 209 | 27.9% |
| acetaminophen-hydrocodone | 285 | 196 | 68.8% |
| ketorolac | 671 | 188 | 28.0% |
| diazepam | 576 | 175 | 30.4% |
| mycophenolate mofetil | 371 | 175 | 47.2% |
| ergocalciferol | 221 | 165 | 74.7% |
| ranitidine | 1202 | 165 | 13.7% |
| methylPREDNISolone | 995 | 156 | 15.7% |
| methotrexate | 714 | 153 | 21.4% |
| gentamicin | 444 | 148 | 33.3% |
| fluticasone | 593 | 145 | 24.5% |
| morphine | 5916 | 137 | 2.3% |
| topiramate | 248 | 134 | 54.0% |
| piperacillin-tazobactam | 331 | 133 | 40.2% |
| ondansetron | 6800 | 129 | 1.9% |
| sirolimus | 156 | 125 | 80.1% |
| amphetamine-dextroamphetamine | 403 | 123 | 30.5% |
| omeprazole | 248 | 122 | 49.2% |
| oxyCODONE | 3696 | 120 | 3.2% |
| methylphenidate | 795 | 119 | 15.0% |
| calcium GLUConate | 283 | 115 | 40.6% |
| diphenhydrAMINE | 3535 | 113 | 3.2% |
| glycopyrrolate | 101 | 113 | 111.9% |
| hydrocortisone | 513 | 110 | 21.4% |
| sodium chloride | 111 | 107 | 96.4% |
| acetaminophen-codeine | 1318 | 104 | 7.9% |
| enoxaparin | 286 | 103 | 36.0% |
| heparin | 346 | 102 | 29.5% |
For orders with > 100 alerts from November 1st, 2008 through January 31st, 2009
% = total alerts/orders for each medication
►Table 6 shows the top 20 alerts and the total number of alerts for the ordering providers by role. Residents placed most orders in the inpatient setting. In the ambulatory setting orders were fairly evenly divided between attendings, residents, nurse practitioners and RNs (mostly prescription refills) while fellows ordered less than five percent of medications or prescriptions. Other roles with a small number of orders and alerts are not shown in ►Table 6 (e.g. physician assistants, dentists, nurse anesthetists, etc).
Table 6.
Dose range checking (DRC) alerts by ordering provider role – top 20 DRC alerts
| Attending Total Alerts Medication | 1517 Alerts | Resident Total Alerts Medication | 3297 Alerts |
|---|---|---|---|
| amoxicillin-clavulanate | 85 | Levetiracetam | 155 |
| acetaminophen | 50 | Vancomycin | 81 |
| sulfamethoxazole-trimethoprim | 48 | Acetaminophen | 79 |
| amoxicillin | 44 | Diazepam | 74 |
| cefazolin | 44 | Pantoprazole | 68 |
| ketorolac | 34 | Fluticasone | 62 |
| levetiracetam | 34 | Acetaminophen-codeine | 61 |
| albuterol | 31 | Gentamicin | 59 |
| ibuprofen | 31 | Ketorolac | 55 |
| topiramate | 29 | Ondansetron | 55 |
| ondansetron | 26 | Oxycodone | 54 |
| sirolimus | 26 | Ibuprofen | 52 |
| omeprazole | 24 | sodium chloride | 51 |
| fluticasone | 22 | Acetaminophen-hydrocodone | 48 |
| oxycodone | 22 | Morphine | 48 |
| methotrexate | 21 | diphenhydrAMINE | 45 |
| methylPREDNISolone | 21 | albuterol | 43 |
| ranitidine | 20 | piperacillin-tazobactam | 43 |
| clonidine | 19 | ranitidine | 43 |
| methylphenidate | 19 | glycopyrrolate | 42 |
| Fellow Total Alerts Medication | 634 Alerts | Nurse Practitioner Total Medication | 786 Alerts |
| pantoprazole | 30 | amphetamine-dextroamphetamine | 61 |
| levetiracetam | 27 | methylphenidate | 58 |
| methylPREDNISolone | 23 | levetiracetam | 33 |
| fentanyl | 21 | ranitidine | 27 |
| mycophenolate mofetil | 21 | sulfamethoxazole-trimethoprim | 22 |
| warfarin | 21 | diazepam | 20 |
| calcium gluconate | 20 | esomeprazole | 20 |
| sodium ferric gluconate | 16 | omeprazole | 20 |
| paricalcitol | 14 | topiramate | 19 |
| omeprazole | 12 | amoxicillin-clavulanate | 17 |
| sirolimus | 12 | tacrolimus | 16 |
| ergocalciferol | 11 | meloxicam | 14 |
| methotrexate | 11 | midazolam | 14 |
| amlodipine | 9 | oxcarbazepine | 12 |
| ketorolac | 9 | carbamazepine | 11 |
| voriconazole | 9 | diphenhydrAMINE | 11 |
| calcium carbonate | 8 | ondansetron | 11 |
| fluconazole | 8 | risperidone | 11 |
| micafungin | 8 | citalopram | 10 |
| morphine | 8 | clonidine | 10 |
Audit period November 1st, 2008 through January 31st, 2009
►Table 7 similarly shows the data for the medical assistants (MA), medication intake coordinators (MIC) and pharmacists. The MAs and MICs entered the medication history through a parent interview process as part of the medication reconciliation process. These entries were not actionable orders but did reside on the medication profile. The DRC alert system was activated by the entry of these “orders”. For example, acetaminophen orders triggered the greatest number of alerts for the MIC position (N = 938). The MIC saw 83% of all DRC alerts triggered by acetaminophen (938/1124). The profile was reviewed by the ordering provider after the MIC entered the medication history.
Table 7.
Dose range checking (DRC) alerts by non-ordering provider role – top 20 DRC alerts
| Medical Assistant Medication | 507 Total | MIC Medication | Total | Pharmacist Total Alerts Medication | 3915 Total |
|---|---|---|---|---|---|
| acetaminophen | 34 | acetaminophen | 938 | levetiracetam | 193 |
| omeprazole | 22 | albuterol | 249 | vancomycin | 110 |
| ranitidine | 22 | ibuprofen | 147 | pantoprazole | 108 |
| ergocalciferol | 21 | ergocalciferol | 72 | heparin | 94 |
| ibuprofen | 21 | sulfamethoxazole-trimethoprim | 41 | hydrocortisone | 87 |
| albuterol | 15 | amoxicillin-clavulanate | 39 | ketorolac | 82 |
| naproxen | 15 | acetaminophen-hydrocodone | 38 | gentamicin | 77 |
| fluticasone | 14 | amphetamine-dextroamphetamine | 33 | piperacillin-tazobactam | 76 |
| loratadine | 13 | fluticasone | 31 | methylPREDNISolone | 73 |
| montelukast | 12 | ferrous sulfate | 25 | mycophenolate mofetil | 68 |
| cetirizine | 11 | ascorbic acid | 23 | methotrexate | 65 |
| lansoprazole | 11 | clonidine | 22 | sirolimus | 65 |
| methylphenidate | 11 | loratadine | 22 | pegaspargase | 64 |
| amoxicillin | 9 | cefdinir | 21 | diazepam | 57 |
| lamotrigine | 9 | diphenhydrAMINE | 21 | enoxaparin | 57 |
| oxcarbazepine | 9 | calcium carbonate | 19 | glycopyrrolate | 51 |
| acetaminophen-hydrocodone | 7 | cetirizine | 19 | morphine | 51 |
| ascorbic acid | 7 | guaifenesin | 19 | etoposide | 49 |
| busPIRone | 7 | montelukast | 19 | calcium gluconate | 42 |
| famotidine | 7 | amoxicillin | 18 | sodium chloride | 42 |
MIC = Medication Intake Coordinator; Audit period November 1st, 2008 through January 31st, 2009
The MICs and MAs saw a combined total of 2,903 DRC alerts or 20% of all DRC alerts during this time period. The most common reason for these alerts was an alert message that stated the dose range could not be computed because of insufficient data to calculate a daily dose. The MICs and MAs would also see alerts for medications prescribed that were not on our formulary and thus had no pediatric dosing parameters in our system. Pharmacist’s alerts were overwhelmingly triggered during the order verification process (displayed as icons showing each alert type) and contained the same information as the prescriber alerts. A small number of pharmacist’s alerts occurred when a pharmacist entered an order (pharmacists had and still have a limited scope of medication ordering).
DRC Alert Categorization
There was an increase in the percent of DRC alerts that were considered legitimate over time (►Fig. 2). The greatest number of changes to the DRC tables occurred between December of 2006 and the end of March 2007. During that time 219 changes were made compared to 141 changes spread out over the other time periods (see ►Appendix Table 2).
Fig. 2.
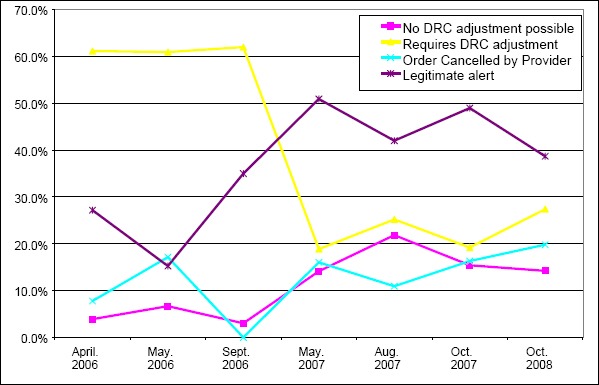
Characterization of alert
Drug-Drug Interaction Checking and Allergy Alerts
The drug-drug interaction checking and allergy alert data are show in ►Table 8. Similar to the DRC alerts, the drug-drug interaction alerts dropped by well over 50%. The greatest decrease in drug-drug interaction alerts occurred between the May and August 2007 audits (14.28% versus 6.09%). This corresponded with the downgrading (from high to moderate) of the interaction for any combination of TNF interaction in late May of 2007. This change alone affected 135 drug combinations widely used at Seattle Children’s. Other examples of alerts that were downgraded were between potassium chloride and sprironolactone and between albuterol and propranolol. Using the same two initial and later time periods as in the above DRC analysis showed the relative risk of getting a drug-drug interaction alert was higher comparing the early versus later time periods (1.63 (95% CI 1.60-1.66; p<0.00001).
Table 8.
Drug-drug and allergy alert data (percent of orders triggering an alert)
| Audit Period | April 2006 | May 2006 | Sept 2006 | May 2007 | Aug 2007 | Oct 2007 | Oct 2008 |
|---|---|---|---|---|---|---|---|
| Percent of Orders Triggering an Alert | |||||||
| Drug-Drug Alerts | 13.45% | 12.63% | 14.66% | 14.28% | 6.09% | 5.09% | 4.82% |
| Drug Allergy Alerts | 2.58% | 1.80% | 5.89% | 5.88% | 4.86% | 4.68% | 5.42% |
The allergy alerts increased over time (►Table 8). The relative risk of getting an allergy alert was less in the initial versus later time periods (0.56 [95% CI 0.53-0.60] p<0.00001). The largest increase in drug-allergy alerts occurred between the May 2006 and September 2006 audit periods which was the time of the ambulatory CPOE go live.
Medication Error Reporting
The number of reported medication ordering errors ranged from 20 to 49 per month from April 2006 through September 2008. The percentage of orders with a reported CPOE ordering error decreased over time due to the rise in total medication orders (450,000 in 2006 versus 640,000 in 2008). For example, in April and May of 2006 0.1% (n = 68) of the 67,398 medication orders (1/1000 orders) had an error reported versus 0.06% (n = 60) of the 105,451 medication orders (0.6/1000 orders) for August and September of 2008. The relative risk of a medication error being reported due to the ordering process in April and May of 2006 was higher versus August and September of 2008 (1.36 [95% CI 1.16 – 1.60] p<0.002).
Discussion
This study describes the quantity of alerts that occurred during the CPOE process by clinical location, provider type and alert type. We are not aware of any other study in pediatrics of decision support alerts that also shows the incidence of dosing and drug-drug interaction alerts based on medication, practice area or provider type. A Dutch study of drug-drug interaction alerts in an inpatient CPOE system showed a range of 3.0% to 17.2% (adults) and 1.6% to 8.0% (pediatrics) of medication orders triggered an alert across multiple specialties. Their data showed that 10 medications accounted for more than 50% of their drug-drug interaction alerts [21]. Our analysis led to targeted changes to alerts that frequently affected a specific medication, drug-drug interaction or provider role and/or location and gave insight into where to alter the alert parameters. For example the total number of alerts for amphetamine-dextroamphetamine was not in the top twenty of all alerts but was the number one alert for the nurse practitioners. This led to targeted changes in the decision support to lessen the number of alerts seen by the nurse practitioners working in the ambulatory psychiatry clinics. Understanding the MIC workflow in relationship to the medication reconciliation process made it clear that changing the DRC tables for acetaminophen would not yield an important decrease in alerts. If we had only looked at the total DRC alerts for acetaminophen we might have been led down a path of trying to resolve this as a provider ordering issue.
The percentage of orders with a reported error decreased during the study period. However, this study was not designed to capture or analyze medication error reports or to capture all medication ordering errors. Voluntary error reporting tools do not capture all events. We acknowledge this limitation but at the same time the number of reported errors did not increase over time using the same tool despite an overall increase in reporting and complaints and a large increase in total medication orders.
The most significant drops in drug-drug interaction alerts were the result of targeted changes to a large class of immunosuppressive and myelosuppressive drug interaction warnings. In a tertiary care center these are commonly used drug combinations for transplant and oncology patients. While in an isolated scenario it may seem logical to warn a provider about these interactions, these messages would more likely lead to frustration and alert fatigue when seen over and over again. A recent study showed that a tiered approach based on severity of drug-drug interaction alerts was more successful in terms of provider acceptance of alerts [22]. That study found that severe alerts with a hard stop (cancel order or the other conflicting medication) had a higher rate of acceptance than less severe interactions without a hard stop. Our system was not configured with hard stops and only shows the moderate or low severity interactions to the pharmacist. Neither this study nor the above study was designed to measure the safety and quality of hard stops or alert overrides. Future research needs to look at which drug interactions in which settings have the highest risk of injury to the patient. Using this information the decision support software should be tailored to warn in only those circumstances.
Similar arguments can be made for customization of dosing alerts. Dosing alerts should be able to vary by setting. For example the dosing of pain medications intra-operatively by an anesthesiologist should not use the same dose ranges as might occur on an inpatient unit or an ambulatory clinic setting.
The percentage of dosing alerts was higher in the ambulatory setting than in the inpatient settings. The vast majority of the ambulatory medication orders were take home prescriptions. This study also showed the natural history of medication alerts at the time of an implementation of ambulatory CPOE. When the ambulatory specialty clinics went live with CPOE and the electronic prescription writer, there was a spike in alerts. This should be anticipated as users become accustomed to a new process. However, it serves as a reminder that institutions need to account for this learning period and fully support users during implementation or major upgrades.
It is not clear why the percentage of allergy alerts increased and now exceeds drug-drug interaction alerts. The process for entering allergy information was not changed. The percentage of drug allergy alerts increased with the ambulatory CPOE go live and has stayed essentially constant since that time. The exact cause is unknown; however, it is possible that the addition of the ambulatory patients represented a somewhat skewed population. Our ambulatory clinics are all specialty referral clinics. Our inpatient units and ED serve both tertiary referral and community pediatric patients. The more chronic nature of illnesses seen in the specialty clinics may predispose these patients to more frequent exposure to medications and a higher chance of developing medication allergies.
This study also showed that despite a huge and successful effort to decrease alerts, a very high percentage of alerts were still ignored. An adult study of a CPOE system with decision support aimed at altering providers to serious drug-drug interactions showed similar issues with over riding of alerts across several adult specialties despite efforts to reduce the number of alerts. When shown the screen shots and texts of alert that were over ridden the providers stated that the “alert well known,” “alert not serious,” or “alert not needing (additional) action,” or that the effects of the combination were monitored or intended. For none of the alerts did all respondents agree that it could be safely turned off hospital-wide” [23]. Our findings are consistent with previous literature and calls into question what alerts are truly valuable [9, 13-15]. Our study was not designed to look at the human factors of alert fatigue or to determine if providers actually consciously choose to ignore alerts versus reflexively clicked through the warnings. This study was designed to describe the frequency of alerts and characterize the clinical setting and provider types that received the alerts. However the lack of improvement in the percentage of alerts that were ignored showed that reducing alerts is not sufficient in itself to improve the user’s response to alerts. Perhaps there is a threshold that once exceeded causes alert fatigue and we were unable to get below that threshold. It may also be that the alert message display is poorly designed. Anecdotally, we know from in-depth review of some medication ordering errors at our institution that providers often state they didn’t see the alert. For these incidents, the alert log confirmed the exact timing of the provider order and the time the provider overrode the alerts. This desensitization or alert fatigue has been described in other institutions with CPOE [18-19]. There needs to be more research to determine the appropriate minimum threshold of signal to noise in clinical decision support that improves patient safety and decreases alert fatigue. We will continue to revise our system trying to find the correct balance between alerts fatigue and patient safety.
Conclusions
Medication ordering is particularly complex in pediatrics due to factors such as weight and age based dosing and the need for pediatric-specific medication decision support [24]. Achieving the correct balance between decision support alerts and alert fatigue remains an important safety issue and more research in this area is warranted. Institutions who implement CPOE must carefully monitor the number of alerts and adjust the decision support rules in their CPOE systems. Vendors of CPOE and decision support systems need to continue to refine the logic of these systems to assist the provider to make the best judgments without contributing to the safety issues inherent in alert fatigue.
Conflict of Interest
None of the authors has any conflict of interest to report
Human Subject Approval
This study was reviewed by Seattle Children’s Hospital Institutional Review Board (IRB) and deemed exempt according to federal regulations regarding research involving human subjects. (IRB letter available on request).
Appendix
Appendix Table 1.
Changes to the drug interaction table
| Drug-drug Interactions Changed from Severe to Moderate |
|---|
|
|
|
|
|
| Downgrade severity of interaction between TNF-blockers and immunosuppressive/myelosupressive agents. Affects 135 drug interaction pairs. |
|
Appendix Table 2.
Timing of dose range changes
| Number of Drugs Changed | ||
|---|---|---|
| Date | Dose Range Min Max or Variance* | Age Weight Route** |
| Apr-06 | 28 | 11 |
| May-06 | 1 | 1 |
| Jun-06 | 1 | 0 |
| Jul-06 | 1 | 2 |
| Aug-06 | 3 | 2 |
| Sep-06 | 4 | 3 |
| Nov-06 | 2 | 0 |
| Dec-06 | 105 | 23 |
| Jan-07 | 41 | 7 |
| Feb-07 | 35 | 5 |
| Mar-07 | 20 | 3 |
| Apr-07 | 15 | 5 |
| May-07 | 4 | 2 |
| Jun-07 | 2 | 1 |
| Jul-07 | 5 | 1 |
| Aug-07 | 1 | 0 |
| Sep-07 | 12 | 4 |
| Oct-07 | 4 | 3 |
| Dec-07 | 2 | 1 |
*minimum, maximum or allowable variation over or under minimum or maximum changed;
**rules modified based on age, weight or route of medication
References
- 1.Kohn LT, Corrigan JM, Donaldson MS, To Err Is Human: Building a Safer Health System. Institute of Medicine Committee on Quality Health Care in America. Washington DC: National Academy Press; 1999 [Google Scholar]
- 2.Leapfrog Group Leapfrog hospital survey results. Available at: www.leapfroggroup.org/for_hospitals/leapfrog_safety_practices/cpoe [Google Scholar]
- 3.Fortescue EB, et al. Prioritizing strategies for preventing medication errors and adverse drug events in pediatric inpatients. Pediatrics 2003; 111: 722–729 [DOI] [PubMed] [Google Scholar]
- 4.King WJ, et al. The effect of computerized physician order entry on medication errors and adverse drug events in pediatric inpatients. Pediatrics 2003; 112: 506–509 [DOI] [PubMed] [Google Scholar]
- 5.Potts AL, et al. Computerized physician order entry and medication errors in a pediatric critical care unit. Pediatrics 2004; 113: 59–63 [DOI] [PubMed] [Google Scholar]
- 6.Holdsworth MT, et al. The effect of computerized prescriber order entry on the incidence of adverse drug events in pediatric inpatients. Pediatrics 2007; 120: 1058–1066 [DOI] [PubMed] [Google Scholar]
- 7.Galanter WL, Polikiatis A, Didomenico RJ. A trial of automated safety alerts for inpatient digoxin use with computerized physician order entry. JAMIA 2004: 11; 270–277 [DOI] [PMC free article] [PubMed] [Google Scholar]
- 8.Galanter WL, Didomenico RJ, Polikiatis A. A trial of automated decision support alerts for contraindicated medications using computerized physician order entry. JAMIA 2005; 12: 269–274 [DOI] [PMC free article] [PubMed] [Google Scholar]
- 9.Steele AW, et al. The effect of automated alerts on provider ordering behavior in an outpatient setting. PLoS Med. 2005; 2(9): e255 Epub 2005 Sep 6. online atwww.plosmedicine.org [DOI] [PMC free article] [PubMed] [Google Scholar]
- 10.Evans RS, et al. Improving empiric antibiotic selection using computer decision support. Arch Intern Med 1994; 154(8): 878–884 [PubMed] [Google Scholar]
- 11.Smith DH, et al. The impact of prescribing safety alerts for elderly persons in an electronic medical record. Arch Intern Med 2006; 166: 1098–1104 [DOI] [PubMed] [Google Scholar]
- 12.Kaushal R, Shojania KG, Bates DW. Effects of computerized physician order entry and clinical decision support systems on medication safety. A systematic review. Arch Intern Med 2003; 163: 1409–1416 [DOI] [PubMed] [Google Scholar]
- 13.van der Sijs H, Aarts J, Vulto A, Berg M. Overriding of drug safety alerts in computerized physician order entry. JAMIA 2006; 13: 138–147 [DOI] [PMC free article] [PubMed] [Google Scholar]
- 14.Killelea BK, Kaushal R, Cooper M, Kuperman GJ. To what extent do pediatricians accept computer-based dosing suggestions? Pediatrics 2007; 119; e69-e75 [DOI] [PubMed] [Google Scholar]
- 15.Judge J, et al. Prescribers’ responses to alerts during medication ordering in the long term care setting. JAMIA 2006; 13: 285–390 [DOI] [PMC free article] [PubMed] [Google Scholar]
- 16.Lin CP, et al. Evaluating clinical decision support systems: Monitoring CPOE order check override rates in the Department of Veterans Affairs’ computerized patient record system. JAMIA 2008; 15: 620–626 [DOI] [PMC free article] [PubMed] [Google Scholar]
- 17.Isaac T, et al. Overrides of medication alerts in ambulatory care. Arch Int Med 2009; 169(3): 305–311 [DOI] [PubMed] [Google Scholar]
- 18.Ash JS, et al. The extent and importance of unintended consequences related computerized provider order entry. JAMIA 2007; 14: 415–423 [DOI] [PMC free article] [PubMed] [Google Scholar]
- 19.Glassman PA, et al. Exposure to automated drug alerts over time: effects on clinicians’ knowledge and perceptions. Med Care 2006; 44(3): 250–256 [DOI] [PubMed] [Google Scholar]
- 20.Reichley RM, et al. Implementing a commercial rule base as a medication order safety net. JAMIA 2005; 12: 383–389 [DOI] [PMC free article] [PubMed] [Google Scholar]
- 21.Zwart-van Rijkom JEF, et al. Frequency and nature of drug–drug interactions in a Dutch university hospital. Br J Clin Pharmacol 2009; 68: 2: 187–193 [DOI] [PMC free article] [PubMed] [Google Scholar]
- 22.Paterno MD, et al. Tiering drug-drug interaction alerts by severity increases compliance rates. JAMIA 2009; 16: 40–46 [DOI] [PMC free article] [PubMed] [Google Scholar]
- 23.van der Sijs H, et al. Turning off frequently overridden drug alerts: limited opportunities for doing it safely. JAMIA 2008; 15: 439–448 [DOI] [PMC free article] [PubMed] [Google Scholar]
- 24.Kim GR, Lehmann C.and the Council on Clinical Information Technology Pediatric aspects of inpatient health information technology systems. Pediatrics 2008; 122: e1287–296 [DOI] [PubMed] [Google Scholar]