Abstract
Background and Aims:
Tacrolimus is a macrolide immunosuppressant used for prevention of allograft rejection in organ transplantation and metabolized in the liver and intestine by cytochrome P450 3A4 (CYP3A4) enzyme. A single nucleotide polymorphism (SNP) in the CYP3A4 promoter region has been identified. It has been shown that the presence of CYP3A4*1B allele (variant GG) is associated with a reduced catalytic activity of CYP3A4 ,in vivo. The aim of this study was to determine the role of CYP3A4*1B on tacrolimus dosing and clinical outcome in liver transplant recipients.
Subjects and Methods:
Forty-eight liver transplant recipients were stratified according to the genotype. There were 32 wild-type (AA) patients and 5 homozygous variant (GG) and 11 (AG) heterozygous. Tacrolimus doses and trough concentrations as well as phenotypic data were collected in the first 10 days of the transplant.
Results:
The tacrolimus concentration was significantly higher in the wild (AA) group as compared to homozygous variant (GG) and heterozygous (AG) patients. Homozygous variant (GG) group had significantly lower dose requirements. However, no significant difference was observed in the concentration/dose ratio between all groups.
Conclusions:
Based on our results, it may be concluded that CYP3A4*1B of recipient is an important factor influencing pharmacokinetic of tacrolimus, as patients with CYP3A4*1B polymorphism may require lower tacrolimus doses to maintain therapeutic levels. The dose reduction may not affect clinical outcomes after liver transplant.
Keywords: Cytochrome P450 3A4*1B, liver transplant, tacrolimus
Tacrolimus is a macrolide immunosuppressant used for the prevention of allograft rejection in solid organ transplantation. It inhibits calcineurin via formation of complex with immunophilin called FK-506-binding protein 12. Tacrolimus is metabolized via cytochrome P450 3A4 (CYP3A4) primarily in the liver and intestinal mucosa. Elimination half-life of tacrolimus has been reported as 12 h in the liver transplant recipients and 19 h in renal transplant recipients. Less than 1% of intravenous dose of tacrolimus is eliminated unchanged in the urine.[1,2] The whole blood concentration of tacrolimus should be monitored and blood levels should be maintained in the range of 5-15 μg/l for optimal efficacy and minimal toxicity such as nephrotoxicity and neurotoxicity in both kidney and liver transplant recipients.[3]
CYP3A is the primary CYP subfamily in humans, responsible for CYP-mediated phase I metabolism of more than 50% of administrated drugs. CYP3A is primarily located in hepatocytes and the biliary epithelial cells of the liver and the villous columnar epithelial of the jejunum. Among the CYP3A subfamily, CYP3A4 (EC 1.14.13.97) is the most abundant isoenzyme in human drug metabolism,[4,5] constituting 28% of total CYPs in the human body. CYP3A4 is involved in the oxidation of the largest range of substrates of all the CYPs. As a result, CYP3A4 is present in the largest quantity of all the CYPs in the liver. In humans, the CYP3A4 protein is encoded by the CYP3A4 gene.[6] This gene is part of a cluster of CYP genes on chromosome 7q21.1.[7]
The calcineurin inhibitors, tacrolimus, have a narrow therapeutic index and show a highly variable pharmacokinetics. The low tacrolimus bioavailability has been attributed to inter-individual differences in the expression of the metabolizing enzyme CYP3A4. The genes for CYP3A4 undergo genetic polymorphism.[8] A single nucleotide polymorphism (SNP) in the CYP3A4 promoter region has been identified. CYP3A4*1B allele characterized by the A/G genetic polymorphism at position 290-base pair (bp) from start codon in the sequence motif of the 5′- flanking region of the CYP3A4 gene, termed the nifedipine-specific element. It was proved that the presence of CYP3A4*1B allele is associated with a reduced catalytic activity of CYP3A4 in vivo. The frequency of this A-290G transition polymorphism varies considerably between different racial population, the variant allele frequency is 3.6% in white Americans, 54.6% in African Americans, 9.3% in Hispanic Americans, and 0% in both Japanese Americans and Chinese Americans.[9–13] Therefore, in the case of patients receiving liver transplantation, the CYP3A4 genotypes could be essential to the marked inter-individual variation in post-operative tacrolimus pharmacokinetics. However, the effect of CYP3A4*1B genotype on tacrolimus dose and blood concentration/dose (C/D) ratio in liver transplantation remains to be elucidated.
These data encouraged us to examine whether the CYP3A4*1B is predictor to the dosage and trough level of tacrolimus in individual recipients of orthotopic liver transplantation (OLT). In this study, we examined the effect of CYP3A4*1B polymorphism on the pharmacokinetics of tacrolimus in OLT. In addition, we investigated the relation between this polymorphism and potential prognostic factors for OLT outcome.
SUBJECTS AND METHODS
Chemicals
All chemicals used in this study were of highest analytical grade.
Subjects
This study comprised 48 patients. All patients received OLT at Shands Hospital, University of Florida. Patients who received cadaveric liver transplant and older than 18 years were eligible for the inclusion in this study. Patients were excluded if they had living donor liver transplant or the recipients were younger than 18 years. All these patients gave written informed consent and were enrolled in this study. The age of the recipients ranged from 30 years to 68 years and there were 20 women and 28 men. The liver biopsies were obtained from the donor liver before OLT in the operating room for genotyping. The liver biopsies were obtained on day 7 and month 4 per protocol at Shands Hospital at University of Florida or other biopsies for diagnostic and medical reasons during the first 4 months post-transplantation to establish the diagnosis of acute rejection. The serum creatinine was collected at transplant day (day 0) and month 4 to estimate the creatinine clearance using the corrected equation of Cockcroft and Gault Crcl = (140 – Age/Scr) and for female multiply by 0.85. The immunosuppression regimen consisted of tacrolimus and low dose of steroids and tacrolimus started on post-transplant day 1 and for a target trough concentration 10-15 ng/ml. All the liver transplant recipients received 1 g of methylprednisolone intravenously intra-operatively. Oral prednisone was started as 200 mg and then tapered by 40-20 mg/day on post-transplant day 7. We collected retrospectively all doses of tacrolimus and tacrolimus trough concentration levels during the first 10 days of transplantation. The study was approved by University of Florida Shands Institutional Review Board.
Genotyping for the CYP3A4*1B polymorphism
Genomic DNA was isolated from 10 mg of human liver tissue using Gentra Puregene tissue DNA isolation kit (Minneapolis, USA). The CYP3A4 genotype of each subject was determined with respect to the adenine (A) to guanine (G) transition at position of 290 from the start codon in the sequence motif of the 5’-flanking region of the CYP3A4 gene, termed the nifedipine-specific element. For the CYP3A4*1B polymorphism A > G at 290 in the promoter region, Polymerase Chain Reaction (PCR) of genomic DNA was used to generate a 220-bp fragment around the site of interest. A > G polymorphism is not a natural restrictive fragment length polymorphism (RFLP). A restriction site was built using upstream primer 5′-GGA CAG CCA TAG AGA CAA GGC CA 3’ with base pair mismatches to create a BstN1 site. A control BstN1 site was created by base pair mismatches on the downstream primer 5’- AGT TTG AAG AGG CTT CTC CAC CCT GG 3’. The 50 μl PCR reaction mix includes: 5 μl genomic DNA, 43 μl platinum PCR supermix (invitrogen ® ), and 1 μl each primer. The PCR consist of 35 cycles as follows: denature at 94°C for 1 min, anneal at 56°C for 1 min, extended at 72°C for 1 min, cycling is followed by a final extension at 72°C for 7 mins and held at 4°C. RFLP was used to identify a polymorphism at 290 of the promoter region with restriction enzyme BstNI. The digestion reaction mix consisted of: 5 μl PCR products, 10 μl water, 2 μl NE buffer, 2 μl × 10 BSA, and 1 μl BstNI (10 units). The reaction was incubated for 2 h at 65°C. A single cleavage of the 220-bp PCR product to 196-bp confirmed the restriction ligation worked and that the site of interest is the wild-type A. A double cleavage of the 220-bp PCR product resulted in 174-bp confirming the variant G at 290. Thus, the homozygotes for A at 290 had a single band at 196-bp and homozygotes for G (variant) had a single band at 174-bp. Digestion products were visualized using polyacrylamide gel electrophoresis, using an 8% polyacrylamide gel.
Statistical analysis
Descriptive statistics were used to describe the demographic characteristics of the sample. All statistical analyses were performed using Statistical Analysis Software (SAS) (version 8, Institute Inc., Cary, NC, USA). The univariate repeated measures analysis of co-variance was used to compare the mean dosage, concentration, and C/D ratio among three different genotypes. McNemar test was used for comparing the incidence of acute rejection in day 7 and month 4 and Chi-square used for incidence of acute rejection among the genotypes. A P value of less than 0.05 was considered statistically significant. All data are expressed as mean ± SD.
RESULTS
Demographic characteristics
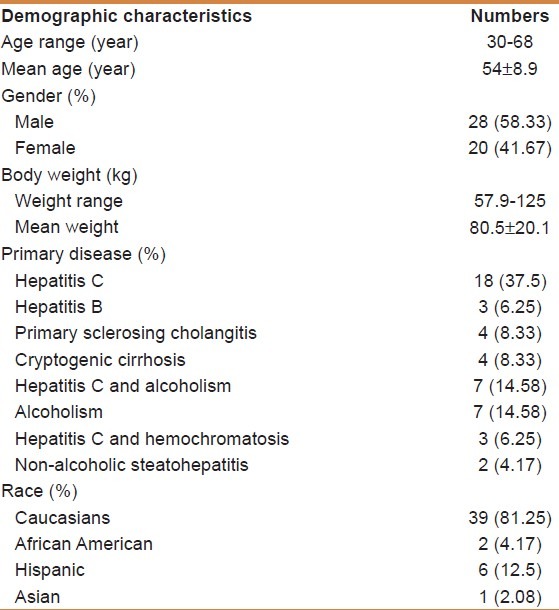
Table 1 shows the demographics and primary disease of the OLT recipients whose liver samples were studied. Among the recipients, there were 20 females and 28 males, the age of recipients ranged from 30 years to 68 years and their weight ranged from 57.9 kg to 125 kg. The majority of samples studied were Caucasians (n = 39), and the remaining nine recipients were six Hispanic, two African American, and one Asian. Hepatitis C virus infection accounted for more than 50% of the causes of end stage of liver disease. Among the 48 recipients, only one recipient died due to fungal infection. Recipient's number 47 and 48 were excluded from the analyses of the tacrolimus pharmacokinetics because they received additional immunosuppressant agents but were included in the genotyping analyses.
Table 1.
Recipients demographic characteristics (n=48)
CYP3A4*1B polymorphism frequency (n = 48)
Table 2 shows that 32 out of 48 (66.7%) carried wild type, whereas 11 (22.9%) carried heterozygote and only 5 (10.4%) carried homozygote. The genotypes were in Hardy Weinberg equilibrium withP = 0.48. The A frequency was 75 out of a total 96 (78.1%), whereas G was 21 (21.9%).
Table 2.
Cytochrome P450 3A4*1B polymorphism frequency (n=48)

Demographic characteristics according to genotype
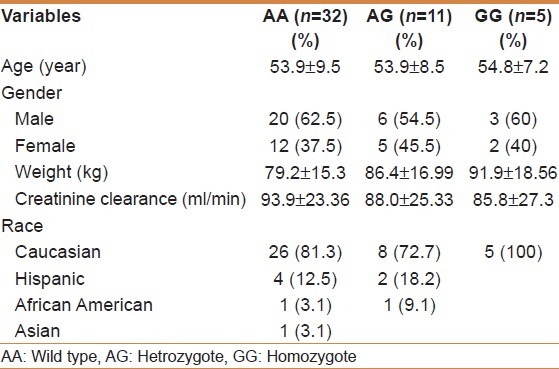
We stratified the demographic characteristics according to genotype as shown in Table 3. There was no difference between ages of recipients among the three genotypes, while body weight was higher with variant group. Creatinine clearance at baseline was lower in the homozygote variant group (GG). The demographic of the wild-type (AA) group consisted of 26 Caucasians (81.3%), 4 Hispanic (12.5%), 1 African American (3.1%), and 1 Asian (3.1%). All homozygote variants GG were carried by Caucasians. The majority of heterozygote was carried by Caucasians which was 8 (72.7%), whereas the remaining three was between Hispanic and African American.
Table 3.
Demographic characteristics according to genotype
Post-operative immunosuppressive therapy with tacrolimus
Immunosuppressive therapy with tacrolimus was started the day after OLT. Therefore, measurement of oral dosage of tacrolimus and daily trough concentrations were both obtained on day 1 through day 10 for the 46 recipients. As shown in Figure 1 and Table 4, the mean tacrolimus dosage was higher in the wild group versus both Heterozygote AG (P < 0.0062) and homozygote variant GG (P < 0.046) but there was no difference between Heterozygote AG and homozygote variant GG (P = 0.71). Two patients were excluded from the study because they did not receive tacrolimus as an immunosuppressant. These subjects were from GG group; therefore, GG group had only three patients in the analyses. When we combined AG and GG together and compared with AA, we found statistically significant difference between the two groups. As shown in Figure 2 and Table 4, the mean tacrolimus concentration level was higher in the wild group versus heterozygote (P < 0.006). There was no difference between AA and GG groups. As shown in Figure 3 and Table 4, there was no statistically significant difference in mean C/D ratio in all three genotype groups but GG group tend to have higher C/D ratio, though not significant due to the very small sample size in GG group (three patients).
Figure 1.
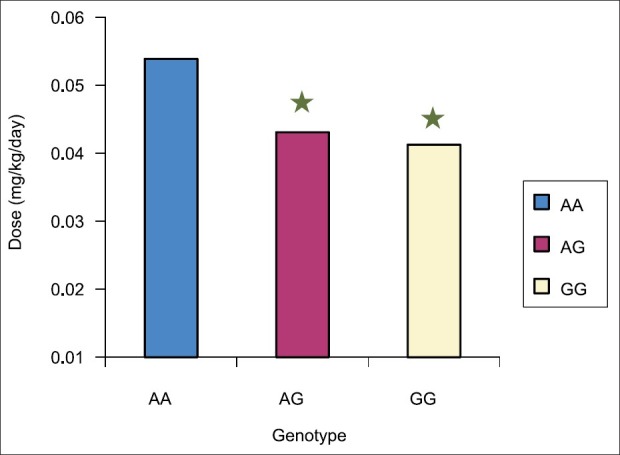
Mean tacrolimus dosage in the first 10 days among 46 recipients. Tacrolimus dosage was statistically significant higher in the wild group (AA) as compared with both Heterozygote AG (P<0.0062) and homozygote variant GG (P<0.046) but there was no difference between hetrozygote AG and homozygote variant GG (P=0.71). Two patients were excluded from study because they did not receive tacrolimus as an immunosuppressant. *Significant difference from wild group (AA)
Table 4.
Classification of cytochrome P450 3A4*1B genotypes and tacrolimus pharmacokinetics in 46 recipients of orthotopic liver transplantation

Figure 2.
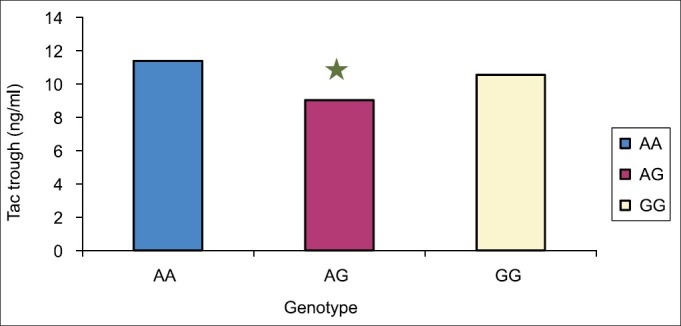
Shows the mean tacrolimus concentration from day 2 to day 10 among 46 recipients. The mean tacrolimus concentration level was statistically significant higher in wild group (AA) versus heterozygote (AG) (P<0.006). However, there was no difference between AA and GG groups. *Significant difference from wild group (AA)
Figure 3.
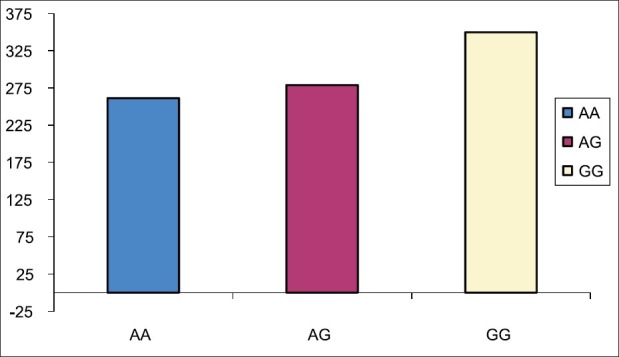
The mean concentration/dosage ratio from day 2 to day 10 among 46 recipients. There were no statistically significant difference in all three genotype groups but GG group tend to have higher C/D ratio but not significant due to very small sample size in GG group (3 patients)
Clinical outcomes
Acute graft rejection
As shown in Figure 4 and Table 5, there was statistically significant difference (higher) in the incidence of acute rejection on day 7 as compared to month 4 (P < 0.0002). There were 29 incidences of rejection on day 7 based on liver biopsy per protocol. Ten episodes out of 29 (34.5%) were mild and did not require any intervention, 16 out of 29 (55.2%) were moderate and treated by pulse steroid, 3 out of 29 (10.3%) were severe, and 1 out of 3 received antibody. We further analyzed the acute rejection on day 7 and month 4 based on genotype. On day 7, there was no significant difference in the incidence of acute rejection among the three different groups (P = 0.6135). In month 4, there was no statistically significant difference among the genotypes (P = 0.4808) [Figure 5].
Figure 4.
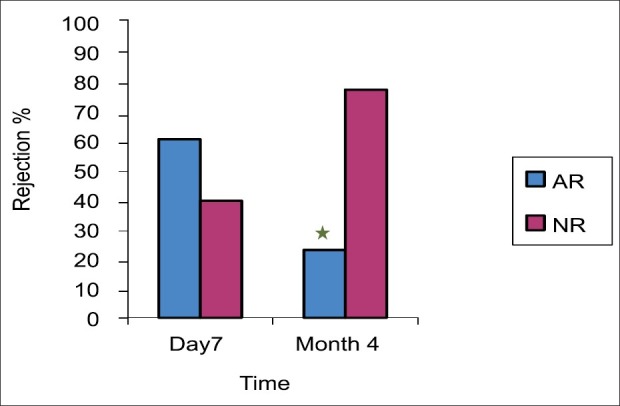
The incidence of AR in both day 7 and moth 4. The incidence of AR is a statistically significant higher in day 7 as compared with month 4. There were 29 (60.4%) incidences of rejection in day 7 based on liver biopsy per protocol classified as mild, moderate, severe and steroid resistance acute rejection. While there were 11 (22.9%) incidence of rejection in month 4. *Significant difference from day 7
Table 5.
Acute rejection on day 7 and month 4 according to genotype
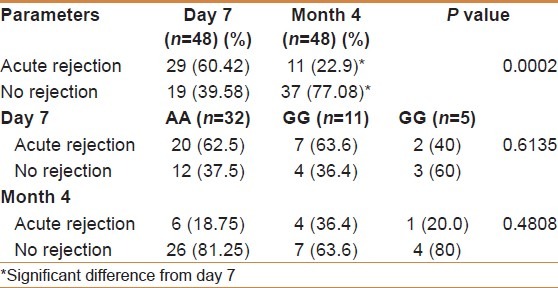
Figure 5.
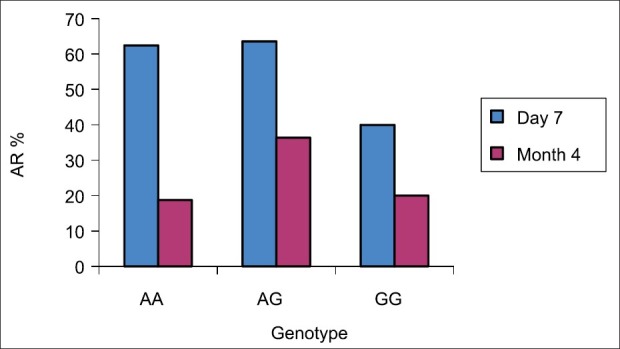
The incidence of AR among the genotypes in both day 7 and moth 4. We further analyzed the acute rejection in day 7 and month 4 based on genotype. In day 7, there was no significant difference in the incidence of acute rejection among the three different groups (P= 0.6135). In month 4 there was no statistically significant among the genotypes and P was 0.4808
Creatinine clearance
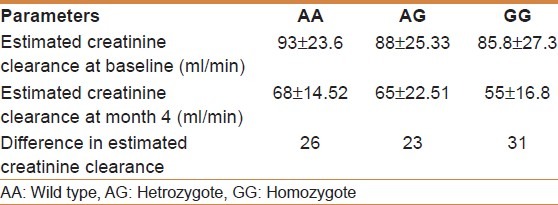
Figure 6 and 7 demonstrate the estimated creatinine clearance. The creatinine clearance was statistically significantly higher in the baseline (98.7 ± 12.05 ml/min) as compared with month 4 (72.9 ± 15.74 ml/min) (P value <0.0001). When we stratified the difference in the estimated creatinine clearance with genotype, we found no difference in the estimated creatinine clearance among the genotype as shown in Table 6.
Figure 6.
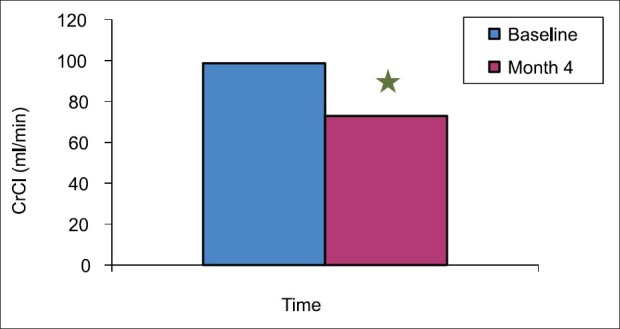
Creatinine clearance in baseline and month 4 among the 48 recipients were estimated. 24 hrs urine were collected. Plasma and urine creatinine level were estimated and creatinine clearance was calculated. The creatinine clearance was statistically significant higher in baseline as compared with month 4. *Significant difference from baseline
Figure 7.
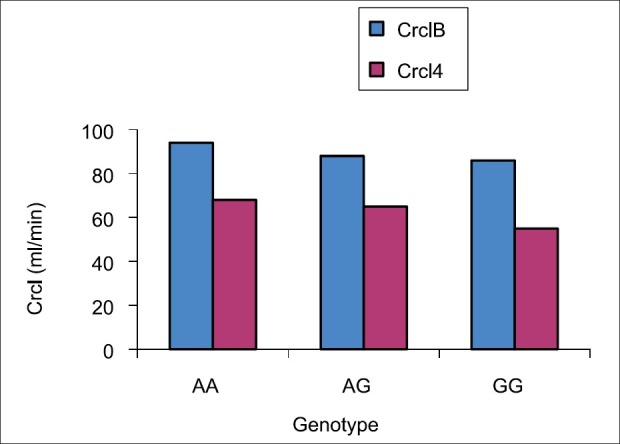
Creatinine clearance with different genotype among the 48 recipients were estimated. Plasma and urine creatinine level were estimated and 24 hrs urine were collected and creatinine clearance was calculated. No significant difference in the estimated creatinine clearance among the genotype
Table 6.
Estimated creatinine clearance among the different genotypes
DISCUSSION
OLT is becoming an increasingly important strategy in reducing mortality rate in liver failure patients.[14,15] The calcineurin inhibitor, tacrolimus is an immunosuppressive drug that has a narrow therapeutic index with high inter-individual variations in its pharmacokinetics, which makes it difficult to establish an empirical dosage regimen in organ transplant recipients.[16] Therefore, routine therapeutic drug monitoring of tacrolimus is recommended to optimize the therapy for prevention of allograft rejections and adverse effects.[17] Among the potential causes for large variability, recent pharmacogenetic studies have suggested genetic association of CYP3A4 and CYP3A5 genotypes and tacrolimus pharmacokinetics.[8,18,19]
To the best of our knowledge, this study is the first study to examine the role of CYP3A4*1B on tacrolimus dosing and clinical outcome in liver transplant recipients. Our major finding was that recipients with CYP3A4*1B polymorphism may require lower tacrolimus doses to maintain therapeutic levels and the dose reduction may not affect clinical outcomes after liver transplant.
In this study, the mean tacrolimus doses were statistically significantly higher among the wild-type group (AA) compared to both heterozygote variants (AG) and homozygote variants (GG). The mean trough tacrolimus concentrations were statistically significantly higher with wild type as compared to heterozygote variants (AG). There was no difference between wild and variant in the C/D ratio. Our results are consistent with arecent study by Ji et al.,[20] who investigated the longitudinal effects of recipient-donor combinational CYP3A5 genotypes on tacrolimus dose-normalized concentration (C/D ratio) in blood and concluded that CYP3A5 genotypes of both recipient and donor were important factors influencing pharmacokinetic variability of tacrolimus. The recipient-donor combinational genetic effect on C/D ratio changed over time after transplantation.
As hepatic metabolism by CYP3A enzymes is considered a major eliminating process of tacrolimus, liver regeneration from the ischemia reperfusion injury as well as enlarging the liver mass after transplantation may have influence on the total clearance of tacrolimus. In OLT, tacrolimus metabolism is reduced during the liver regeneration period[21] because of the recovery of liver mass to the standard liver volume[22,23] as well as the down-regulation of the CYP3A enzyme system.[24]
CYP3A4*1B polymorphism has a different estimated frequency in the Caucasian population and African Americans. The observed frequency of homozygote variant (GG) was 10.4% and heterozygote was 22.9% which was higher than expected from previous studies.[9–13] A previous study demonstrated that a functional consequence of the A-290G promoter region mutation namely, the CYP3A4*1B allele was associated with reduced CYP3A4 catalytic activity in vivo; however, the genotype-phenotype relationship is only present with respect to CYP3A4 localized in the liver whose catalytic activity determined the systemic clearance of midazolam but no such association was observed with respect to oral clearance midazolam.[9] Other previous investigation of the in vivo functional consequences of the CYP3A4*1B allele did not find any genotype-phenotype differences.[10] In contrast, Rivory et al,[25] examined the relationship between the presence of CYP3A4*1B allele and the cyclosporine clearance in 117 renal transplant patients and 100 normal subjects, they did not find any correlation between genotype and phenotype and the cyclosporine clearance was the same between wild and variant groups.[13] Nicolas et al,[26] showed a lack of functional significance of CYP3A4*1B allele for cyclosporine dose required to achieve therapeutic concentration of cyclosporine as well as the incidence of acute rejection and serum creatinine in renal transplant recipients on cyclosporine immunesuppression.[20]
Tacrolimus is extensively distributed to red blood cells and bound to plasma protein, and the physiological status of the liver transplanted is expected to influence the pharmacokinetics of tacrolimus. Thus, covariates that have been known to affect tacrolimus disposition, such as time since transplantation, body weight, as well as demographics, were adjusted to analyze the association of CYP3A4*1B genetic variants with the pharmacokinetics of tacrolimus in this study.
Our data showed that there was a statistically significant higher acute rejection on day 7 compared to month 4 and lack of association with genotype, which was same incidence of acute rejection in three groups, which support the previous report. In our data, we found that renal creatinine clearance was significantly declined from day 0 compared to month 4 but with not respect to genotype since the reduction of creatinine clearance was similar among three groups.
CONCLUSIONS
The presence of CYP3A4*1B variant correlates with reduction of tacrolimus dose by approximately 20% without affecting clinical outcomes; this SNP may be a useful tool to determine the appropriate tacrolimus dose in the liver transplant patients. A prospective study is required to control all confounders.
Footnotes
Source of Support: Nil
Conflict of Interest: None declared.
REFERENCES
- 1.Plosker GL, Foster RH. Tacrolimus: A further update of its pharmacology and therapeutic use in the management of organ transplantation. Drugs. 2000;59:323–89. doi: 10.2165/00003495-200059020-00021. [DOI] [PubMed] [Google Scholar]
- 2.Bekersky I, Dressler D, Mekki QA. Effect of low- and high-fat meals on tacrolimus absorption following 5 mg single oral doses to healthy human subjects. J Clin Pharmacol. 2001;41:176–82. doi: 10.1177/00912700122009999. [DOI] [PubMed] [Google Scholar]
- 3.Oellerich M, Armstrong VW, Schütz E, Shaw LM. Therapeutic drug monitoring of cyclosporine and tacrolimus.Update on Lake Louise Consensus Conference on cyclosporin and tacrolimus. Clin Biochem. 1998;31:309–16. doi: 10.1016/s0009-9120(98)00049-6. [DOI] [PubMed] [Google Scholar]
- 4.Dresser GK, Spence JD, Bailey DG. Pharmacokinetic-pharmacodynamic consequences and clinical relevance of cytochrome P450 3A4 inhibition. Clin Pharmacokinet. 2000;38:41–57. doi: 10.2165/00003088-200038010-00003. [DOI] [PubMed] [Google Scholar]
- 5.Zhang Y, Benet LZ. The gut as a barrier to drug absorption: Combined role of cytochrome P450 3A and P-glycoprotein. Clin Pharmacokinet. 2001;40:159–68. doi: 10.2165/00003088-200140030-00002. [DOI] [PubMed] [Google Scholar]
- 6.Hashimoto H, Toide K, Kitamura R, Fujita M, Tagawa S, Itoh S, et al. Gene structure of CYP3A4, an adult-specific form of cytochrome P450 in human livers, and its transcriptional control. Eur J Biochem. 1993;218:585–95. doi: 10.1111/j.1432-1033.1993.tb18412.x. [DOI] [PubMed] [Google Scholar]
- 7.Inoue K, Inazawa J, Nakagawa H, Shimada T, Yamazaki H, Guengerich FP, et al. Assignment of the human cytochrome P-450 nifedipine oxidase gene (CYP3A4) to chromosome 7 at band q22.1 by fluorescence in situ hybridization. Jpn J Hum Genet. 1992;37:133–8. doi: 10.1007/BF01899734. [DOI] [PubMed] [Google Scholar]
- 8.Duricová J, Grundmann M. Cytochrome P450 3A polymorphism and its importance in cyclosporine and tacrolimus therapy in transplanted patients. Ceska Slov Farm. 2007;56:220–4. [PubMed] [Google Scholar]
- 9.Wandel C, Witte JS, Hall JM, Stein CM, Wood AJ, Wilkinson GR. CYP3A activity in African American and European American men: Population differences and functional effect of the CYP3A4 * 1B5›-promoter region polymorphism. Clin Pharmacol Ther. 2000;68:82–91. doi: 10.1067/mcp.2000.108506. [DOI] [PubMed] [Google Scholar]
- 10.Ball SE, Scatina J, Kao J, Ferron GM, Fruncillo R, Mayer P, et al. Population distribution and effects on drug metabolism of a genetic variant in the 5′ promoter region of CYP3A4. Clin Pharmacol Ther. 1999;66:288–94. doi: 10.1016/S0009-9236(99)70037-8. [DOI] [PubMed] [Google Scholar]
- 11.Rebbeck TR, Jaffe JM, Walker AH, Wein AJ, Malkowicz SB. Modification of clinical presentation of prostate tumors by a novel genetic variant in CYP3A4. J Natl Cancer Inst. 1998;90:1225–9. doi: 10.1093/jnci/90.16.1225. [DOI] [PubMed] [Google Scholar]
- 12.García-Martín E, Martínez C, Pizarro RM, García-Gamito FJ, Gullsten H, Raunio H, et al. CYP3A4 variant alleles in white individuals with low CYP3A4 enzyme activity. Clin Pharmacol Ther. 2002;71:196–204. doi: 10.1067/mcp.2002.121371. [DOI] [PubMed] [Google Scholar]
- 13.Sata F, Sapone A, Elizondo G, Stocker P, Miller VP, Zheng W, et al. CYP3A4 allelic variants with amino acid substitutions in exons 7 and 12: Evidence for an allelic variant with altered catalytic activity. Clin Pharmacol Ther. 2000;67:48–56. doi: 10.1067/mcp.2000.104391. [DOI] [PubMed] [Google Scholar]
- 14.Olthoff KM, Merion RM, Ghobrial RM, Abecassis MM, Fair JH, Fisher RA, et al. Outcomes of 385 adult-to-adult living donor liver transplant recipients: A report from the A2ALL Consortium. Ann Surg. 2005;242:314–23. doi: 10.1097/01.sla.0000179646.37145.ef. [DOI] [PMC free article] [PubMed] [Google Scholar]
- 15.Berg CL, Gillespie BW, Merion RM, Brown RS Jr, Abecassis MM, Trotter JF, et al. Improvement in survival associated with adult-to-adult living donor liver transplantation. Gastroenterology. 2007;133:1806–13. doi: 10.1053/j.gastro.2007.09.004. [DOI] [PMC free article] [PubMed] [Google Scholar]
- 16.Venkataramanan R, Swaminathan A, Prasad T, Jain A, Zuckerman S, Warty V, et al. Clinical pharmacokinetics of tacrolimus. Clin Pharmacokinet. 1995;29:404–30. doi: 10.2165/00003088-199529060-00003. [DOI] [PubMed] [Google Scholar]
- 17.Jusko WJ, Thomson AW, Fung J, McMaster P, Wong SH, Zylber-Katz E, et al. Consensus document: Therapeutic monitoring of tacrolimus (FK-506) Ther Drug Monit. 1995;17:606–14. doi: 10.1097/00007691-199512000-00011. [DOI] [PubMed] [Google Scholar]
- 18.Zheng H, Webber S, Zeevi A, Schuetz E, Zhang J, Bowman P, et al. Tacrolimus dosing in pediatric heart transplant patients is related to CYP3A5 and MDR1 gene polymorphisms. Am J Transplant. 2003;3:477–83. doi: 10.1034/j.1600-6143.2003.00077.x. [DOI] [PubMed] [Google Scholar]
- 19.Huang W, Lin YS, McConn DJ, 2nd, Calamia JC, Totah RA, Isoherranen N, et al. Evidence of significant contribution from CYP3A5 to hepatic drug metabolism. Drug Metab Dispos. 2004;32:1434–45. doi: 10.1124/dmd.104.001313. [DOI] [PubMed] [Google Scholar]
- 20.Ji E, Choi L, Suh KS, Cho JY, Han N, Oh JM. Combinational effect of intestinal and hepatic CYP3A5 genotypes on tacrolimus pharmacokinetics in recipients of living donor liver transplantation. Transplantation. 2012;94:866–72. doi: 10.1097/TP.0b013e318263700a. [DOI] [PMC free article] [PubMed] [Google Scholar]
- 21.Lodewijk L, Mall A, Spearman CW, Kahn D. Effect of liver regeneration on the pharmacokinetics of immunosuppressive drugs. Transplant Proc. 2009;41:379–81. doi: 10.1016/j.transproceed.2008.10.055. [DOI] [PubMed] [Google Scholar]
- 22.Kawasaki S, Makuuchi M, Ishizone S, Matsunami H, Terada M, Kawarazaki H. Liver regeneration in recipients and donors after transplantation. Lancet. 1992;339:580–1. doi: 10.1016/0140-6736(92)90867-3. [DOI] [PubMed] [Google Scholar]
- 23.Haga J, Shimazu M, Wakabayashi G, Tanabe M, Kawachi S, Fuchimoto Y, et al. Liver regeneration in donors and adult recipients after living donor liver transplantation. Liver Transpl. 2008;14:1718–24. doi: 10.1002/lt.21622. [DOI] [PubMed] [Google Scholar]
- 24.Starkel P, Laurent S, Petit M, Van Den Berge V, Lambotte L, Horsmans Y. Early down-regulation of cytochrome P450 3A and 2E1 in the regenerating rat liver is not related to the loss of liver mass or the process of cellular proliferation. Liver. 2000;20:405–10. doi: 10.1034/j.1600-0676.2000.020005405.x. [DOI] [PubMed] [Google Scholar]
- 25.Rivory LP, Qin H, Clarke SJ, Eris J, Duggin G, Ray E, et al. Frequency of cytochrome P450 3A4 variant genotype in transplant population and lack of association with cyclosporin clearance. Eur J Clin Pharmacol. 2000;56:395–8. doi: 10.1007/s002280000166. [DOI] [PubMed] [Google Scholar]
- 26.von Ahsen N, Richter M, Grupp C, Ringe B, Oellerich M, Armstrong VW. No influence of the MDR-1 C3435T polymorphism or a CYP3A4 promoter polymorphism (CYP3A4-V allele) on dose-adjusted cyclosporin A trough concentrations or rejection incidence in stable renal transplant recipients. Clin Chem. 2001;47:1048–52. [PubMed] [Google Scholar]


