Abstract
Reduced blood flow due to obstruction is in most cases a primary factor in pressure ulcer formation and creation of bedsores. The aim of this study is to design and manufacture a care system for tissue under pressure, based on variations in blood flow at different depths of tissue. In the manufacture of the system two infrared light transmitters and receivers were located between 5 and 10 mm depth to measure the flow of blood at different in the under- pressure heel tissue. In addition, blood flow was evaluated in an unloaded and loaded condition, with 30 mmHg and 60.0 mmHg. A total of 15 people participated with a mean age of 50. Of these 15; 9 (60%) were men and 6 (40%) were women. Primary measurement results showed different individual differences in variation of blood flow in the tissue. To study signal amplitude changes significantly influenced by external pressure the PPG, P-value was measured. It was noted that there were significant changes in PPG signal amplitude during loading both pressures of 30 and 60 mmHg. Further development of this system would be possible with the use of a more flexible probe and by using a stronger optical receiver and transmitter to access more depth.
Keywords: Bed sore, blood flow, photoplethysmography, pressure ulcers
INTRODUCTION
One of the human being's primary concerns is the damages caused by reduced blood flow in tissues and formation of bedsores or decubital ulcers under permanent contact and pressure of the body parts with an external base. For the most part, when the animate being's body remains stable on a base for a long time cells near the pressure area cannot acquire the metabolism supplies due to blood loss. Also, they cannot excrete the waste material from the surrounding area and they will be soon wasted forming wounds called bedsore. When tissue starts to destruct, it can be spread throughout the soft tissue and eventually the bone structure. Destruction of the tissue under pressure is caused by the long pressure increase on the epidemic layer of the skin and the soft tissues near projecting bone areas. There are some factors that increase the destruction of the tissue under pressure, blood flow illnesses, tissue being exposed to high temperature, moisture as well as cutting stress, i.e., friction between skin and bone that can pull or block blood vessels, are among them. For example, patients who suffer from a nerve lesion or a physical ailment have to be motionless in a bed or on a wheelchair or be in a limited situation where there is a permanent contact of their body with these equipments, primary symptoms of the bedsore to tissue destruction is obvious.[1,2] Those who spend longer times on motionlessness due to senility, amputation, or those with broken pelvis and spinal damage, for instance, are exposed to tissue destruction under pressure.[2–4] This is why studying such phenomenon and its prospects is a necessity for health and discussing this issue and how structure of soft tissue is influential, and theoretical and digital methods of limited components, experimental and pathological data of the soft tissue are of importance in scientific papers and conferences.[1–3] There are different tools to prognosticate the destruction of the tissue under external pressure, including measuring blood flow changes via indicator materials, biochemical measurement, temperature measurement, and photo plethysmograph (PPG) and blood supply.[1,5] In measuring blood flow changes via indicator materials, first, there is no precise measurement available, second, this method is highly sensitive to motion.[1] The biochemical measurement method needs specific pieces of invasive operations which are not plausible clinically. Another method to make an early prognosis of bedsore lesions is temperature measurement. In this method, skin temperature changes are considered as a reaction from blood flow of the area that can show ischemia or hyperemia amplitude.[6] First of all, the temperature increase in a part can be caused by other factors such as inflammatory lesions not hyperemia after loading pressure. Second of all, temperature measurement needs to be recorded and controlled in long terms by precise thermocouples, therefore, utilizing this method, too, will not be efficient for limitations stated. But, since on the one hand, ischemia is the key factor in pressure on the tissue due to vessel obstruction, and on the other hand, based on various papers we can indicate ischemia via blood flow changes measurement,[7–10] so blood flow can be an appropriate parameter to study tissue function when it is under external pressure. PPG is a noninvasive method shining invisible infrared light to the tissue and the ray reflected from the tissue demonstrate blood flow changes.[11–13] A PPG signal is used for studying external pressure changes in blood vessels, blood flow reaction to external pressure of tissue, probable potentiality of bedsores cure, and determining reactional ischemia and hyperemia.[12,14] Our aim here is to measure blood flow changes in different layers of the tissue under pressure by the PPG method. This aim will be achieved by designing a double-ducted PPG probe. In designing this probe, two infrared LED transmitters are located at a distance of 5 and 10 mm from the receiver so that blood flow changes can be measured in different layers of the tissue to prognosticate the destruction of the tissue under pressure. Therefore, with the probe designed, tissue function when external pressure is loaded will be analyzed by measuring blood flow changes in different layers.
MATERIALS AND METHODS
Optical Transmitter's Designing and Constructing
In designing this system, two infrared optical sensors (two optical transmitters) with 915 and 950 nm wavelengths and an optical receiver is employed. The optical transmitters are located at a distance of 5 and 10 mm from the optical receiver, respectively, so that blood flow of the tissue under pressure can be studied in different layers of the tissue. For primarily pre-elimination on the signal, the outlet of the optical receiver is inserted in a precise amplifier medium made in Germany and EU called AD620*. Since the PPG signal has DC frequency components to 30 Hz frequency, to eliminate low frequency distortions caused by skin absorption, bone, and other nonpulsatory tissues a passive high pass filter with 0.5 Hz cutout frequency, and to eliminate high-frequency noises greater than 30 Hz a passive low pass filter as well as two active low pass filters of second degree with 20 Hz cutout frequency are employed. Moreover, to have a signal with an appropriate range, an amplifier with variable interest is utilized. While recording, the recorded signal might have a positive voltage level as well as a negative voltage level and since converting analog data into digital and controlling circuit interest via microcontroller is not possible with negative voltage level, in the last level of the circuit a level changer1 is used to shift the voltage level into an appropriate range, i.e., 0-5 V positive voltage level.[15] The outlet of the designed analog circuit was inserted into an analog-to-digital changer of ATMEGA 32 microcontroller so that the analog signal can be transferred digitally to the computer.[16] A software medium (Microsoft Visual C#.NET) is used to display, save, process, and software analyzing of the signal in the computer. With the help of a gate, PPG data serial is arrayed in a 512-byte buffer. Code 13 was used in transferring the data as the end of the data. After adding the serial port to the software, a receiving line from the port is activated. When the data are transferring to the computer, they will be arrayed until code 13 is received. When receiving data from serial gate activates, software runs the related subprogram. In this subprogram, the buffer is read and saved in codes 0 and 1 in a 750-byte array. Reason to use a 750-byte array is that it should be displayed as a signal on the monitor with 750 pixels wide screen and that a counterpart width with the saved digit is displayed for each pixel. Also, in order to display, it recovers each and every 100 millisecond of the screen and the signal is displayed. Figure 1 is the block diagram of the main participants of the designed amplifier and Figure 2 a view of the software designed. Since the designed probe includes two optical transmitters, probe ducts are composed of two transmitters and an optical receiver. By changing the distance between transmitters and optical receiver we can assess blood flow changes of the tissue under pressure in different layers of the tissue.[9–11] A view of the probe is also shown in Figure 3. After inserting data into computer, in order to process and extract different recorded signals’ characteristics, MATLAB software was utilized.
Figure 1.
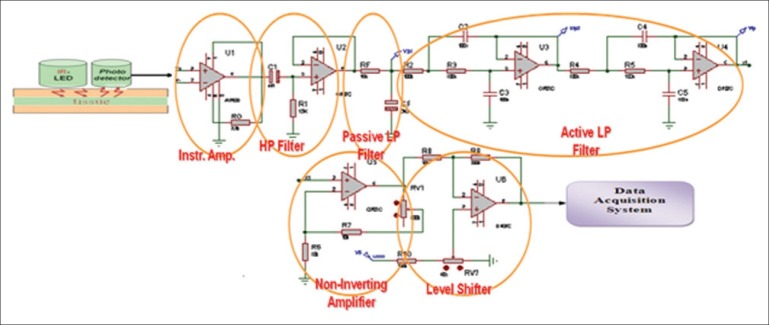
The block diagram of the main participants of the designed amplifier
Figure 2.
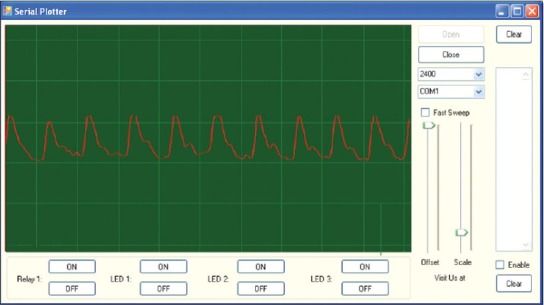
View of the software designed
Figure 3.
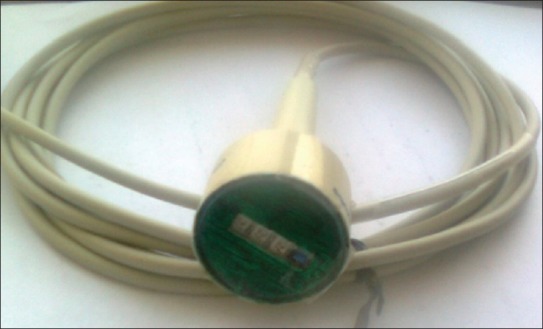
View of probes designed
Subjects
A total of 15 subjects both male and female with mean age of 54 (between 34 and 67) participated in this research. Nine of them were men and 6 women. They have 26.96±2.64 mean BMI, 134±8.9 diastolic mean, and 93±7.7 systolic mean. A 3-minute recording was taken for each subject. Subjects were chosen from various ages randomly. All of them were informed well about how to record the data and to observe the primary principles in information recording. All experiments were carried out in a 22--25°C room and characteristics of all subjects were saved for the sake of data recording. The subject was asked to lie on the bed and pressure cuff with a sensor in it was fastened to his left heel. First, cuff and sensor were fixed somewhere on the left heel and PPG changes at two distances recorded in 20-second intervals, changing the way the optical transmitters turn on. Afterward, cuff was inflated 30 mm Hg and to eliminate the primary and transient factors we waited for a while and then recording started for 20 seconds by turning the first transmitter on. After data recording in this interval, we waited for a while so that blood flow in the studying part returns to its normal status. Subsequently, the second transmitter turned on and like the previous step recording process repeated. In the last step, cuff inflated 60 mm Hg and by changing the method of turning the transmitters on and off in this status, signal became stable. Turning the transmitters on and off was controlled by programming in micro. When recording data, the location of the recording has been the same and conditions, as much as possible, were selected in a way that if data recording repeats the subject's data remain the same in successive recordings (replicability of recoding process). Because specifications of the tissue under study are different in physiological conditions for each person, before loading pressure on the tissue a PPG signal at two layers was recorded for each person separately so that we can compare it with recorded signals that are measured individually, when pressure is loaded. Recorded data were saved in the computer via a 50 Hz sampling rate probe and processed with MATLAB software. First, signal DC eliminated with a high pass filter of 0.2 Hz cutout frequency; then, appropriate parameters for analyzing were extracted from the recorded signal.
Data's Extracted Parameters
To know how recorded signals’ effective range changes with loading pressure on the tissue IAV† extracted. This parameter is stated in equation 1 where X[N] is the signal, and N is the length of the recorded data which equals 1000 samples of the recorded data here.[17]

This parameter helps us witness changes of signal's effective range with changing pressure on the tissue. To display percentile changes in signal's effective range, first, signal's effective range in no pressure conditions at two distances considered as the reference level and then range changes in 30 and 60 mm Hg were stated in percentage terms based on this level. Results gained in percentage terms would throw light on the signal's range change by changing pressure. Also, with the help of the P-value parameter, meaningful changes of the signal under different pressures at two distances were evaluated. This criterion gives us an appropriate severance at two different distances. This parameter's magnitude was calculated by Wilcoxon test utilizing MATLAB software.
RESULTS
Results from data recording by using the designed probe showed that by employing a 915 nm wavelength optical sensor at a distance of 5 mm from the receiver, measuring blood flow changes to almost 3 mm deep became feasible. Moreover, using a 915 nm optical transmitter at a distance of 10 mm from the optical receiver, measuring blood flow changes in almost 10 mm deep will be possible. Therefore, by utilizing the sensor on the tissue under pressure, blood flow changes was evaluated in different depths. Table 1 shows changes of signal's effective range when pressure is changed using IAV. In this table, one can clearly notice the way the signal range changes when pressure is changed. According to the results, when pressure on the tissue increases PPG signal range (data variance) in both depths under study decreases for everybody. And, recorded PPG signal's range at the first distance was relatively greater than that of the same at the second one. In addition, looking at the recorded signals’ effective range among subjects, magnitude difference was quite clear. In Table 1, the way recorded data's range change has been expressed in percentage terms, as well. The greater the pressure, the lesser the change in data's range. Moreover, recorded signal's range with 60 and 30 mmHg pressure showed greater difference compared with the first range. According to the P-value evaluation's results, meaningful changes were evident when pressure increases in comparison with the time when there was no pressure (P<0.05). Plus, the parameter gained with 60 mmHg pressure was less than that of 30 mm Hg. To have an appropriate analysis of the pressure effect on a PPG signal range, a record with 0, 30, and 60 mm Hg pressure and a 915 nm transmitter at a distance of 5 mm from the receiver was taken, as an example shown in Figure 4. Noticing Figure 4, one can clearly discern that recorded PPG signal's range decreases when pressure increases. Also, with 60 mm Hg pressure on the tissue under study and signal range decrease to almost 0, signal range increases after a short time. This phenomenon is caused by reactional hyperemia of the tissue under pressure. In order for the tissue to return to its normal nutrition before loading pressure, blood flow of that part of the tissue will face a sudden increase. However, magnitude and duration of the reactional hyperemia depends on tissue conditions, external pressure, period of time as well as whether tissue has been under pressure before or not. Figure 5 also shows changes of recorded signal's power when pressure is loaded. This figure also clarifies range decrease when pressure increases.
Table 1.
Changes of the signal's effective range when pressure is changed using IAV
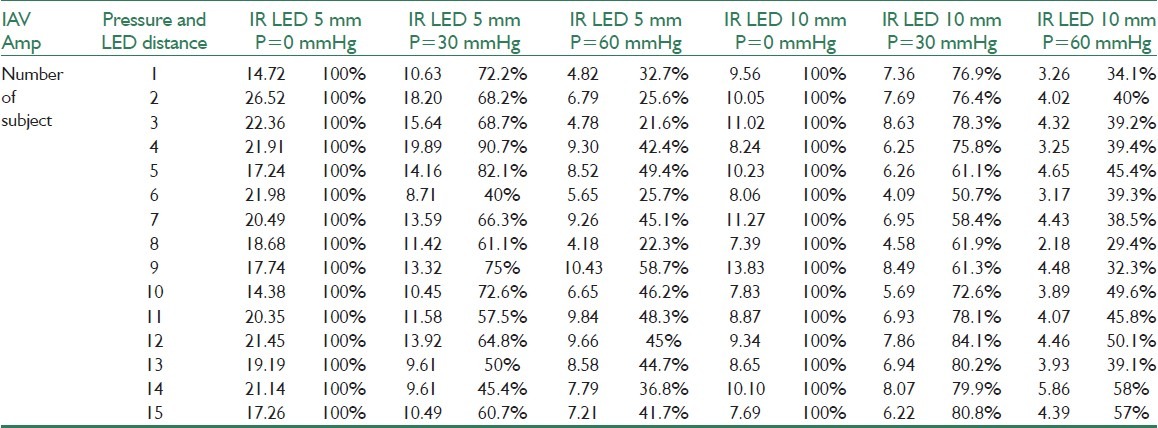
Figure 4.
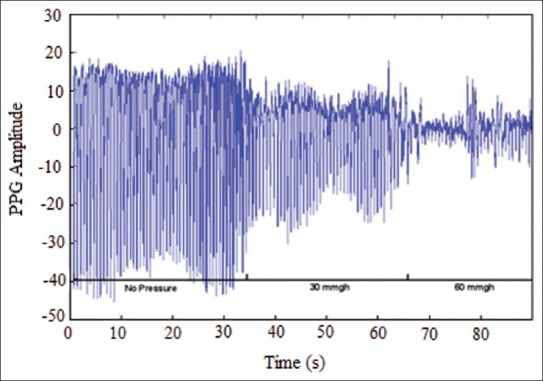
PPG signal recorded at the time of the pressure 0 and 30 and 60 mmHg
Figure 5.
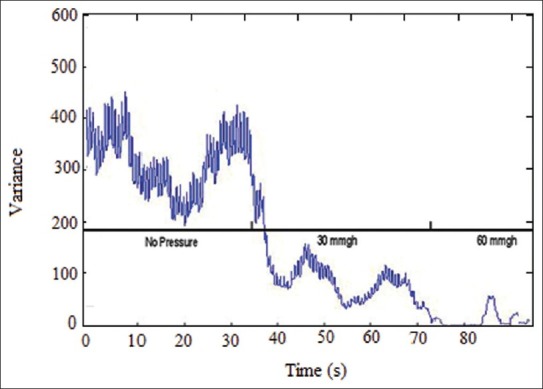
Changes of recorded signal's power when pressure is loaded
DISCUSSION
In this study, blood flow changes in different layers of the tissue were measured by designing a noninvasive optical system. This system allows us to analyze the possibility of tissue's blood flow changes in different layers of the tissue under pressure via infrared wavelength to maximum 10 mm deep by distance change between optical transmitter and receiver. Based on the results, one can obviously notice signal range decrease when pressure on the tissue increases in different layers. Hence, we can reach an early diagnosis to prognosticate destruction of the tissue under pressure. detection of blood flow changes in different depths of the tissue would be practical for various functions, fetal blood percentile of oxygen saturation,[18] evaluation of the fetal heart rate changes,[19] and similar works to this study such as evaluation of the blood flow in the tissue under pressure with Doppler flowmeter, among them.[9,10,11,20] In Hagblad and the partners’ study, Doppler flowmeter was used to analyze blood flow changes with pressure on the tissue putting 4–10 kg weights on trapezius, and blood flow changes was analyzed regarding the pressure weights load on the tissue.[11] Also, in Ek and the partners’ study, with 35–50 mm Hg pressure equivalent to the pressure when one lies on the bed and employing Doppler flowmeter to measure blood flow for only elderly people, function of the tissue under pressure was assessed.[20] In studies done in this scope, color change of the optical sensors with green, red, and infrared wavelengths, blood flow is analyzed in different depths of the tissue.[11,20] This study measures blood flow changes in different depths with a wavelength and with changing distance between receiver and transmitter. Though the research's data collection is same as other studies quantitatively, it has more variety in terms of samples comparing similar works. It is noteworthy that in studies done to evaluate blood flow changes, this fact should not be forgotten that the pressure level for decreasing blood flow range of the area under study or blood flow deformation of that area is quite personal and depends on general conditions and the conditions in which a part of the tissue is put under pressure.[20,21] Therefore, blood flow changes with the same pressure on the tissue is not a harmonic, specific, and predetermined pattern for different people. The factor above has challenged designing a noninvasive system to monitor blood flow changes of the tissue under pressure. In this study, to solve this problem PPG signal range has been recorded before and after different pressures individually and each subject's signal range changes, when pressure is loaded, is pondered with the same subject's PPG signal's primary range level and change percentile has been evaluated so that a pattern of blood flow changes be available for each person and destruction of the tissue under pressure be stopped. After loading the first pressure on the tissue, in order for the tissue to return to its normal blood supply before loading pressure, it will undergo a phenomenon called reactionable blood flow increase because with which the weakened blood flow of the tissue under external pressure is compensated and the cells near pressure zone will return to their normal blood supply. The sudden change in recorded PPG signal range with 60 mm Hg pressure after tissue's cessation of blood flow is because of the reactionable blood flow increase. Hence, considering and clarifying this point would play a significant role in prognosticating primary symptoms of bedsores. In this research, to study changes of blood flow in the tissue under pressure in deeper than 10 mm depths, yet another optical transmitter added to the previous ones at a distance of 15 mm. But, because the new one was not sensitive sufficiently we could not reach any plausible response. Therefore, because of impossibility of signal recording with an appropriate range even when there was no pressure, recording and analyzing the signal at this distance was not possible. In spite of all these remarks, other parameters with less influence are still effective on destruction of the tissue under pressure and can be highly influential in estimating tissue destruction time. Of these parameters, temperature of the tissue under study, moisture effect, location of the tissue under study, stress and many other cases.[1,5,6,8] In this research, we have tried to eliminate moisture effects by stabilizing temperature and moisture of the environment and the location of the tissue. Considering other factors is of importance, anyway. We have examined heels here whereas stress level in other highly dangerous points for bedsore formation shall also be studied. Additionally, distance between receivers and transmitters and also their wavelength are designed to clarify blood flow changes in heels, and, if blood flow changes in other highly dangerous points are evaluated, evaluation in different depths of the tissue under pressure would be possible by changing transmitter's wavelength or distance between receiver and transmitter. Another important point in recording data is the way pressure is loaded on the tissue under study. In destruction of the tissue under pressure, horizontal and vertical stress factors would simultaneously be effective. We have overlooked horizontal stress factor in the tissue when pressure is loaded. Analyzing these factors’ effects is suggested in further studies.
CONCLUSION
In this study, with the help of the optical sensor construction and PPG signal recording and loading various pressures, treatment of the tissue under pressure was assessed based on the blood flow changes. Results indicate that by means of the designed sensor and in depths less than 10 mm Hg blood flow changes is well evaluated. They also reveal meaningful changes in different pressures assessing PPG signal's effective range. In conclusion, PPG range changes are an appropriate parameter to evaluate blood flow changes and by measuring it in different layers of the tissue with the constructed system, an early prognosis of the tissue under pressure will be possible up to 10 mm deep.
BIOGRAPHIES

Akbari Hadi was born in mashad, Iran, in 1982. He received his BS degree in electrical engineering in 2005. In 2009, he received his MS degree in bioelectric. His main research interests are biosignal processing and biosensor.
E-mail: hadi.akbari86@gmail.com

Younessi Heravi Mohammad Amin was born in mashad, Iran, in 1983. He received his BS degree in electronic engineering in 2006. In 2009, he received his MS degree in bioelectric. Currently, he is a Supervisor of student research committee at the North Khorasan University of Medical Sciences. His main research interests are bio signal processing, bio sensor and bio medical application and intelligent systems data transmission for biomedical applications and intelligent implantable monitoring systems.
E-mail: a.younessi7@gmail.com
ACKNOWLEDGMENTS
Our sincere thanks go to engineer Dehghan and engineer Izadi who helped us provide necessary tools and parts to construct the sensor and also an appropriate place to record different people's data.
Footnotes
Source of Support: Nil
Conflict of Interest: None declared
AD620: low Power & Low Drift Instrumentation Amp ANALOG DEVICES CO
Integral of absolute value
REFERENCES
- 1.Webster JG, editor. Prevention of pressure sores: engineering and clinical aspects. Bristol, England: Adam Hilger; 1991. [Google Scholar]
- 2.Torrance C, Maylor M. Pressure sore survey. Part one. Wound Care. 1999;8:27–30. doi: 10.12968/jowc.1999.8.1.25829. [DOI] [PubMed] [Google Scholar]
- 3.Lindgren M, Unosson M, Fredrikson M. Immobility a major risk factor for development of pressure ulcers among adult hospitalized patients: A prospective study. Caring Sci. 2004;18:57–64. doi: 10.1046/j.0283-9318.2003.00250.x. [DOI] [PubMed] [Google Scholar]
- 4.Severens JL, Habraken JM, Duivenvoorden S, Frederiks C. The cost of illness of pressure ulcers in the Netherlands Adv. Skin Wound Care. 2002;15:72–7. doi: 10.1097/00129334-200203000-00008. [DOI] [PubMed] [Google Scholar]
- 5.Kosiak M. Etiology and pathology of ischemic ulcers. Arch Phys Med Rehabil. 1959;40:62–9. [PubMed] [Google Scholar]
- 6.Kemuriyama T, Nitsuma J, Yano H. An analysis of skin temperature changes under pressure loading and relief by animal experiments. Proceedings of the 20th Annual International Conference of the IEEE. 1998;5:2729–30. [Google Scholar]
- 7.Jonsson A. Pressure Sore Etiology-Highlighted with Optical Measurements of the Blood Flow. University Press Licentiate Theses. 2009 [Google Scholar]
- 8.Stewart FC, Palmieri V, Cochran VB. Wheelchair cushion effect on skin temperature, heat flux, and relative humidity. Phys Med Rehabil. 1980;61:229–33. [PubMed] [Google Scholar]
- 9.Nilsson G, Akeberg P. Evaluation of a laser Doppler flowmeter for measurement of tissue blood flow. IEEE Trans Biomed Eng. 1980;27:597–604. doi: 10.1109/TBME.1980.326582. [DOI] [PubMed] [Google Scholar]
- 10.Salerud G, Nilsson G. Intergrating probe for tissue laser Doppler flowmeters. Med Biol Eng Comput. 1986;24:415–9. doi: 10.1007/BF02442697. [DOI] [PubMed] [Google Scholar]
- 11.Hagblad J, Lindberg L, Kaisdotter A, Bergstrand S, Lindgren M. A technique based on laser Doppler flowmetry and photoplethysmography for simultaneously monitoring blood flow at different tissue depths. Med Biol Eng Comput. 2010;48:415–22. doi: 10.1007/s11517-010-0577-2. [DOI] [PubMed] [Google Scholar]
- 12.Zweifler AJ, Cushing G, Conway J. The relationship between pulse volume and blood flow in the finger. Angiology. 1967;18:591–8. doi: 10.1177/000331976701801001. [DOI] [PubMed] [Google Scholar]
- 13.Sandberg M, Zhang M, Styf J, Gerdle B, Lindberg LG. Non-invasive monitoring of muscle blood perfusion by photopletysmography: Evaluation of a new application. Acta Physiol. 2005;183:335–43. doi: 10.1111/j.1365-201X.2005.01412.x. [DOI] [PubMed] [Google Scholar]
- 14.Zhang Q, Lindberg LG, Kadefors R, Styf J. A non-invasive measure of changes in blood flow in the human anterior tibial muscle. Eur J Appl Physiol. 2001;84:448–52. doi: 10.1007/s004210100413. [DOI] [PubMed] [Google Scholar]
- 15.Zikic D. An improved reflective photoplethysmograph probe design for detection of an arterial blood flow. Med Eng Technol. 2008;32:23–9. doi: 10.1080/03091900600703529. [DOI] [PubMed] [Google Scholar]
- 16.John E. Microcomputers and microprocessors the 8085, 8086, AVR programming, 1989 [Google Scholar]
- 17.Onaral B. sec. 4. BIO Signal Analysis. 2nd ed 2002. The Biomedical Engineering Handbook. [Google Scholar]
- 18.Zourabian A, Siegel A, Chance B, Ramanujan N, Rode M, Boas DA. Trans-abdominal monitoring of fetal arterial blood oxygenation using pulse oximetry. Biomed Opt. 2000;5:391–405. doi: 10.1117/1.1289359. [DOI] [PubMed] [Google Scholar]
- 19.Gan KB, Zahedi E, Mohd MA. Transabdominal fetalheart rate detection using NIR photopleythysmography: Instrumentation and clinical results. IEEE Trans Biomed Eng. 2002;56:2075–82. doi: 10.1109/TBME.2009.2021578. [DOI] [PubMed] [Google Scholar]
- 20.Bergstrand S, Lindberg LG, Ek A, Lindén M, Lindgren M. Blood flow measurements at different depths using laser Doppler techniques. Skin Res Technol. 2009;15:139–47. doi: 10.1111/j.1600-0846.2008.00337.x. [DOI] [PubMed] [Google Scholar]
- 21.Ek AC, Gustavsson G, Lewis DH. Skin blood flow in relation to external pressure and temperature in the supine position on a standard hospital mattress. Scand J Rehabil Med. 1987;19:121–6. [PubMed] [Google Scholar]


