Abstract
In the pathogenesis of diabetic retinopathy, an increase in retinal oxidative stress precedes mitochondrial dysfunction and capillary cell apoptosis. This study is designed to understand the mechanism responsible for the protection of mitochondria damage in the early stages of diabetic retinopathy. After 15 days–12 months of streptozotocin-induced diabetes in rats, retina was analyzed for mitochondria DNA (mtDNA) damage by extended length PCR. DNA repair enzyme and replication machinery were quantified in the mitochondria, and the binding of mitochondrial transcriptional factor A (TFAM) with mtDNA was analyzed by ChIP. Key parameters were confirmed in the retinal endothelial cells incubated in 20 mM glucose for 6–96 h. Although reactive oxygen species (ROS) were increased within 15 days of diabetes, mtDNA damage was observed at 6 months of diabetes. After 15 days of diabetes DNA repair/replication enzymes were significantly increased in the mitochondria, but at 2 months, their mitochondrial accumulation started to come down, and mtDNA copy number and binding of TFAM with mtDNA became significantly elevated. However, at 6 months of diabetes, the repair/replication machinery became subnormal and mtDNA copy number significantly decreased. A similar temporal relationship was observed in endothelial cells exposed to high glucose. Thus, in the early stages of diabetes, increased mtDNA biogenesis and repair compensates for the ROS-induced damage, but, with sustained insult, this mechanism is overwhelmed, and mtDNA and electron transport chain (ETC) are damaged. The compromised ETC propagates a vicious cycle of ROS and the dysfunctional mitochondria fuels loss of capillary cells by initiating their apoptosis.
Keywords: Diabetic retinopathy, Mitochondria, mtDNA biogenesis, mtDNA damage
Introduction
Diabetic retinopathy is a slow progressing eye disease that is rarely detected in the initial years of diabetes, but after 25–30 years of the disease almost 90% of patients have some form of retinopathy [1,2]. Due to sustained hyperglycemia, retinal metabolism is disrupted, and this leads to accelerated apoptosis of retinal cells, and the cell apoptosis precedes the histopathology characteristic of diabetic retinopathy [3–5].
Diabetes increases oxidative stress, and mitochondrial superoxide radicals are considered to act as a common connection between pathways triggered by hyperglycemia that induce vascular damage in diabetic complications, including retinopathy [6]. Our previous studies have shown that in rodent model of diabetic retinopathy, despite an increase in oxidative stress and other metabolic abnormalities at 2 months of diabetes [7,8], retinal mitochondria are intact, but at 6 months of diabetes they become dysfunctional and cytochrome c levels are increased in the cytosol and capillary cell apoptosis can be detected [9]. Mitochondrial dysfunction is followed by accelerated apoptosis of retinal capillary cells, a phenomenon that can predict the development of microvascular histopathology of diabetic retinopathy [4].
Mitochondrial DNA (mtDNA), which encodes electron transport chain (ETC) proteins, is highly sensitive to oxidative stress [10]. Diabetes damages retinal mtDNA and decreases its copy number [11,12], and the damage at the regulatory region of mtDNA, the displacement loop (D-loop), is considerably higher compared to other portions of the mtDNA [13]. In addition, the enzymes important for mtDNA repair, 8-oxoguanine DNA glycosylase (OGG1), MutY homolog, and thymine DNA glycosylase, become subnormal, and the transcription and replication mechanisms, including mitochondrial transcription factor A (TFAM) and polymerase gamma (POLG), are also compromised [11–13]. However, the temporal relationship between the onset of diabetes and mtDNA damage in retina is not known.
In the present study, we have investigated the mechanism responsible for the protection of retinal mitochondria from oxidative stress-induced damage by investigating the temporal relationship between the duration of diabetes and the mtDNA damage and repair machinery. Our hypothesis is that in the early stages of diabetes, a compensatory mechanism is initiated to protect mtDNA from being damaged by reactive oxygen species (ROS), but as the hyperglycemia persists, this mechanism is exhausted, mtDNA is damaged, and the damaged ETC system continues to produce ROS.
Methods
Rats
Diabetes was induced in Wistar rats (male, 200 g) by injecting streptozotocin (55 mg/kg body weight). The animals were sacrificed at 15 days, 2, 6, or ~12 months of diabetes, and the retina was immediately isolated. Age-matched normal rats were used as control [9,12,14]. Treatment of rats was carried out as per the guidelines of National Institute of Health principles of laboratory animal care and the Association for Research in Vision and Ophthalmology resolution on the use of animals in research, and the institutional guidelines.
Retinal endothelial cells
Retinal endothelial cells were isolated from calf retina (BRECs) and were cultured to 80% confluence on polystyrene dishes coated with 0.1% gelatin [12,13,15]. Cells from the 5th–6th passage were incubated in Dulbecco’s modified Eagle medium (DMEM) containing 2% heat-inactivated fetal bovine serum, 10% Nu-serum, 50 μg/ml heparin, 1 μg/ml endothelial growth factor, and antibiotic/anti-mycotic supplemented with 5 mM glucose or 20 mM glucose for 6, 24, 48, or 96 h. At the end of the desired duration, the cells were trypsinized, washed with ice-cold PBS, and used for analysis.
Reactive oxygen species
Total ROS were accessed by the 2′,7′-dichlorofluorescein diacetate (DCHFDA; Sigma-Aldrich, St. Louis, MO) method. Briefly, 5–10 μg of protein (retina or BRECs) was incubated in PBS with 2 μM DCHFDA for 10 min and fluorescence was measured at 485 nm excitation wavelength and 530 nm emission wavelength [16,17].
Damage of mtDNA and D-loop region
DNA was isolated using a DNeasy blood and tissue kit (Qiagen, Valencia, CA), and quantified by the Quant-iT dsDNA assay (Invitrogen, Carlsbad, CA). Primers for rat and bovine PCR were designed using primer Express-3 software (Table 1) and synthesized by Integrated DNA Technologies (Coralville, IA). DNA damage was evaluated by amplifying long and short mtDNA regions using extended length PCR and conventional PCR, respectively, employing the conditions routinely used in our laboratory [11–13]. To evaluate mtDNA damage at the D-loop region, conventional PCR was performed using primers spanning around 819 bp (semilong fragment) and shorter fragment of 146 bp. The quantitative analysis was done by measuring the intensity of PCR gel photographs using Un-Scan-It Gel digitizing software and by quantifying the ratio between the long (or semilong) and the short fragment of PCR amplicons [11–13].
Table 1.
Primers for the target genes.
| Target | Sequence | |
|---|---|---|
| Rat-DNA | ||
| mtDNA long | Forward | 5′-AAAATCCCGCAAACAATGACCACCCC-3′ |
| Reverse | 5′-GGCAATTAAGAGTGGGATGGAGCCAA-3′ | |
| mtDNA short | Forward | 5′-CCTCCCATTCATTATCGCCGCCCTTGC-3′ |
| Reverse | 5′-GTCTGGGTCTCCTAGTAGGTCTGGGAA-3′ | |
| D-loop, long | Forward | 5′-TTGTGCTGACCTTCATGCCTTGACG-3′ |
| Reverse | 5′-TGGGGATTGAGCGTAGAATGGCGT-3′ | |
| D-loop, short | Forward | 5′-CCTCCGTGAAATCAACAACC-3′ |
| Reverse | 5′-TAAGGGGAACGTATGGACGA-3′ | |
| Cytb | Forward | 5′-TGACCTTCCCGCCCCATCCA-3′ |
| Reverse | 5′-AGCCGTAGTTTACGTCTCGGCA-3′ | |
| COII | Forward | 5′-TGAGCCATCCCTTCACTAGG-3′ |
| Reverse | 5′-TGAGCCGCAAATTTCAGAG-3′ | |
| β-actin | Forward | 5′-AGCGAGCCGGAGCCAATCAG-3′ |
| Reverse | 5′-TGCGCCGCCGGGTTTTATAGG-3′ | |
| Rat-RNA | ||
| POLG | Forward | 5′-TGGGATGCATGGCTGCACGG-3′ |
| Reverse | 5′-AGGACTGCCCAGCCCCGTAG-3′ | |
| CytB | Forward | 5′-CCCACAGGATTAAACTCCGA-3′ |
| Reverse | 5′-GTTGGGAATGGAGCGTAGAA-3′ | |
| Sod2 | Forward | 5′-AATGTTGTGTCGGGCGGCGT-3′ |
| Reverse | 5′-AGGTCGCGTGGTGCTTGCTG-3′ | |
| β-actin | Forward | 5′-CCTCTATGCCAACACAGTGC-3′ |
| Reverse | 5′-CATCGTACTCCTGCTTGCTG-3′ | |
| BRECs-DNA | ||
| mtDNA, long | Forward | 5′-ATGAGTTGGTAGTTTCGGTTGGGGTG-3′ |
| Reverse | 5′-ATTCTGTGGTCTGTGTATGGGCGTGT-3′ | |
| mtDNA, short | Forward | 5′-CATACTCCTCTGTAAGCCACATAGC-3′ |
| Reverse | 5′-AGACTTGCTAGTAGTCATCAGGTGG-3′ | |
| D-loop, long | Forward | 5′-AACAGACGCAATCCCAGGCCG-3′ |
| Reverse | 5′-AGCTGTTAACCGCACGGCGA-3′ | |
| D-loop, short | Forward | 5′-TGCTTGGACTCAGCTATGGCCG-3′ |
| Reverse | 5′-TCATTATGCTGGTGCTCAAGATGCA-3′ | |
| COII | Forward | 5′-AAAGCCAGGGGAGCTACGACTATT-3′ |
| Reverse | 5′-CGGCCTGGGATTGCGTCTGTTT-3′ | |
| 18sRNA | Forward | 5′-TTGGTCGCTCGCTCCTCTCCT-3′ |
| Reverse | 5′-AGGAGGCTGACCGGGTTGGT-3′ | |
| BRECs-RNA | ||
| POLG | Forward | 5′-AGCCCCGCGAGCTGTTTGTC-3′ |
| Reverse | 5′-CACCGGGTGGGGACACCTCT-3′ | |
| β-actin | Forward | 5′-TGTTCCCTTCCACAGGGTGT-3′ |
| Reverse | 5′-TCCCAGTTGGTAACAATGCCA-3′ | |
RNA isolation and gene expression
Total RNA was extracted by Trizol reagent (Invitrogen) using the chloroform method. RNA (1 mg) was employed to make cDNA using a High Capacity cDNA reverse transcription kit (Applied Biosystems, Foster City, CA). Gene expressions of cytochrome b(Cytb) and Sod2, the gene encoding manganese superoxide dismutase, MnSOD, were measured by SYBR green-based real-time PCR (qPCR) with melting curve analysis on an ABI 7500 (Applied Biosystems) using rat Cytb and Sod2 gene-specific primers (Table 1). β-actin was used as a housekeeping gene, and quantification of the transcripts was done by ddCt method [18–20].
Isolation of mitochondria
Mitochondria were isolated according to the manufacturer’s protocol using a Mitochondria Isolation kit from Invitrogen (Pierce, Rockford, IL); these preparations were relatively free of other subcellular contaminations [12,13,21]. Mitochondrial protein (30–40 μg) was separated on an 8–20% SDS-PAGE, transferred to a nitrocellulose membrane, and blocked with 5% nonfat milk for 1 h. The membranes were incubated with the antibody against the protein of interest (POLG, OGG1, or TFAM; Santa Cruz Biotechnology, Santa Cruz, CA), and Cox IV (Molecular Probes, Eugene, OR) was used as a loading control.
Mitochondrial DNA copy number
MtDNA copy number was quantified by measuring the genomic DNA (gDNA) levels of cytochrome C oxidase subunit II (COII) and Cytb, and was normalized with that of ß-actin for retina and 18sRNA for BRECs. Each reaction was performed in duplicate using 10 ng gDNA and 0.5 μM each of forward and reverse primers. The thermal conditions included 10 min at 95 °C followed by 4 cycles of 15 s at 95°C and 60 s at 60°C. To assess the formation of specific PCR products, the PCR amplicons were also analyzed using 2% agarose gel [12,13].
Binding of the mitochondrial transcription factor A with mtDNA
The binding affinity of TFAM to mtDNA was assessed by chromatin immunoprecipitation (ChIP) at two different regions of mtDNA, D-loop and COII. Retina was cross-linked with 1% formaldehyde for 10 min and the DNA pull-down assay for mitochondrial D-loop or COII region was performed [13,22]. Briefly protein extract was precleared with protein A agarose/ salmon sperm DNA slurry and precleared protein was incubated with 2 μg of TFAM antibody (Santa Cruz Biotechnology) overnight at 4 °C. The antibody-protein-DNA complex was pulled down by protein A agarose and washed with buffers containing low salt, high salt, and LiCl. This was followed by washing twice with TE buffer. Reverse cross-linking was done and DNA was purified by phenol:chroloform:isoamyl alcohol extraction and ethanol precipitation, and DNA (1 ml) was used for D-loop or COII region PCR The input DNA was used as internal control to calculate the fold changes by the ddCt method used routinely by our laboratory [13,22].
POLG functional activity assay
POLG activity was measured by quantifying the new synthesis of mtDNA using the bromodeoxyuridine (BrDU) incorporation technique, as previously reported by us [13]. After the desired treatment of BRECs, the cells were incubated with a nuclear DNA polymerase inhibitor, aphidicolin (7 μM, Sigma-Aldrich) for 4 h. This was followed by incubation with fresh medium containing 15 μM BrDU and 7 μM aphidicolin for 6 h. Cells were then rinsed with PBS, fixed with cold methanol at −20 °C for 15 min, incubated with 2 N HCl for 30 min at 37 °C, and blocked with PBS containing 5% goat serum and 0.1% Triton X-100. Slides were incubated overnight at 4 °C with mouse BrDU antibody (Sigma Aldrich). Texas Red-conjugated anti-mouse IgG (Vector Laboratories, Burlingame, CA) was used as a secondary antibody. The coverslips were mounted in Vectrashield mounting medium (Vector Laboratories), and the red fluorescence image, corresponding to mtDNA synthesis, was visualized and captured using ZEISS ApoTome (Carl Zeiss, Chicago, IL, USA).
Mitochondria mass
Mitochondria mass was quantified in BRECs using MitoTracker green (Molecular Probes), a mitochondria-selective membrane potential-independent dye. The cells grown on 12-mm coverslips were incubated with 5 or 20 μM glucose for 6, 24, 48, and 96 h, and at the end of the incubation they were incubated with 200 nM MitoTracker green for 30 min. The green fluorescence intensity was examined under a Zeiss ApoTome using a 40x objective (Carl Zeiss) and analyzed using Image J software as previously reported by us and others [12,23].
Statistical analysis
Statistical analysis was calculated using Sigma Stat software. Data are expressed as means ± standard deviation. The Shapiro-Wilk test was used to test for normal distribution of the data and for variables with normal distribution, ANOVA followed by Bonferroni test was applied, and Kruskal-Wallis test followed by Mann-Whitney U test was used for data that did not present normal distribution. A P value of < 0.05 was considered statistically significant.
Results
Rat retina
ROS levels were significantly elevated in the retina as early as 15 days of diabetes, and remained elevated throughout the experiment (~12 months of diabetes; Fig. 1a). However, despite increase in ROS at 15 days of diabetes, mtDNA was not damaged till the duration of diabetes was extended; significant damage in mtDNA was observed when the duration of diabetes was extended to 6 months, and the damage continued at 12 months of diabetes (P < 0.05; Fig. 1b). This was accompanied by no effect of diabetes on the gene expression of mtDNA-encoded protein, Cytb, for at least 2 months of diabetes, but the levels of Cytb significantly decreased at 6 months of diabetes (Fig. 1c). Consistent with this, the damage to the D-loop region, the site of replication of mtDNA, was also not present at 15 days of diabetes, but by 2 months of diabetes the D-loop region showed significant damage, and this region remained damaged at 6 months of diabetes. The damage observed at 12 months was not significantly different from that observed at 6 months of diabetes (Fig. 1d). To evaluate the effect of duration of diabetes on the retinal antioxidant system, we quantified the gene expression of Sod2, and as shown in Fig. 1e, 15 days of diabetes had no effect on the gene expression of Sod2, but it was decreased by ~40% at 6 months of diabetes (Fig. 1e).
Fig. 1.
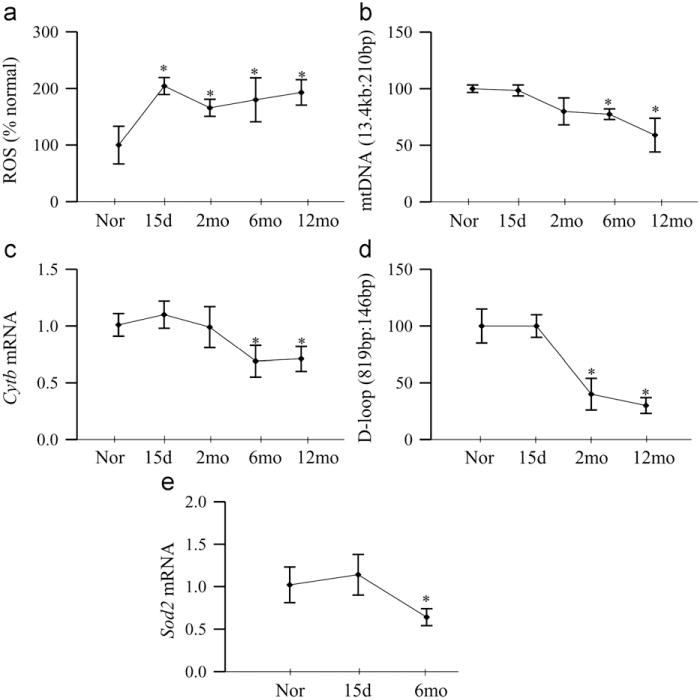
Effect of duration of diabetes on retinal ROS generation and mtDNA damage. (a) Total ROS were quantified in 5–10 μg of retina using 2 μM DCHFDA and fluorescence was measured at 485 and 516 nm using a fluorescence spectrometer. (b) Damage of mtDNA was evaluated by amplifying long (13.4 kb) and short (210 bp) regions by extended length PCR and conventional PCR, respectively. (c) Gene expression of CytB was quantified by real-time PCR; β-actin was used as an internal control (d). The damage to the D-loop region was evaluated by conventional PCR using 819-bp (semilong fragment) and 146-bp primers, and the products were separated on 2% agarose gel. (e) Gene expression of Sod2 was quantified by real-time PCR using β-actin as housekeeping gene. Measurements were made in duplicate, and each value represents the mean ± SD from 5 to 6 rats/group. Nor, normal; 15d, rats diabetic for 15 days; and 2mo, 6mo, and 12mo, rats diabetic for 2 months, 6 months, and 12 months, respectively. *P < 0.05 compared to normal.
To investigate the effect of the duration of diabetes on mtDNA repair/replication, POLG, an enzyme responsible for replication and repair mtDNA, was quantified. As shown in Fig. 2a, gene expression of POLG was increased by ~80% at 15 days of diabetes, but dropped down to normal values at 2 month of diabetes, and decreased by > 40% at 4 months of diabetes, and continued to be subnormal at 12 months duration. Consistent with this, mitochondrial accumulation of POLG was elevated at 15 days of diabetes, but came down at 2 months, and then decreased by over 70% when the duration was extended to 4 months and beyond compared to the values obtained from the age-matched normal rats (Fig. 2b). Mitochondrial oxidative DNA repair enzyme, OGG1, was measured in the mitochondria, the site of its action. As shown in Fig. 2c, consistent with POLG, the expression of OGG1 was significantly increased at 15 days of diabetes, but returned back to the normal level at 2 months, and at 6 months its accumulation in the mitochondria became significantly subnormal compared to the values from age-matched normal rat retina.
Fig. 2.
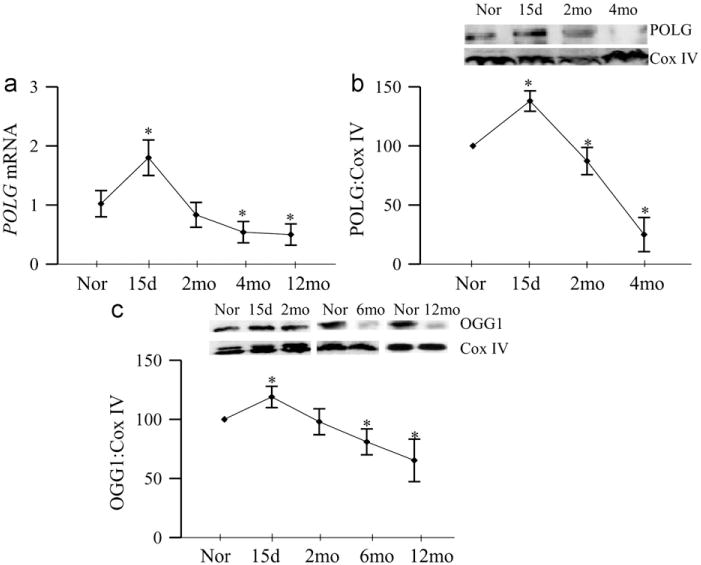
Duration of diabetes and mtDNA repair and replication enzymes. Retina from rats diabetic for 15 days to 12 months was analyzed for (a) gene expression of POLG by real-time PCR using β-actin as an internal control, and the mitochondrial levels of (b) POLG and (c) OGG1 were quantified by Western blot techniques using Cox IV as the loading control. Each value represents the mean ± SD from 5 to 6 rats/group. *P<0.05 compared to normal.
Copy number of mtDNA, quantified by assessing the gDNA of both COII and Cytb, was not altered at 15 days of diabetes, but at 2 months, the ratios of COII and ß-actin, and Cytb and ß-actin were increased by 2- to 3-fold. However, at 6 months of diabetes, the copy number decreased by ~30%, and remained subnormal at 12 months of diabetes compared to the values obtained from age-matched normal rats (Fig. 3a and b).
Fig. 3.
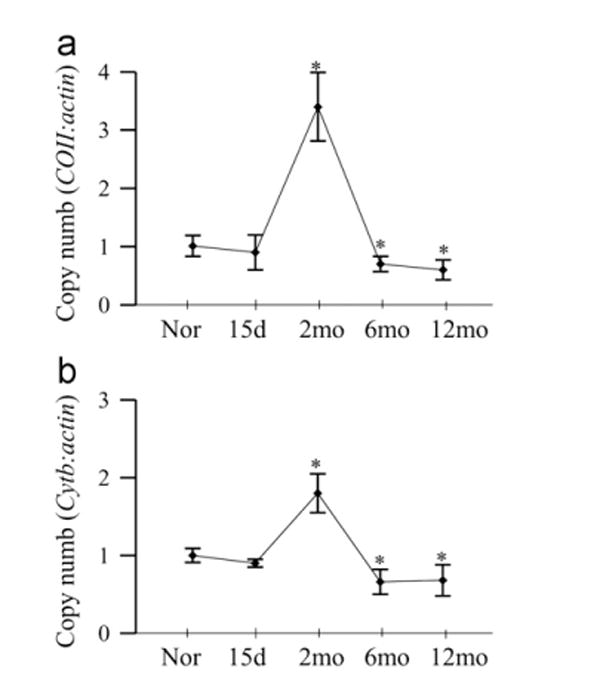
Effect of duration of diabetes on mtDNA copy number. Mitochondria DNA copy number was assessed by real-time PCR in 10 ng retinal gDNA using primers for (a) COII and (b) Cytb. The expression was normalized by that of nuclear gene β-actin. Values are presented as mean ± SD from 5 to 8 rats in each group. Nor, normal; 15d, rats diabetic for 15 days; and 2mo, 6mo, and 12mo, rats diabetic for 2 months, 6 months, and 12 months, respectively. *P <0.05 compared to normal.
TFAM is one of the most important transcriptional factor in the mtDNA biogenesis, and as shown in Fig. 4a, its levels in the mitochondria remain normal at 15 days of diabetes, significantly increased at 2 months of diabetes, but decreased by ~50% with the increasing duration of diabetes. Since TFAM binds to the D-loop region to initiate transcription and replication of the mitochondrial genome, the effect of duration of diabetes on the mtDNA transcription process was also investigated by quantifying the binding of TFAM to the D-loop region. At 2 months of diabetes, the binding of TFAM to the mtDNA was significantly increased compared to the normal rat retina (Fig. 4b). However, when the duration of diabetes was extended to 6 months, the binding was significantly decreased, and continued subnormal at 12 months of diabetes. Since TFAM is also a major component of the nucleoid [24], Fig. 4c shows that during the early stages of diabetes (up to 2 months) the binding of TFAM with COII region of mtDNA was significantly increased, but as with the D-loop region, at 6 months of diabetes, the binding of TFAM with COII region was compromised, and further extension of the duration to 12 months did not produce any significant decrease compared to the values obtained at 6 months of diabetes.
Fig. 4.
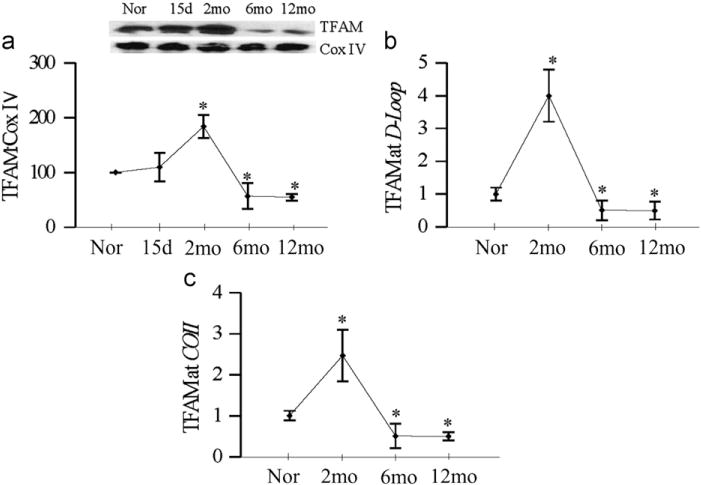
Duration of diabetes and TFAM. (a) TFAM expression was quantified in the mitochondria by Western blot techniques using Cox IV as loading control. For binding of TFAM to the (b) D-loop region and (c) COII region, cross-linked retina was subjected to ChIP assay using TFAM antibody, DNA was purified and real-time PCR for D-loop and COII regions was performed using specific primers. The values were normalized to input DNA and fold changes in binding of TFAM with D-loop and COII were calculated. Each measurement was made in 4–6 rats/group, and the values are represented as mean ± SD. *P < 0.05 compared to normal.
Retinal endothelial cells
High glucose exposure of endothelial cells resulted in an increase in ROS levels as early as 6 h, but the values did not achieve statistical significance. ROS levels continued to increases, and at 24 h of glucose insult, they were elevated by ~2-fold (Fig. 5a). In contrast, the damage to mtDNA was not observed in the initial stages, but became significant ( > 40%) at 96 h of glucose exposure (Fig. 5b). Consistent with this, significant damage at the D-loop region was also observed only when the duration of high glucose was extended beyond 48 h (Fig. 5c).
Fig. 5.
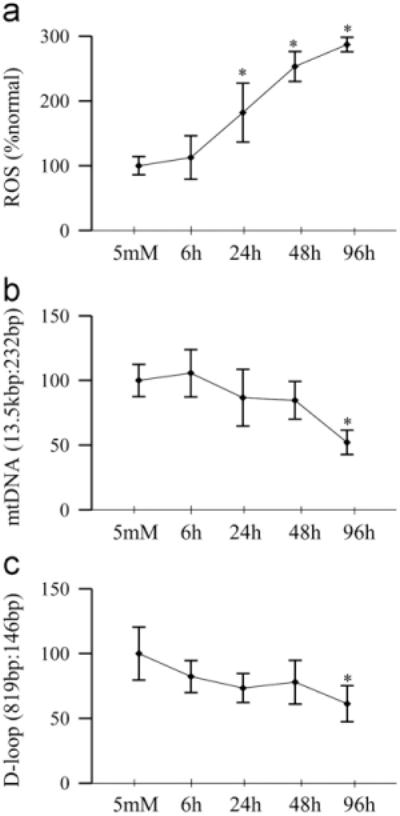
High glucose insult and mtDNA damage in retinal endothelial cells. (a) Total ROS levels were quantified by the DCHFDA method. (b) Damage to mtDNA was determined by extended length PCR using the ratio of long (13.5 kbp) and short (232 bp) amplicons. (c) D-loop damage was quantified by the amplification of semilong (819 bp) and short (148 bp) PCR fragments. Each measurement was made in duplicate using cells from 3 to 5 different preparations, and the values are represented as mean ± SD. 5 mM, 5 mM glucose; 6 h, 24 h, 48 h, and 96 h, 20 mM glucose treatment for 6 h, 24 h, 48 h, and 96 h, respectively. *P < 0.05 compared to 5 mM glucose.
As with the rat retina, mRNA levels of POLG were increased by ~ 75% at 6 h of glucose insult, but at 48 h, they were decreased by ~60% compared to the values obtained from cells incubated in normal glucose (Fig. 6a). Similarly, mitochondrial accumulation of POLG tended to increase at 6 h of high glucose exposure, but became significantly decreased at 24 h, and continued to be subnormal at 96 h of high glucose insult (Fig. 6b). Consistent with the mRNA levels of POLG, the functional activity of POLG increased by ~50% as early as 6 h of glucose insult, but became significantly subnormal at 48 h, and at 96 h the activity continued to be compromised (Fig. 6c). At 6 h of high glucose exposure, mtDNA copy number (ratio of COII and 18sRNA) was increased, but the values started to decline with the extension of the duration of glucose insult, and became significantly subnormal at 96 h compared to those obtained from cells exposed to normal glucose (Fig. 7a). However, mitochondrial mass, quantified by MitoTracker fluorescence, did not change for at least 48 h, but decreased by 40% at 96 h of glucose exposure (Fig. 7b).
Fig. 6.
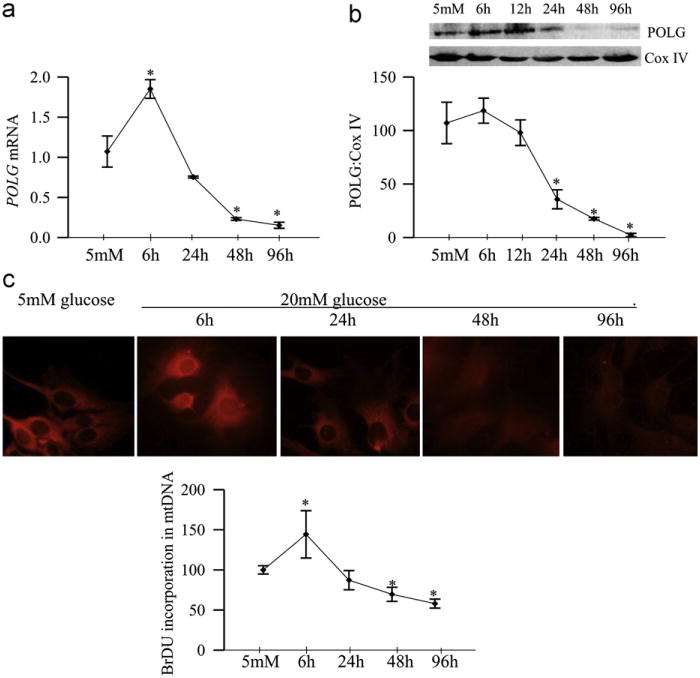
Glucose exposure and functional activity of POLG. Retinal endothelial cells exposed to high glucose for 6 to 96 h were analyzed for (a) mRNA levels of POLG by realtime PCR, (b) protein expression of POLG in the mitochondria by Western blot technique, and (c) POLG enzyme activity by measuring the incorporation of BrDU into mtDNA. BrDU fluorescence intensity was quantified using an antibody against BrDU, followed by Texas Red-conjugated anti-mouse secondary antibody. Cells were visualized in a Zeiss ApoTome fluorescence microscope at 40x objective. Each time point had 5–6 replicates/experiment, and the experiment was repeated in two or more different cell preparations. The values obtained from cells incubated in 5 mM glucose were considered as 100%. *P < 0.05 compared to 5 mM glucose.
Fig. 7.
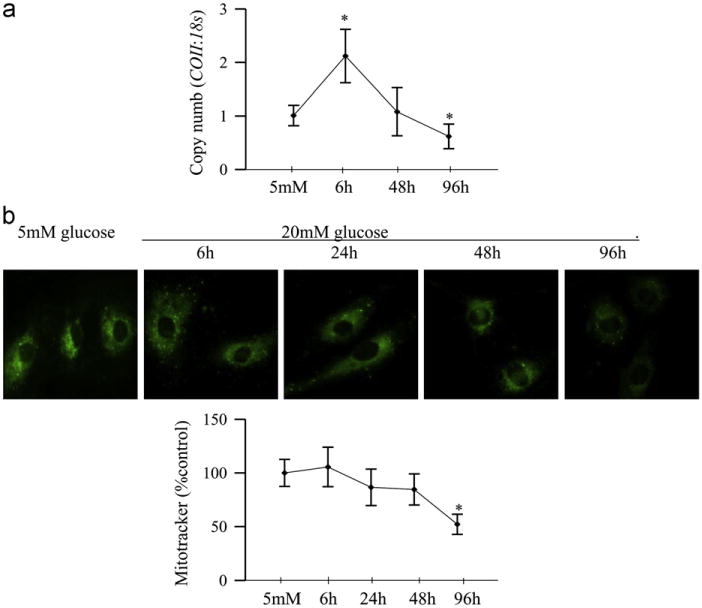
Effect of duration of high glucose on mitochondria copy number and mass. (a) Mitochondria copy number was assessed by real-time RT-PCR using 10 ng gDNA and primers for COII region of the mitochondria DNA; 18sRNA was used as a housekeeping gene. (b) Mitochondria number was quantified by staining the cells with MitoTracker green, and examining them under a Zeiss ApoTome using a 40x objective. The fluorescence was quantified using Image J software. Each measurement was made in duplicate using 2–3 different cell preparations. The accompanying histogram represents mean fluorescence under each condition. Values are represented as mean±SD. *P < 0.05 compared to 5 mM glucose.
Discussion
The development of retinopathy in a diabetic patient is dependent on the duration of diabetes and the severity of hyperglycemia. This slow progressing disease is usually asymptomatic during the initial stages of diabetes, and as the disease progresses, the number and size of intraretinal hemorrhages increase in patients with preproliferative diabetic retinopathy [25]. The gradual progression of the alterations in the retinal microvasculature ultimately leads to hypoxic inner retina, which increases the release of growth factors, and ultimately results in neovascularization [25–27]. The mechanism responsible for these progressive changes remains unclear. Rodent models of diabetic retinopathy have demonstrated that retinal capillary cell apoptosis precedes the appearance of degenerative capillaries and pericyte ghosts [4,28]. Our previous studies have demonstrated that although increase in retinal oxidative stress with a subnormal antioxidant defense mechanism is observed within 2 months of induction of diabetes in rats, retinal mitochondria do not show any damage, and their membrane potential remains normal till the duration of diabetes is extended to ~6 months [4,7–9,14,28–30]. Here, we elucidate the mechanism which could be responsible for protecting the retinal mitochondria from damage in the early stages of diabetes. Our results show that the defense mechanism to combat mitochondria damage is activated within 15 days of induction of diabetes, and a significant increase in the mtDNA copy number, mitochondrial TFAM, and the mtDNA-TFAM binding are seen at 2 months of diabetes. But as the duration of diabetes is extended, both mtDNA repair and replication mechanisms become overwhelmed and they begin to break down. At 6 months of diabetes, mitochondria copy number is decreased and their function is impaired, and with the persistent hyperglycemia, the damaged ETC system continues to produce superoxide damaging the mitochondria function and biogenesis.
Damage to the mtDNA compromises the transcription of mtDNA-encoded proteins, and this impairs the ETC system [11,31]. Here, our results show that during the early stages of diabetes (up to 2 months), retinal mtDNA is protected from the damage, and the ETC system remains functional as shown by normal Cytb levels. In contrast, the mitochondrial levels of the nuclear-encoded DNA repair enzyme, OGG1, become significantly elevated as early as 15 days of diabetes, but, as the hyperglycemia continues, OGG1 starts to fall down and becomes significantly subnormal at 6 months of diabetes. These data suggest that the hyperglycemic insult initiates a compensatory mechanism by increasing the availability of DNA repair enzymes to prevent mtDNA damage, but with time, this compensatory mechanism is exhausted and mtDNA is damaged. Our results show that, contrary to the total mtDNA damage, the noncoding region which contains important transcription and replication sites, D-loop, begins to show damage within 2 months of diabetes. The reason for this could be the increased vulnerability of the D-loop region to ROS compared to other regions of mtDNA [10], and as discussed above, an increase in retinal ROS levels is observed within 15 days of diabetes. In support, our recent study has shown that in a diabetic environment the damage at the D-loop region is higher compared to other regions of the mtDNA [13].
The initial insult of hyperglycemia increases mtDNA replication enzyme, POLG, in the mitochondria, and this response is observed before the D-loop damage. In addition, the initial increase in POLG is followed by an increase in the copy number of mtDNA. These results suggest that the retina tries to combat the hyperglycemic insult by increasing DNA repair enzyme and also by activating the replication machinery to increase mtDNA copy numbers. But, the continued hyperglycemic environment overburdens the system and the mitochondrial replication system becomes significantly subnormal by 6 months of diabetes declining the copy numbers.
Since TFAM is a key activator of mitochondrial transcription and replication [32,33], increased mitochondrial levels of TFAM at 2 months of diabetes observed here confirm our hypothesis that the early stages of hyperglycemic insult initiate a defense mechanism via increasing mtDNA biogenesis and mtDNA copy numbers. TFAM binds to the promoter area in the D-loop region and helps in replicating mtDNA [24,34]. We show that the binding of TFAM to the D-loop is also significantly increased in the initial stages of diabetes. However, with sustained hyperglycemic insult, TFAM levels decrease and the binding of TFAM with the D-loop region also declines at 6 months of diabetes. Furthermore, TFAM also architecturally packages mtDNA and and helps in the stability of nucleoids [24]. Increased binding of TFAM with the COII region at 2 months of diabetes strongly suggests that to overcome the increased ROS, in addition to increasing mtDNA biogenesis and replication, the mtDNA stability is also increased. Our results showing normal levels of Sod2 at 15 days of diabetes suggest that the repair enzymes might be protected from the initial increased oxidative stress, but with extended duration of diabetes, the antioxidant defense system is overwhelmed, and POLG activity is compromised. The ETC system becomes dysfunctional, and the vicious cycle of ROS starts. The damaged mitochondria leak cytochrome c in the cytosol and accelerate the apoptosis process [9,35].
In the pathogenesis of diabetic retinopathy, retinal cells, including Muller cells, ganglion cells, and capillary cells, undergo apoptosis before histopathology associated with diabetic retinopathy can be observed [3–5,36]. But, the histopathology characteristic of diabetic retinopathy is observed only in the microvasculature [1,4,25,37]. We have shown that mitochondria of retinal capillary cells remain intact for up to 72 h of high glucose insult, but cytochrome c leakage into the cytosol and accelerated cell apoptosis are detectable at 96 h of high glucose exposure [9]. Consistent with our in vivo results, we show that ROS levels are increased within 24 h of high glucose exposure, but damage to the total mtDNA or to the D-loop region is seen only at 96 h. POLG activity is significantly increased during the first 6 h of glucose insult, and then starts to come down. But, as the duration of glucose insult is extended, the enzymes activity becomes subnormal. This suggests that to overcome the high glucose insult, in the initial stages POLG activity is increased, but with sustained insult, the enzyme becomes damaged. The mechanism responsible for the inactivation of POLG is not clear, and the possibility that the damage could be due to its oxidative modifications cannot be ruled out. Although mtDNA copy number tends to increase at 6 h, sustained high glucose insult significantly decreases the copy number, and this is accompanied by a decrease in mitochondrial mass. Thus, our in vitro results strongly confirm our in vivo results obtained from the whole retina.
In conclusion, we have elucidated an interesting compensatory mechanism which could help protect retinal mitochondria from the initial damage induced by the diabetic environment. The hyperglycemic insult increases mtDNA repair and biogenesis protecting the ETC system and preventing the initiation of the vicious cycle of ROS. But, with sustained insult, this protection mechanism becomes overwhelmed and the mitochondrial DNA is damaged and they become dysfunctional. This initiates apoptosis of capillary cells, and ultimately results in the development of diabetic retinopathy. Thus, our results further support the importance of an early and sustained glucose control for a diabetic patient to prevent/retard the development of diabetic retinopathy.
Acknowledgments
The authors thank Doug Putt and Jonathan Lin for technical assistance. This study was supported in part by grants from the National Institutes of Health, the Juvenile Diabetes Research Foundation, Thomas Foundation, Midwest Eye Banks, and Research to Prevent Blindness.
References
- 1.Klein R, Klein BEK, Jensen SC, Moss SE. The relation of socioeconomic factors to the incidence of proliferative diabetic retinopathy and loss of vision. Ophthalmology. 1994;101:68–76. doi: 10.1016/s0161-6420(94)31354-6. [DOI] [PubMed] [Google Scholar]
- 2.Chew EY. Epidemiology of diabetic retinopathy. Hosp Med. 2003;64:396–399. doi: 10.12968/hosp.2003.64.7.2275. [DOI] [PubMed] [Google Scholar]
- 3.Mizutani M, Kern TS, Lorenzi M. Accelerated death of retinal micro-vascular cells in human and experimental diabetic retinopathy. J Clin Invest. 1996;97:2883–2890. doi: 10.1172/JCI118746. [DOI] [PMC free article] [PubMed] [Google Scholar]
- 4.Kern TS, Tang J, Mizutani M, Kowluru R, Nagraj R, Lorenzi M. Response of capillary cell death to aminoguanidine predicts the development of retinopathy: comparison of diabetes and galactosemia. Invest. Ophthalmol Vis Sci. 2000;41:3972–3978. [PubMed] [Google Scholar]
- 5.Krady JK, Basu A, Allen CM, Xu Y, LaNoue KF, Gardner TW, et al. Minocycline reduces proinflammatory cytokine expression, microglial activation, and caspase-3 activation in a rodent model of diabetic retinopathy. Diabetes. 2005;54:1559–1565. doi: 10.2337/diabetes.54.5.1559. [DOI] [PubMed] [Google Scholar]
- 6.Brownlee M. The pathobiology of diabetic complications: a unifying mechanism. Diabetes. 2005;54:1615–1625. doi: 10.2337/diabetes.54.6.1615. [DOI] [PubMed] [Google Scholar]
- 7.Kern TS, Kowluru R, Engerman RL. Abnormalities of retinal metabolism in diabetes or galactosemia. ATPases and glutathione. Invest Ophthalmol Vis Sci. 1994;35:2962–2967. [PubMed] [Google Scholar]
- 8.Kowluru RA, Kern TS, Engerman RL. Abnormalities of retinal metabolism in diabetes or experimental galactosemia. IV. Antioxidant defense system. Free Radic Biol Med. 1997;22:587–592. doi: 10.1016/s0891-5849(96)00347-4. [DOI] [PubMed] [Google Scholar]
- 9.Kowluru RA, Abbas SN. Diabetes-induced mitochondrial dysfunction in the retina. Invest Ophthalmol Vis Sci. 2003;44:5327–5334. doi: 10.1167/iovs.03-0353. [DOI] [PubMed] [Google Scholar]
- 10.Jarrett SG, Lin H, Godley BF, Boulton ME. Mitochondrial, D. N. A. damage and its potential role in retinal degeneration. Prog Retin Eye Res. 2008;27:596–607. doi: 10.1016/j.preteyeres.2008.09.001. [DOI] [PubMed] [Google Scholar]
- 11.Madsen-Bouters SA, Mohammad G, Kanwar M, Kowluru RA. Role of mitochondrial DNA damage in the development of diabetic retinopathy, and the metabolic memory phenomenon associated with its progression. Antioxid Redox Signal. 2010;13:797–805. doi: 10.1089/ars.2009.2932. [DOI] [PMC free article] [PubMed] [Google Scholar]
- 12.Santos JM, Tewari S, Goldberg AFX, Kowluru RA. Mitochondria biogenesis and the development of diabetic retinopathy. Free Radic Biol Med. 2011;51:1849–1860. doi: 10.1016/j.freeradbiomed.2011.08.017. [DOI] [PMC free article] [PubMed] [Google Scholar]
- 13.Tewari S, Santos JM, Kowluru RA. Damaged mitochondrial DNA replication system and the development of diabetic retinopathy. Antioxid Redox Signal. 2012;17:492–504. doi: 10.1089/ars.2011.4333. [DOI] [PMC free article] [PubMed] [Google Scholar]
- 14.Kowluru RA, Kern TS, Engerman RL, Armstrong D. Abnormalities of retinal metabolism in diabetes or experimental galactosemia. III. Effects of antioxidants. Diabetes. 1996;45:1233–1237. doi: 10.2337/diab.45.9.1233. [DOI] [PubMed] [Google Scholar]
- 15.Kowluru RA, Atasi L, Ho YS. Role of mitochondrial superoxide dismutase in the development of diabetic retinopathy. Invest. Ophthalmol Vis Sci. 2006;47:1594–1599. doi: 10.1167/iovs.05-1276. [DOI] [PubMed] [Google Scholar]
- 16.Best TM, Fiebig R, Corr DT, Brickson S, Ji L. Free radical activity, antioxidant enzyme, and glutathione changes with muscle stretch injury in rabbits. J Appl Physiol. 1999;87:74–82. doi: 10.1152/jappl.1999.87.1.74. [DOI] [PubMed] [Google Scholar]
- 17.Leutner S, Eckert A, Müller W. ROS generation, lipid peroxidation and antioxidant enzyme activities in the aging brain. J Neural Transm. 2001;108:955–567. doi: 10.1007/s007020170015. [DOI] [PubMed] [Google Scholar]
- 18.Chan PS, Kanwar M, Kowluru RA. Resistance of retinal inflammatory mediators to suppress after re-institution of good glycemic control: novel mechanism for metabolic memory. J Diabetes Complications. 2010;24:55–63. doi: 10.1016/j.jdiacomp.2008.10.002. [DOI] [PMC free article] [PubMed] [Google Scholar]
- 19.Kanwar M, Kowluru R. Role of glyceraldehyde 3-phosphate dehydrogenase in the development and progression of diabetic retinopathy. Diabetes. 2009;58:227–234. doi: 10.2337/db08-1025. [DOI] [PMC free article] [PubMed] [Google Scholar]
- 20.Zhong Q, Kowluru RA. Role of histone acetylation in the development of diabetic retinopathy and the metabolic memory phenomenon. J Cell Biochem. 2010;110:1306–1313. doi: 10.1002/jcb.22644. [DOI] [PMC free article] [PubMed] [Google Scholar]
- 21.Zhong Q, Kowluru RA. Diabetic retinopathy and damage to mitochondrial structure and transport machinery. Invest. Ophthalmol Vis Sci. 2011;52:8739–8746. doi: 10.1167/iovs.11-8045. [DOI] [PMC free article] [PubMed] [Google Scholar]
- 22.Zhong Q, Kowluru RA. Epigenetic changes in mitochondrial superoxide dismutase in the retina and the development of diabetic retinopathy. Diabetes. 2011;60:1304–1313. doi: 10.2337/db10-0133. [DOI] [PMC free article] [PubMed] [Google Scholar]
- 23.Parra V, Eisner V, Chiong M, Criollo A, Moraga F, Garcia A, et al. Changes in mitochondrial dynamics during ceramide-induced cardiomyocyte early apoptosis. Cardiovasc Res. 2008;77:387–397. doi: 10.1093/cvr/cvm029. [DOI] [PubMed] [Google Scholar]
- 24.Ohgaki K, Kanki T, Fukuoh A, Kurisaki H, Aoki Y, Ikeuchi M, et al. The C-terminal tail of mitochondrial transcription factor a markedly strengthens its general binding to DNA. J Biochem. 2007;141:201–211. doi: 10.1093/jb/mvm020. [DOI] [PubMed] [Google Scholar]
- 25.Frank RN. Diabetic retinopathy. N Engl J Med. 2004;350:48–58. doi: 10.1056/NEJMra021678. [DOI] [PubMed] [Google Scholar]
- 26.Cunha-Vaz JG. The blood-retinal barriers. Doc Ophthalmol. 1976;41:287–327. doi: 10.1007/BF00146764. [DOI] [PubMed] [Google Scholar]
- 27.Hammes HP. Pericytes and the pathogenesis of diabetic retinopathy. Horm Metab Res. 2005;37:39–43. doi: 10.1055/s-2005-861361. [DOI] [PubMed] [Google Scholar]
- 28.Kowluru RA, Chan PS. Metabolic memory in diabetes—from in vitro oddity to in vivo problem: role of apoptosis. Brain Res Bull. 2010;87:297–302. doi: 10.1016/j.brainresbull.2009.05.006. [DOI] [PMC free article] [PubMed] [Google Scholar]
- 29.Kowluru RA, Engerman RL, Kern TS. Abnormalities of retinal metabolism in diabetes or experimental galactosemia VIII. Prevention by aminoguanidine. Curr Eye Res. 2000;21:814–819. doi: 10.1076/ceyr.21.4.814.5545. [DOI] [PubMed] [Google Scholar]
- 30.Kowluru RA, Koppolu P, Chakrabarti S, Chen S. Diabetes-induced activation of nuclear transcriptional factor in the retina, and its inhibition by antioxidants. Free Radic Res. 2003;37:1169–1180. doi: 10.1080/10715760310001604189. [DOI] [PubMed] [Google Scholar]
- 31.Madsen-Bouterse S, Zhong Q, Mohammad G, Ho YS, Kowluru RA. Oxidative damage of mitochondrial DNA in diabetes, and its protection by manganese superoxide dismutase. Free Radic Res. 2010;44:313–321. doi: 10.3109/10715760903494168. [DOI] [PMC free article] [PubMed] [Google Scholar]
- 32.Scarpulla RC. Transcriptional paradigms in mammalian mitochondrial biogenesis and function. Physiol Rev. 2008;88:611–638. doi: 10.1152/physrev.00025.2007. [DOI] [PubMed] [Google Scholar]
- 33.Scarpulla RC. Nuclear control of respiratory chain expression by nuclear respiratory factors and PGC-1-related coactivator. Ann N Y Acad Sci. 2008;1147:321–334. doi: 10.1196/annals.1427.006. [DOI] [PMC free article] [PubMed] [Google Scholar]
- 34.Malarkey CS, Bestwick M, Kuhlwilm JE, Shadel GS, Churchill ME. Transcriptional activation by mitochondrial transcription factor A involves preferential distortion of promoter DNA. Nucleic Acids Res. 2012;40:614–624. doi: 10.1093/nar/gkr787. [DOI] [PMC free article] [PubMed] [Google Scholar]
- 35.Mohammad G, Kowluru RA. Matrix metalloproteinase-2 in the development of diabetic retinopathy and mitochondrial dysfunction. Lab Invest. 2010;90:1365–1372. doi: 10.1038/labinvest.2010.89. [DOI] [PMC free article] [PubMed] [Google Scholar]
- 36.Barber AJ, Lieth E, Khin SA, Antonetti DA, Buchanan AG, Gardner TW. Neural apoptosis in the retina during experimental and human diabetes. Early onset and effect of insulin. J Clin Invest. 1998;102:783–791. doi: 10.1172/JCI2425. [DOI] [PMC free article] [PubMed] [Google Scholar]
- 37.Durham JY, Herman IM. Microvascular modifications in diabetic retinopathy. Curr Diab Res. 2011;11:253–264. doi: 10.1007/s11892-011-0204-0. [DOI] [PubMed] [Google Scholar]


