


Abstract
In Saccharomyces cerevisiae Pif1 participates in a wide variety of DNA metabolic pathways both in the nucleus and in mitochondria. The ability of Pif1 to hydrolyse ATP and catalyse unwinding of duplex nucleic acid is proposed to be at the core of its functions. We recently showed that upon binding to DNA Pif1 dimerizes and we proposed that a dimer of Pif1 might be the species poised to catalysed DNA unwinding. In this work we show that monomers of Pif1 are able to translocate on single-stranded DNA with 5′ to 3′ directionality. We provide evidence that the translocation activity of Pif1 could be used in activities other than unwinding, possibly to displace proteins from ssDNA. Moreover, we show that monomers of Pif1 retain some unwinding activity although a dimer is clearly a better helicase, suggesting that regulation of the oligomeric state of Pif1 could play a role in its functioning as a helicase or a translocase. Finally, although we show that Pif1 can translocate on ssDNA, the translocation profiles suggest the presence on ssDNA of two populations of Pif1, both able to translocate with 5′ to 3′ directionality.
INTRODUCTION
Saccharomyces cerevisiae Pif1 is a 5′ to 3′ helicase that belongs to the SF1 family of helicases and possibly the prototype member of a new subfamily (1–4). Genetic and biochemical studies indicate that Pif1 participates in a wide range of DNA processing steps, both in the nucleus and in mitochondria (1,4–9). In mitochondria Pif1 plays a role in mitochondrial (mt)DNA repair and recombination and mtDNA maintenance (3,4,10,11). The nuclear form of Pif1 has both telomeric and non-telomeric functions. Pif1 functions in replication fork progression through ribosomal DNA, where it promotes efficient progression of the replication fork at Replication Fork Barrier (RFB) sites (8). Also, Pif1 is involved in Okazaki fragment processing where in conjunction with the Dna2 helicase/nuclease it helps to process long flaps that cannot be directly cleaved by the FEN1 nuclease (7,12–14). A potential role of Pif1 in preventing genomic instability via destabilization of G4-DNA structures (i.e. G-quadruplex) has recently been proposed (15–18).
At telomeres Pif1 acts as a negative regulator, inhibiting telomere elongation and de novo telomere addition (6,9,19–21). It has been shown that Pif1 displaces the telomerase from the telomeric end, providing biochemical evidence for the inhibitory effect of Pif1 on the activity of the telomerase (6). Moreover, biochemical studies strongly suggest that Pif1 unwinds RNA–DNA heteroduplexes with higher efficiency than dsDNA (22). Therefore, it has been proposed that the unwinding by Pif1 of the RNA–DNA heteroduplex formed by the telomeric TLC1 RNA of the telomerase and the ssDNA at telomeres leads to telomerase displacement (2,6,22). Although it is clear that the ATPase activity of Pif1 is required for displacement of the telomerase (6,9), whether Pif1 displaces the telomerase using exclusively its unwinding activity is not well-established.
In addition to its effect on telomere length, deletion of PIF1 leads to an even more striking effect on the de novo telomere addition pathway to double-stranded DNA breaks (DSBs) (19–21). Although it is apparent that the activity of Pif1 on de novo telomere addition is via a direct effect on the telomerase (19), whether the mechanism of telomerase inhibition by Pif1 at either telomeres or DSBs is the same is not known.
One common feature of all these pathways is that all of the activities of Pif1 rely on its ability to bind to DNA and hydrolyse ATP. We recently determined the mode of Pif1 binding to different DNA substrates (23). Although Pif1 is a monomer in solution, we showed that Pif1 dimerizes upon binding to DNA (23). DNA-induced dimerization of Pif1 is observed on ssDNA as well as tailed- and forked-dsDNA substrates. A dimer of Pif1 also forms on DNA unwinding substrates in the presence of saturating concentrations of non-hydrolysable ATP analogs (23). These observations suggest that a dimeric form of the enzyme might constitute the pre-initiation complex required for unwinding activity. Whether a dimer or monomer of Pif1 is sufficient for DNA unwinding activity remains to be explored. Also, intrinsic to its ability to unwind dsDNA a helicase must be able to translocate along at least one strand of the duplex (24,25). In the case where translocation can be decoupled from unwinding, a helicase will also be able to translocate along ssDNA. Therefore, it is possible that regulation of the oligomeric state of Pif1 on DNA might determine whether the enzyme functions to unwind double-stranded nucleic acids (helicase) or simply moves along ssDNA (translocase) (24,26–28). To explore these possibilities for Pif1 we have performed experiments to examine whether monomers of Pif1 can translocate on ssDNA, whether a dimer or monomer of Pif1 is sufficient for DNA unwinding activity and whether ssDNA translocation activity can be decoupled from helicase activity and used for other functions.
EXPERIMENTAL PROCEDURES
Reagents and buffers
All chemicals were reagent grade. All solutions were made with distilled and deionized 18 MΩ (Milli-Q) water (Millipore Corp., Bedford, MA). The oligonucleotides were purchased from Integrated DNA Technology (IDT, Coralville, Iowa) and HPLC purified. Homo-oligonucleotides concentrations were determined in 10 mM Tris-HCl pH 8.3, 0.1 mM EDTA using an extinction coefficient of ε260 nm = 8100 M−1 cm−1 for dT and ε260 nm = 5000 M−1 cm−1 for Cy3 (27,29). The lengths and location of Cy3 are indicated in the text. For oligonucleotides with mixed sequence composition the extinction coefficient was calculated with the nearest-neighbor method (30). The sequences of the substrates with mixed sequence composition used in this study are shown in Supplementary Table S1. The dsDNA substrates were prepared by annealing a 1:1 ratio of unlabeled to labeled strand in 10 mM Tris-HCl pH 8.3, 100 mM NaCl and 5 mM MgCl2 for 5 min at 97°C and then slow cooling to room temperature.
The concentration of ATP, ADP and ATPγS (Sigma-Aldrich, St. Louis, MO) was determined using ε259 nm = 15 400 M−1 cm−1 (23).
Unless otherwise stated all the experiments were performed at 22°C in Buffer T (50 mM Tris-HCl pH 8.3, 5 mM MgCl2, 0.5 mM DTT and 20% v/v glycerol) with the concentration of NaCl (mM) indicated in the subscript.
Purification of Pif1
Pif1 was purified as previously reported (23). For most of the studies the preparation was stopped after the ssDNA cellulose chromatography step. The addition of the extra step of ATP-agarose affinity chromatography does not change the observed translocation behavior (Supplementary Material). Before use, the protein was extensively dialysed in the indicated buffer and the concentration of Pif1 was determined spectrophotometrically with a Cary 100 (Varian Inc., Palo Alto, CA) using an extinction coefficient ε280 nm = 55 000 M−1 cm−1 (23).
Stopped-flow kinetics
All the stopped-flow experiments were carried out with either a SX.14 or SX.20 Applied Photophysics apparatus maintained at the indicated temperature with a circulating thermostatic bath. Fluorescence intensity measurements monitoring Cy3 changes were performed by excitation at 520 nm and collecting the emission with a 550 nm cut-off filter (Chroma Technology, USA). All the solutions were incubated 7–10 min in the syringes before collection. The reported traces are an average of 4–8 shots collected in pressure-hold mode.
ssDNA translocation
In order to study Pif1 translocation on ssDNA we took advantage of the change in Cy3 fluorescence upon Pif1 binding and we employed an assay initially used to monitor ssDNA translocation of PcrA helicase (31), further developed by the Lohman group to study a variety of ssDNA translocases (27,32–36) and applied to other systems (37–41). Briefly, the assay is based on the empirical observation that when in close proximity of a fluorophore a protein can induce changes in its fluorescence properties (either quenching or enhancement). Therefore, if a protein moves directionally along a lattice (i.e. ssDNA) toward a fluorophore placed at its end, arrival of the protein can elicit a change in the fluorescence of the fluorophore, followed by an additional change in the opposite direction upon dissociation of the protein from the lattice (see (32,42–44) for extensive discussion). The change in the fluorescence of the fluorophore induced by the arrival of the enzyme at the end is then determined for different lengths of the lattice. The longer the lattice the longer the time required for the enzyme to reach the fluorophore, resulting in changes in the observed peak position and shape of the observed time course (32,42–44). Moreover, for an enzyme with low processivity for longer ssDNA substrates a smaller fraction of the protein will reach the end due to the increase probability of dissociating during the cycle of translocation, resulting in a decrease of the amplitude of the observed fluorescence signal.
Unless otherwise indicated all the translocation experiments were done by pre-forming a Cy3-labeled DNA–Pif1 complex at a 2:1 molar ratio of DNA to protein (400 nM DNA and 200 nM Pif1). Under these conditions no more than a monomer of Pif1 is bound to each DNA (Supplementary Figure S1).
DNA unwinding
The top strand (Supplementary Table S1) of the duplex substrates used for these experiments was 5′ end labeled with 32P using PolyNucleotide Kinase under conditions [ATP-γ-32P]<<[5′ end] and the concentration determined spectrophotometrically after purification with a BioSpin P-6 column (BioRad, USA). The duplex substrates (D1 or D2) were generated with bottom strand without the Cy3 modification (Supplementary Table S1) as described above. Unwinding activity was determined at 22°C in Buffer T100 by pre-incubating 400 nM labeled substrates with a 2.5:1 or 1:2 ratio of Pif1 to DNA and initiating the reaction by equal mixing with 1 mM ATP in the absence or presence of 0.1 mg/ml heparin. After 30 s aliquots were withdrawn and quenched with 250 mM EDTA and a 10-fold excess of unlabeled top strand (trap). After digestions with Proteinase K, the reaction products were resolved on a 12% non-denaturing TBE polyacrylamide gel and imaged with a Storm Phosphorimager (Molecular Dynamics, USA).
Streptavidin displacement
Reactions were performed in Buffer T100 with a protocol similar to the one used for other helicases (45–48). Briefly, 400 nM biotinylated and Cy3-labeled DNA substrate is bound to a 4-fold excess of streptavidin and incubated for 3 min. Pif1 is then added at a 2:1 or 1:2 ratio relative to the DNA and allowed to equilibrate for an additional 10 min. Excess free biotin (at a final concentration10-fold higher than streptavidin) or free biotin and ATP (2 mM final concentration) are added and the reaction allowed to continue for 10 min before quenching with an equal volume of 250 mM EDTA, 20% v/v glycerol and 280 µM nts of poly(dT) (to trap Pif1). The free DNA and streptavidin-bound DNA are then separated on a 12% TBE native gel and imaged with a Storm Phosphorimager in fluorescence mode.
RESULTS
A monomer of Pif1 shows evidence for 5′ to 3′ ssDNA translocation
We recently showed that binding of Pif1 to ssDNA induces dimerization of the protein (23). However, in the presence of an excess of ssDNA, a Pif1 monomer is bound to the ssDNA lattice (23). We confirmed this using sedimentation velocity analytical ultracentrifugation of Pif1–DNA complexes formed in the presence of excess nucleic acid, monitoring the sedimentation coefficient of Cy3-labeled ssDNA (Supplementary Figure S1). Analysis of the stoichiometry and sedimentation coefficients shows that no more than one Pif1 monomer is bound to each ssDNA. Therefore, under the conditions employed here any observed ssDNA translocation signal originates from a monomer of Pif1 (see below as well).
Stopped-flow studies of the binding of a monomer of Pif1 to Cy3-labeled ssDNA show a Cy3 fluorescence enhancement. The time course of Cy3 fluorescence after mixing 200 nM Pif1 with 400 nM dT20-Cy3 (Cy3 is at the 3′ end) in Buffer T200 is shown in Figure 1a along with the trace after mixing dT20-Cy3 with buffer only. The data show that binding of Pif1 to the ssDNA is accompanied by a Cy3 fluorescence increase without significant loss of amplitude in the dead time of mixing. Moreover, control experiments mixing different combinations of Pif1, DNA, ATP and heparin (Figure 1a, inset) show that 0.1 mg/ml heparin efficiently prevents Pif1 binding to DNA or any ATP-dependent change in Cy3 fluorescence. Therefore, heparin can be used to trap free Pif1 and ensure single-turnover conditions in translocation experiments (27,32).
Figure 1.

A monomer of Pif1 shows the signature of 5′ to 3′ translocation on ssDNA. (a) Time courses of Cy3 fluorescence after mixing 200 nM Pif1 with 400 nM dT20-3′-Cy3 (black) or BufferT200 only (gray). Inset—Control experiments mixing: 200 nM Pif1 with 400 nM dT20-3′-Cy3 and 0.1 mg/ml heparin (red); 200 nM Pif1 and 0.1 mg/ml heparin with 400 nM dT20-3′-Cy3 (blue); a complex of 200 nM Pif1 with 400 nM dT20-3′-Cy3 pre-formed in presence of 0.1 mg/ml heparin with 1 mM ATP and 0.1 mg/ml heparin (black). (b) Time courses of Cy3 fluorescence after mixing a pre-formed complex of 200 nM Pif1 with 400 nM dT20-3′-Cy3 in BufferT200 with: 0.1 mg/ml heparin (black); 1 mM ATP (red); 1 mM ATP and 0.1 mg/ml heparin (blue); 1 mM (dark gray) or 0.1 mM (gray) ATPγS and 0.1 mg/ml heparin; 1 mM ADP and 0.1 mg/ml heparin (green). (c) Time courses of Cy3 fluorescence after mixing a pre-formed complex of 200 nM Pif1 with 5′-Cy3-dT24 in BufferT200 with: 0.1 mg/ml heparin (black); 1 mM ATP (red); 1 mM ATP and 0.1 mg/ml heparin (blue).
The time course of Cy3 fluorescence after mixing a pre-formed complex of Pif1 and dT20-Cy3 with 0.1 mg/ml heparin in Buffer T200 is shown in Figure 1b (black trace). If Pif1 dissociates from DNA in the presence of heparin it does not rebind to the DNA, therefore the observed Cy3 fluorescence decrease monitors the complete and irreversible dissociation of Pif1 from DNA. The slow apparent rate of dissociation (0.2–0.3 min−1) indicates that Pif1 forms a stable complex with ssDNA in the absence of ATP. The time course is very different when the pre-formed complex is mixed with 1 mM ATP (Figure 1b, red trace). In this case the Cy3 fluorescence increases within the first second, reaches a plateau and then slowly decreases. The initial rise in fluorescence is expected if Pif1 is able to hydrolyse ATP and translocate in a 5′ to 3′ direction toward the fluorophore. Following the initial rise, the signal will reach a plateau if Pif1 undergoes multiple rounds of translocation and rebinding or if it is stably bound to the end of the DNA. The slow decrease in the Cy3 signal corresponds to dissociation of Pif1 from ssDNA once all the ATP is consumed (32,42–44). When the pre-formed complex is mixed with 0.1 mg/ml heparin and 1 mM ATP the Cy3 fluorescence shows yet a different time course (Figure 1b, blue trace). The fluorescence of Cy3 peaks at ∼200 ms and then decays to the same level observed for heparin only (fully dissociated Pif1–DNA complex). Under these single-turnover conditions, imposed by the presence of the protein trap, the Cy3 signal change is consistent with the expected behavior of an enzyme that translocates directionally toward the fluorophore (5′ to 3′ in this case) (32,42–44). Indeed control experiments where Cy3 is placed at the 5′ end of the DNA (Figure 1c) show that upon addition of ATP and heparin, the Cy3 fluorescence decreases exponentially (independent of DNA length (data not shown)), consistent with Pif1 moving away from the fluorophore (i.e. with 5′ to 3′ directionality) (32,42–44).
To further test that the Cy3 fluorescence change in presence of ATP and heparin originates from ATP-driven translocation of Pif1 along ssDNA we performed the same experiments in the presence of ATPγS, a non-hydrolysable ATP analog (additional control experiments are shown in Supplementary Figure S2). When a preformed Pif1–dT20-Cy3 complex is mixed with 0.1 mg/ml heparin and 1 mM or 0.1 mM ATPγS in Buffer T200 (Figure 1b, dark and light gray), Pif1 rapidly dissociates from DNA. Interestingly, the observed rate of Pif1 dissociation (∼3 s−1) in the presence of ATPγS is much faster than for the protein in absence of nucleotides (0.2–0.3 min−1). This is true also for ADP, the product of ATP hydrolysis (Figure 1b, green), although the apparent rate of dissociation is slower than in the presence of ATPγS but still faster than in the absence of nucleotides.
DNA length and ATP concentration dependences show that monomeric Pif1 is a ssDNA translocase
The data in Figure 1 strongly suggest that a monomer of Pif1 can translocate with biased 5′ to 3′ directionally, consistent with the polarity of its unwinding activity (3–5). To probe this further we performed experiments as a function of the DNA length and ATP concentration.
The Cy3 fluorescence time courses after mixing 1 mM ATP and 0.1 mg/ml heparin with pre-formed complexes of Pif1 with different lengths of 3′ end labeled ssDNA (dTn-Cy3) in Buffer T200 are shown in Figure 2a. Two aspects are evident from the data. First, over the short ssDNA lengths examined the total integrated fluorescence change of Cy3 decreases exponentially as the ssDNA length increases (Supplementary Figure S3a). This behavior suggests that Pif1 translocates along ssDNA with relatively low processivity. Second, the time to reach the peak of the Cy3 fluorescence increases as the length of ssDNA increases (Figure 2a, inset). From the reciprocal of the slope of this plot we estimate an apparent Pif1 translocates rate of ∼90 nt/s. The apparent rate calculated in this way has been used to determine the rate of translocation of several ssDNA translocates (31,49,50). However, this method is subject to two main assumptions: (i) the enzyme translocates with infinite processivity; (ii) the translocase is bound randomly to the ssDNA (32,43). It has been shown that when these assumptions do not hold the translocation rate calculated in this way can lead to higher estimates of the true translocation rate (32,43). A more robust estimate of the translocation rate can be obtained from analysis of the entire time course of the fluorescence change using a model for translocation (27,32,42,43). In the case of Pif1 the observation that the total integrated fluorescence decreases as the ssDNA length increases (Supplementary Figure S3a) clearly points to a translocase with a finite processivity and it suggests that assumption (i) does not hold. Moreover, as we show in the following sections the shape of the Cy3 fluorescence time courses suggests the presence of more than one translocating species of Pif1. Hence we view the rate of 90 nt/s as only an initial estimate of the rate of Pif1 monomer translocation.
Figure 2.

Pif1 translocates on ssDNA. (a) Time courses of the relative Cy3 fluorescence change ((Fi − Fend)/Fend, where Fend is the Cy3 fluorescence at the end point, corresponding to free ssDNA) after mixing in BufferT200 1 mM ATP and 0.1 mg/ml heparin with pre-formed complexes of 200 nM Pif1 and 400 nM dTn-3′-Cy3 of different lengths: n = 15 (red); n = 20 (black); n = 28 (green); n = 38 (orange); n = 50 (blue). Inset—Time to reach the peak as function of ssDNA length. The standard deviation is calculated from four-independent experiments. (b) Time courses of the relative Cy3 fluorescence change after mixing in BufferT200 a pre-formed complex of 200 nM Pif1 and 400 nM dT28-3′-Cy3 with 0.1 mg/ml heparin and the indicated concentration of ATP (color-coding follows the legend on the figure). (c) Same experiments as in (a) but determined in Buffer T100. (d) Same experiments as in (b) but determined for a complex of Pif1 and dT38-3′-Cy3 in Buffer T100.
We next examined the ATP concentration dependence of Pif1 translocation. Representative time courses of Cy3 fluorescence after mixing a pre-formed complex of Pif1 and dT28-Cy3 with different concentrations of ATP and 0.1 mg/ml heparin in Buffer T200 are shown in Figure 2b. When the concentration of ATP is decreased the amplitude of the peak decreases, the peak position shifts to longer times and the observed signal broadens, as expected for an ATP-driven translocation process (32,42–44). The increase in the time to reach the Cy3 fluorescence peak as a function of ssDNA length and the behavior of the fluorescence time courses as a function of ATP concentration provide a clear indication that a monomer of Pif1 is an ATP-dependent ssDNA translocase.
Pif1 translocation shows evidence for bimodal behavior
Our attempts to fit the time courses in Figure 2a using a simple n-step sequential model for a single translocating species (32,42–44) show significant deviations from the experimental time courses (Supplementary Figure S6a). This is especially obvious at the lower ATP concentrations for longer ssDNA lengths and longer times, where a pronounced tail in the Cy3 signal is observed (Figure 2b). Moreover, the shape of the Cy3 fluorescence time courses changes when the experiments are performed under different solution conditions.
The data in Figure 2c show the same experiments as in Figure 2a but at 100 mM NaCl (Buffer T100). At this lower NaCl concentration the data for the longer ssDNA lengths show a second peak in the Cy3 fluorescence time courses (Figure 2c, red arrow). In addition, both the position and amplitude of the first Cy3 fluorescence peak change as the length of the ssDNA increases, indicating that Pif1 translocates on the substrates. From the linear dependence of the time to reach this first peak as a function of ssDNA length (Figure 2c, inset) we estimate an apparent translocation rate of ∼85 nt/s (again, this is only an estimate, see above and (32,43)).
The presence of a second peak in the Cy3 fluorescence time courses becomes even more evident for experiments performed at different ATP concentrations. Figure 2d shows the time courses after mixing a pre-formed Pif1–dT38Cy3 complex with different concentrations of ATP and 0.1 mg/ml heparin in Buffer T100. As the ATP concentration is decreased, the first peak in the Cy3 fluorescence shifts to longer times, its amplitude decreases and the signal broadens as expected for an ATP-dependent translocase (Figure 2b). However, the second Cy3 fluorescence peak also shifts to longer times, suggesting that this new peak originates from an ATP-dependent translocation process as well.
Interestingly, the data obtained with longer ssDNAs at 200 mM NaCl do not show clear evidence of the second peak, although a long tail in the fluorescence signal is observed, especially at low ATP concentrations (Figure 2b). Indeed, the fractional contribution of this second peak to the total Cy3 fluorescence is modulated by the NaCl concentration (Figure 3a). As the concentration of NaCl is increased the position of the first peak is little affected while the initial fluorescence signal decreases, suggesting that a smaller fraction of Pif1 is initially bound to ssDNA (consistent with a decrease in DNA-binding affinity at higher [NaCl], RG unpublished observation). At the same time the fraction of the second peak decreases at higher NaCl concentrations. However, this second translocation process still contributes even at the higher NaCl and ATP concentrations.
Figure 3.
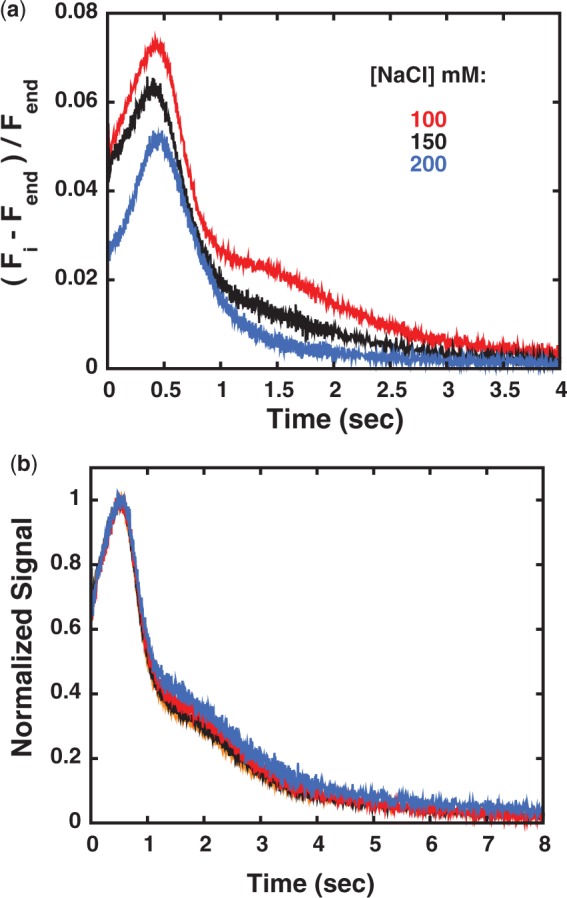
Pif1 shows evidence of a second population that can translocate on ssDNA. (a) Time courses of the relative Cy3 fluorescence change after mixing a pre-formed complex of 200 nM Pif1 with 400 nM dT38-Cy3 and 1 mM ATP and 0.1 mg/ml heparin in BufferT at the different NaCl concentrations indicated in the figure. (b) Normalized Cy3 fluorescence signal after mixing in Buffer T100 0.5 mM ATP and 0.1 mg/ml heparin with complexes of 400 nM dT38-Cy3 pre-formed with different concentrations of Pif1: 350 nM (orange); 300 nM (black); 200 nM (red); 150 nM (blue).
In the presence of excess DNA both sedimentation velocity analysis of Pif1–ssDNA complexes (Supplementary Figure S1) and titrations performed under stoichiometric conditions indicate that a single monomer of Pif1 is bound to the DNA (23). To further test the possibility that the observed second peak in the Cy3 fluorescence time courses originates from a small fraction of dimeric Pif1 bound to ssDNA, we performed translocation experiments at different DNA to protein ratios. If this second peak were due to a small fraction of dimeric Pif1, as the amount of Pif1 relative to DNA is increased the fraction of the observed second peak should increase; however, this is not observed. The normalized Cy3 fluorescence after mixing pre-formed complexes of 400 nM dT38-Cy3 and different concentrations of Pif1 (150–350 nM) with 0.5 mM ATP and 0.1 mg/ml heparin in Buffer T100 is shown in Figure 3b. Within experimental error the distribution and relative amplitudes of the first and second peak are independent of Pif1 concentration, confirming that the observed behavior does not originate from a small fraction of dimeric Pif1.
Additional control experiments further suggest that the second peak in the Cy3 fluorescence time course does not originate (i) from a simple fluorophore effect (Supplementary Figure S3b); (ii) an effect of heparin (Supplementary Figure S3c); (iii) from a partially altered ATP-binding site (Supplementary Figure S3d); (iv) from ADP accumulation (Supplementary Figure S3e); (v) from a specific base-effect of nucleotide binding/hydrolysis (Supplementary Figure S3f); (vi) from a temperature effect (Supplementary Figure S4). We also find that the first and second peaks in the Cy3 fluorescence time courses do not interconvert on the time scale of translocation (Supplementary Figure S5a).
Modeling Pif1 translocation
In light of the observations presented in the previous sections, we analysed the Cy3 fluorescence time courses with a two-population, n-step sequential translocation model according to Scheme 1 (adapted from (27)), where the two populations of Pif1 cannot re-equilibrate on the time scale of translocation. In Scheme 1 either population of Pif1 can move independently along ssDNA with its own population-specific translocation rate constant according to an n-step sequential translocation mechanism. Upon addition of ATP each population translocates with finite processivity along the ssDNA in a series of repeated steps until they reach the 3′ end and dissociate from the ssDNA. At any point during translocation each population can also dissociate from internal sites along the ssDNA. Pif1 re-binding to ssDNA is prevented by the presence of heparin as a protein trap. The average number of nucleotides translocated between consecutive rate-limiting steps is defined as the translocation kinetic step-size, m (27). Details of the model, its assumptions and fitting routine are discussed in Supplementary Material.
Scheme 1.

Figure 4a and b shows representative fits of the time courses collected at 100 mM NaCl and high and low ATP concentrations, where the presence of the second Cy3 fluorescence peak is more pronounced. For the longest ssDNA lengths the model in Scheme 1 captures the second Cy3 fluorescence peak. Therefore, this suggests that this second peak in the Cy3 fluorescence time courses arises from a second, translocating population of Pif1. Also, for the data collected at 200 mM NaCl the fit with a two-population n-step sequential translocation model captures the time courses at longer times, especially for the lower concentrations of ATP (Supplementary Figure S8c). This confirms that the second population of translocating Pif1, although small, is still present at this higher NaCl concentration. However, the lack of a well-defined peak prevents a reliable estimate of the translocation parameters for this population under these conditions (Supplementary Table S2).
Figure 4.

Analysis of Pif1 translocation on ssDNA. (a, b) Selected examples of the fitting according to Scheme 1 (red) of the Pif1 translocation data (black) collected at 100 mM NaCl after mixing with 0.1 mg/ml and 1 mM ATP (a) and 0.1 mM ATP (b). (c) Macroscopic translocation rate as function of the final concentration of ATP (after mixing) determined from the fitting according to Scheme 1 for all the data collected. (d) The apparent step-size calculated at either NaCl concentration examined.
The apparent translocation rate (m * kt) as function of ATP concentration calculated from the analysis of all the data with Scheme 1 is shown in Figure 4c. For both populations the observed translocation rates follow an apparently simple Michaelis–Menten dependence, consistent with ATP-driven translocation processes that originate from ATP hydrolysis at a single-site (i.e. a monomer of Pif1). The two populations of Pif1 translocate with different rates (81 ± 8 nt/s versus 35 ± 5 nt/s) at saturating [ATP], but with similar apparent KM for ATP (210 ± 44 µM versus 302 ± 83 µM). Therefore, analysis with the model in Scheme 1 strongly suggests that the major difference between the two Pif1 populations is the rate at which they translocate along ssDNA. Also, the ‘fast’ population of Pif1 appears to translocate only slightly slower at the higher NaCl concentration (63 ± 3 nt/s versus 81 ± 8 nt/s), suggesting that the observed translocation rate is moderately affected by the concentration of NaCl. However, at the higher NaCl concentration Pif1 shows a lower apparent KM for ATP (67 ± 10 µM versus 210 ± 44 µM). This difference could originate from a difference in affinity for ATP, an effect of NaCl concentration on the rate of ATP hydrolysis or the presence of a larger contribution at the lower NaCl concentration of the second population that can hydrolyse ATP as well.
The kinetic step-size (i.e. the number of nucleotides translocated between two successive rate-limiting steps) is calculated from the linear dependence of the fitted number of steps as a function of ssDNA length (Supplementary Figure S7a) (32,42–44). For Pif1 translocation the calculated step-size shows a marked non-linear dependence as function of ATP concentration, with a plateau value of ∼0.5 nt at high ATP and 1–2 nt in the limit of low ATP concentrations (Figure 4d). Reasons that can lead to a non-constant kinetic step-size as a function of ATP concentration have been discussed (43,51). Work on RecBCD unwinding (formally the mechanism is the same as translocation, i.e. n-step sequential) has shown that the value of the step-size might be deflated by the presence in the translocation cycle of multiple rate-limiting steps between each repeating ATP-binding step (51). This scenario leads, at high ATP concentration, to a value of the kinetic step-size half of its true value (51). Given the observation that at high ATP concentration the kinetic step-size for Pif1 has a value of ∼0.5 nt (less than what expected for a physical limit of 1 nt), we favor the interpretation that it is deflated by the presence of multiple rate-limiting steps. As the ATP concentration is decreased, the kinetic step-size of Pif1 approaches the value of ∼1–2 nt (Figure 4d).
Finally, we note that at the higher ATP concentrations and especially at the higher [NaCl] the model in Scheme 1 does not describe well the first Cy3 fluorescence peak for the longer ssDNA lengths (Supplementary Figure S8b). This suggests that a more complex mechanism should be considered and that the kinetic parameters determined with the model in Scheme 1 might be affected. Therefore, we considered modifications to Scheme 1 that might account for this deviation. Simulations in Supplementary Figure S8d suggest that including in Scheme 1 an initial isomerization of Pif1 from a non-productive to a productive complex (32,42–44) is not sufficient to describe the first Cy3 fluorescence peak. Next, we considered the effect of a small bias of Pif1 either toward the ends or the middle of the ssDNA has on the Cy3 fluorescence time courses (Supplementary Figure S9). Inclusion in the model in Scheme 1 of a small bias of Pif1 for the center of the ssDNA or positions 10 nt to the left or right of it can simulate the translocation traces. Interestingly agreement between the observed Cy3 fluorescence time courses and the simulations is obtained without changing the macroscopic translocation rate (m * kt), kd and kend determined from fitting the data using Scheme 1 (Supplementary Table S2) and assuming a kinetic step-size of 1 nt. These simulations suggest that although the fitting according to Scheme 1 does not capture well the first peak in the Cy3 fluorescence time courses at high ATP and NaCl concentrations, the kinetic parameters calculated with this model are not strongly affected by a potential bias for Pif1 binding to internal positions of the ssDNA.
Monomeric Pif1 has lower helicase activity than a dimer
The data presented in the previous sections clearly show that monomers of Pif1 can translocate on ssDNA. Next, we asked whether Pif1 monomers are also able to unwind dsDNA. For these experiments we used the signal change of Cy3 that is observed during translocation. In this case the Cy3 label is at the end of a 20-bp duplex region at the 3′ end of the Pif1 translocating strand (substrates D1 and D2 in Figure 5a and b, Supplementary Table S1). If Pif1 is able to unwind the duplex and reach the end, an increase in Cy3 fluorescence similar to the one observed for translocation on ssDNA will be observed.
Figure 5.

A monomer of Pif1 can unwind dsDNA albeit with lower efficiency than a dimer. (a) Cy3 fluorescence after mixing in Buffer T100: (black) a pre-formed complex of 200 nM Pif1 and 400 nM 3′ end Cy3-labeled bottom strand of substrate D1 with 1 mM ATP and 0.1 mg/ml heparin; (gray) a complex of 200 nM Pif1 and 400 nM substrate D1 with 0.1 mg/ml heparin only; a complex of Pif1 and 400 nM substrate D1 formed at either a 1:2 (red) or a 2:1 (blue) ratio of protein to DNA with 1 mM ATP and 0.1 mg/ml heparin. (b) Same experiments as in (a) but performed on substrate D2. (c) Same experiments as in (a) and (b) performed in the absence of heparin: 3′ end Cy3-labeled bottom strand of substrate D1 (black); substrate D1 at 1:2 (red) and 2:1 (blue) ratio of Pif1 to DNA; substrate D2 at 1:2 (magenta) and 2:1 (light blue). (d) Unwinding experiments performed by mixing 1 mM ATP with 400 nM of 32P-labeled substrates in complex with: a 2:1 ratio of Pif1 to substrate D1 (lane 2) or D2 (lane 7); a 1:2 ratio of Pif1 to substrate D1 (lane 3) or D2 (lane 8). Lanes 4 and 9, 5 and 10 are the same experiments performed by mixing with 1 mM ATP and 0.1 mg/ml heparin. Lanes 1 and 6, DNA substrates alone.
Pif1 translocates on the Cy3-labeled bottom strand of substrate D1 that contains a sequence of mixed composition proximal to the Cy3 label (Figure 5a, black trace). Interestingly, comparison with a homo-oligodeoxynucleotide of the same length (dT28-Cy3) suggests that translocation of Pif1 is sensitive to the sequence composition of the ssDNA (Supplementary Figure S5b). No Cy3 fluorescence change is detected when a monomer of Pif1 on substrate D1 (the complex is formed in Buffer T100 at a 1:2 ratio of protein to DNA) is mixed with 0.1 mg/ml heparin in the absence of ATP (Figure 5a, gray trace). This is consistent with the need of ATP hydrolysis to drive translocation and/or unwinding. However, a small albeit detectable change in Cy3 fluorescence is observed when the same complex is mixed with 1 mM ATP and 0.1 mg/ml heparin (Figure 5a, red trace). The very fact that in the presence of ATP a change in Cy3 fluorescence is detected shows that Pif1 must move toward the fluorophore, suggesting that a monomer of Pif1 is able to at least partially unwind the dsDNA region (see below). Under conditions where a dimer of Pif1 is bound to substrate D1 (the complex is formed at a 2:1 ratio of protein to DNA (23)) the change in Cy3 fluorescence is even more pronounced (Figure 5a, blue trace). Also, for substrate D1 the position of the peak in the Cy3 fluorescence is shifted to longer times as compared to the bottom strand ssDNA (Figure 5a, black versus red or blue traces), suggesting that the presence of the duplex affects the initial distribution of bound Pif1 and possibly the translocation rate. A similar behavior is observed with substrate D2 (Figure 5b). It has been shown that the presence of a 3′-ssDNA tail stimulates the unwinding activity of Pif1 (22) and that it stabilizes a dimer of Pif1 (23). Indeed, under conditions where a dimer of Pif1 is formed on substrate D2 (Figure 5b, blue trace) the amplitude of the observed Cy3 fluorescence peak is ∼2-fold higher than the one observed on substrate D1. When a monomer of Pif1 is formed on substrate D2 (Figure 5b, red trace) a change in Cy3 fluorescence is observed, again consistent with the ability of the monomer to unwind the duplex region of the substrate while translocating toward the 3′ end. These data suggest that a monomer of Pif1 retains some DNA unwinding activity, although the extent of the reaction is dramatically reduced as compared to a Pif1 dimer.
We note that in the presence of heparin (to ensure single-turnover conditions) the Cy3 fluorescence after reaching the peak does not return to baseline (e.g. blue trace in Figure 5b). Although at present we do not know the physical origin of this phenomenon, it is possible that either the nature of the substrate or the presence of heparin might contribute to this behavior. Therefore, we performed the same experiments as in Figure 5a and b in the absence of heparin, allowing for possible multiple turnover of the enzyme (Figure 5c). Under conditions where a monomer of Pif1 is formed on the substrate (P < D), the Cy3 fluorescence increases when the pre-formed complexes are mixed with 1 mM ATP (Figure 5c, red and magenta). This suggests that a monomer of Pif1 is able to approach the label during translocation and unwind the duplex, consistent with the observations in the presence of heparin. Under conditions where a dimer of Pif1 is formed on the substrate (P > D) (Figure 5c, dark and light blue) the change in Cy3 fluorescence after mixing with 1 mM ATP is larger than for a monomer of Pif1 on the same substrates. Moreover, the maximum fluorescence is reached faster, suggesting that a dimer of Pif1 has higher unwinding activity. Also, on substrate D2 the maximum in Cy3 fluorescence is reached faster than on substrate D1, consistent with the ability of the 3′-ssDNA tail to stimulate the unwinding activity of Pif1 (22).
It should be pointed out that experiments monitoring the Cy3 fluorescence do not directly report on the amount of unwound but rather on the approach of Pif1 toward the labeled 3′ end. Therefore, next we performed experiments with 32P-labeled substrates monitoring the extent of unwinding using standard native gel electrophoresis (see Materials and Methods). In the absence of heparin and under conditions where a dimer of Pif1 is bound to the 5′-ssDNA extension of D1 and D2 both substrates are unwound (Figure 5d, lanes 2 and 7). However, under conditions where a monomer of Pif1 is bound to the substrates the extent of DNA unwinding is lower (Figure 5d, lanes 3 and 8). These data suggest that the Cy3 fluorescence changes observed Figure 5c indeed report on Pif1 translocation and unwinding.
Finally, in the presence of heparin neither a dimer nor a monomer of Pif1 can unwind the substrates (Figure 5d, lanes 4, 5, 9 and 10). This is different from what we observe in the Cy3 fluorescence experiments (Figure 5a and b). The lack of a significant extent of DNA unwinding cannot simply originate from dissociation of Pif1 before initiation of unwinding. If this were the case, no fluorescence change of Cy3 should have been detected in Figure 5a and b. In the presence of heparin, the very low extent of unwinding suggests that the Cy3 fluorescence increase after addition of ATP does not originate from complete unwinding but rather from a partial opening of the duplex and translocation of Pif1 toward the dye before dissociation and trapping. It is possible that unlike translocation on ssDNA, the processivity of Pif1 during unwinding is strongly affected by the presence of heparin as a protein trap (22).
The translocase activity of Pif1 may be used to displace proteins bound to DNA
The data in the previous sections show that a monomer of Pif1 is able to translocate with a 5′ to 3′ directionality on ssDNA and suggest that it can at least partially unwind a short duplex, albeit at a lower extent as compared to a dimeric species. Even though a monomer of Pif1 does not show strong helicase activity, it can be argued that the translocation activity of monomeric Pif1 on ssDNA could be used exclusively as part of the helicase mechanism of the dimeric Pif1. Therefore, we next tested whether the translocation activity of Pif1 monomer could contribute to functions that are independent of the unwinding activity, i.e. protein displacement. As a proxy for protein displacement we employed an assay that monitors the displacement of streptavidin bound to a biotin on the ssDNA (45–48). The basic idea of this assay is shown in Figure 6a. If Pif1 is able to displace the bound streptavidin via its translocation activity, under conditions where streptavidin is prevented from re-binding to the nucleic acid (excess biotin), displacement will result in the accumulation of free ssDNA. All the reactions are quenched with EDTA to block the ATPase activity of Pif1 and poly(dT) to trap dissociated Pif1.
Figure 6.
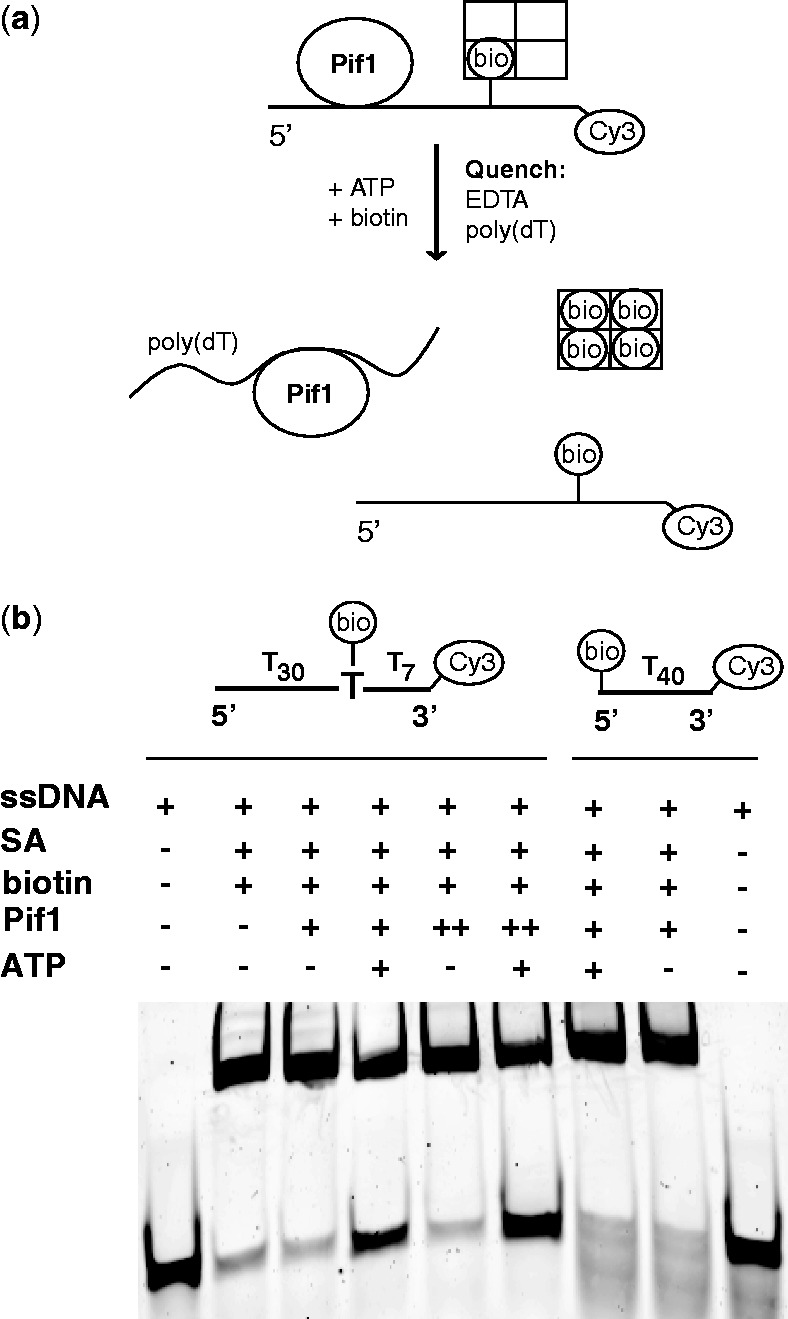
Pif1 can displace streptavidin from ssDNA. (a) Schematic of the displacement reaction (b) Unwinding reactions in Buffer T100 are monitored via the fluorescence of the Cy3-labeled substrates indicated in the figure (see Materials and Methods for details). Lanes 1 and 9, substrates alone. Lane 2, complex of 400 nM substrate with streptavidin (4-fold excess) followed by the addition of free biotin (10-fold excess relative to streptavidin). Lanes 3 and 8, complex of 400 nM substrates with streptavidin is reacted with 200 nM Pif1 (1:2 ratio to substrate, + ) followed by the addition of free biotin. Lanes 4 and 7, same complexes as in lanes 3 and 8 followed by the addition of free biotin and 1 mM ATP. Lanes 5 and 6, same reactions as in lanes 3 and 4 but performed with a 2:1 ratio (++) of Pif1 to substrate.
Binding of streptavidin to a biotin placed in proximity of the 3′ end of the ssDNA results in the formation of a low mobility complex and, on the time scale of the experiment, addition of excess, free biotin does not lead to dissociation of bound streptavidin (Figure 6b, lane 2). When a complex of Pif1 with streptavidin-bound ssDNA (formed at a 1:2 or a 2:1 ratio of Pif1 to ssDNA) is incubated with excess biotin for 10 min in the absence of ATP, no accumulation of free ssDNA is detected (Figure 6b, lanes 3 and 5). This indicates that the simple binding of Pif1 to ssDNA does not lead to displacement of streptavidin. However, if ATP is added immediately after addition of excess biotin and the reaction incubated for 10 min before quenching, free ssDNA is generated (Figure 6b, lanes 4 and 6). This suggests that during ATP hydrolysis and translocation Pif1 can displace streptavidin bound to the ssDNA. When the biotin is placed at the 5′ end of the ssDNA (Figure 6b, lanes 7–9), no streptavidin displacement is observed, once again consistent with the 5′ to 3′ directionality of translocation (Figure 1).
DISCUSSION
In this study we showed that a monomer of Pif1 is able to translocate on ssDNA with a 5′ to 3′ directionality, consistent with the polarity observed for its helicase activity (3–5). Interestingly, all the experiments monitoring the helicase activity of Pif1 have been performed under conditions of large excess of the helicase (6,15,22,23). We recently showed that under these conditions Pif1 forms a dimer on the ssDNA tail of the DNA substrates to be unwound (23). This suggests that a dimeric species of Pif1 might be responsible for the unwinding activity or at least for the initial species poised to catalyse the reaction under these conditions (23). In its function as a helicase Pif1 must be able to translocate along at least one ssDNA strand while the other strand of the duplex is being displaced. In this work we show that indeed monomers of Pif1 can translocate on ssDNA in the 5′ to 3′ direction. How and whether the translocase activity of Pif1 is changed during unwinding is not yet known. The data also show that while a monomer of Pif1 can translocate on ssDNA and has some unwinding activity, formation of a dimer leads to a stimulation of the helicase activity. Whether formation of a dimer of Pif1 also leads to a more efficient translocase on ssDNA is currently not known. These observations suggest that regulation of the oligomeric state of Pif1 on DNA might play an important role in determining whether Pif1 is able to unwind efficiently double-stranded nucleic acids (helicase). Modulation of the oligomeric state as a possible mechanism for regulating helicase activity has strong experimental support for other systems (24). Analysis of the translocation and unwinding activities of Escherichia coli UvrD and Rep and B. stearothermophilus PcrA shows that while a monomer of the enzyme can translocate on ssDNA it cannot unwind even short dsDNA substrates (26,27,33,35,52–54). For these systems helicase activity (i.e. unwinding) is achieved either via dimerization, relief of domain inhibition or interaction with an effector protein (24,28,53,55). Recently, it has been shown that UvrD can load at specific ss/dsDNA junctions in an orientation that allows translocation away from the junction along the ssDNA, potentially facilitating RecA displacement from the ssDNA (35). The UvrD homolog in S. cerevisiae, Srs2, is also able to unwind dsDNA and it can translocate along ssDNA (36). The translocase activity of Srs2 might be used to facilitate displacement of Rad51 bound to ssDNA (56–61). In contrast, biochemical analysis of the unwinding activity of E.coli TraI, RecG, RecQ and T4 phage Dda and HCV NS3 suggests that in these cases a monomer is able to unwind dsDNA (62–68). However, for some of these systems (i.e. RecQ, Dda and NS3) it has also been shown that oligomerization stimulates the helicase activity (65,66,68–70). The lack of a clear all-or-none effect of monomer versus dimer species on the unwinding activity suggests that Pif1 behaves similarly to the latter helicases where oligomerization plays a stimulatory role (24,55,65,66,68–70).
Analysis of the ssDNA translocation time courses in Figure 2 by monitoring the Cy3 fluorescence peak time as function of the ssDNA length provides clear evidence that Pif1 translocates on ssDNA. However, as already pointed out this analysis is a first-order approximation and its assumptions and caveats have been clearly discussed (32,43). More to the point of this work, the shape of the Cy3 fluorescence time courses clearly shows a more complex profile than accounted for by a simple translocation mechanism (e.g. a basic one population n-step sequential mechanism (27,32)). To our surprise the time courses of Pif1 translocation show the presence of a second peak in the Cy3 fluorescence. This second peak is more prominent for longer ssDNA lengths and lower NaCl concentrations. We showed that the appearance of this second peak in the translocation signal of Pif1 could not be ascribed to the presence of a small fraction of dimeric enzyme, to a simple fluorophore effect, to an effect of heparin as a protein trap, to a temperature effect, to a partially altered ATP-binding site or to a specific base-effect of nucleotide binding/hydrolysis or ADP accumulation. Rather, the simplest mechanism that can give rise to such a behavior is the presence on ssDNA of two independent populations of Pif1, both able to translocate on ssDNA but unable to interconvert between each other on the time scale of translocation (Scheme 1). In the basic version of this model, each population of Pif1 is assumed to initially bind randomly to the ssDNA and then translocate unidirectionally toward the 3′ end of the ssDNA with an n-step sequential mechanism. On the one hand, this simplified model captures the appearance of the second peak in the Cy3 fluorescence time courses at ATP concentrations where the presence of the second population of translocating Pif1 is significant (low NaCl concentration). On the other hand, this simplified translocation scheme does not fit the faster peak as well, suggesting that a more complex mechanism needs to be considered. Simulations of different simple variations to Scheme 1 suggest that the discrepancy between the simplified model and the observed signal for the fast population of Pif1 cannot simply be ascribed to the presence of an initial isomerization of DNA-bound Pif1 between a non-productive and a productive state for translocation (Supplementary Figure S7d). Interestingly, the assumption that for the longer lengths of ssDNA a small fraction of Pif1 has an initial bias for the center of the lattice is able to better describe the behavior of the fast moving population (Supplementary Figure S8). In these simulations we used the kinetic parameters calculated from the simplified model and we only changed the relative fraction of Pif1 bound to different positions along the ssDNA. This suggests that a small bias of Pif1 for the center of the ssDNA does not lead to a strong effect on the observed kinetic parameters but rather on the observed shape of the translocation signal. With our current knowledge of the system and given the complexity of the mechanism this suggests that the translocation parameters determined from fitting all the data to Scheme 1 provide a reliable estimate of these parameters. Therefore, the data in Figure 4c suggest that at saturating concentrations of ATP the two populations of Pif1 translocate on ssDNA with different macroscopic rate constants. The second population of Pif1 translocates with a macroscopic rate that is ∼half of the fast moving one (81 ± 8 nt/s versus 35 ± 5 nt/s). Also, according to Scheme 1 the determined kinetic step-size shows a marked non-linear dependence upon ATP concentration suggesting a step-size for Pif1 on the order of 1–2 nt at limiting concentrations of ATP (Results and Figure 4d).
It is evident from the above discussion that the mechanism of Pif1 translocation on ssDNA is more complex than could be inferred based on only a simple time-to-peak analysis of the translocation profiles. The observation of the presence on ssDNA of a second population of translocating Pif1 is novel and exciting. Currently, the molecular origin of the second population of Pif1 and the origin of the apparent bias of the fast population for the center of the ssDNA are not known. Interestingly, both appear only when we examine translocation of Pif1 on single-stranded nucleic acids that are at least three times its contact site-size (∼6–8 nt) (23) and at NaCl concentrations where the affinity for ssDNA is increased (RG, unpublished). It is tempting to speculate that a possible origin for these behaviors might be due to a partial wrapping of ssDNA around Pif1. In this case, it would be expected that wrapping would lead to a decreased dissociation rate constant from ssDNA. Consistent with this expectation, in the presence of ATPγS the apparent dissociation rate constant of Pif1 from internal sites (poly(dT)) is lower than from short DNA (Supplementary Figure S7). In any case, the fraction of Pif1 bound to ssDNA that contributes to the second population is rather small. Also, whether this population of Pif1 has any role in the mechanism of unwinding or telomerase displacement remains to be determined.
Pif1 is the only helicase in yeast that has been shown to have a direct effect on the telomerase (19). Biochemical and genetic evidence shows that Pif1 acts as an inhibitor of the telomerase (6,9). It has been shown in vitro that Pif1 can displace the minimal catalytic active telomerase (Est2–TLC1 RNA complex) bound to single-stranded telomeric sequences (6). Displacement of the telomerase by Pif1 is suggested to originate from the ability of Pif1 to unwind the RNA–DNA heteroduplex formed between the telomerase TLC1 RNA and the ssDNA at telomeres (6,22). This suggestion follows from the observation that Pif1 is more efficient in unwinding RNA–DNA heteroduplexes than dsDNA model substrates (22). The activity of Pif1 on the telomerase clearly relies on its ability to hydrolyse ATP (a mutant in the Walker A site does not displace the telomerase) (6). Interestingly, in vivo over-expression of Pif1 also leads to the displacement of Est1, one of the accessory proteins of the telomerase (6). The mechanism by which in vivo over-expression of Pif1 leads to dissociation of the telomerase and Est1 remains to be determined. Est1 not only interacts with the TLC1 RNA of the telomerase but also with Cdc13, the single-stranded DNA-binding protein at telomerase (71–74). Moreover, in addition to the active site where the RNA–DNA hybrid is formed between the TLC1 RNA and the 3′ end of the telomeric ssDNA, Est2 contains a separate domain (the ‘anchor’ site) that is important for its interaction with the ssDNA of the telomere (75,76). Finally, mutational analysis of Est2 has identified few residues that are important for Pif1 function (77). Interestingly, pull-down experiments did not show a direct interaction between Pif1 and Est2, rather they showed a yet unexplained interaction of Pif1 with TLC1 RNA (77).
The complex network of interactions of the telomerase bound at the telomere and the available experimental evidence on Pif1 suggest that while the helicase activity of Pif1 could play a role in the displacement of the telomerase, it might not be the sole factor. The observation in this work that Pif1 monomers can translocate along ssDNA opens the possibility that this activity could contribute to the displacement of the telomerase by relieving specific telomerase–ssDNA interactions. In this regard, direct evidence of a role of Pif1 translocase activity in the displacement of the telomerase is not yet available. However, a prerequisite for this hypothesis is that the translocation activity of Pif1 is not used exclusively during the unwinding of duplex nucleic acids but that it can be used for other functions (e.g. protein displacement) that do not require helicase activity. As proof of principle, in this work we used streptavidin displacement as a proxy for protein displacement from ssDNA and show that Pif1 translocase activity can indeed be used for an activity that is independent of unwinding. The data in Figure 6 show that in the presence of ATP either a monomer or a dimer of Pif1 can displace streptavidin bound to a biotin placed in close proximity of the 3′ end of the ssDNA. When streptavidin is bound to a biotin at the 5′ end of the ssDNA no displacement is observed. These data are consistent with the ability of Pif1 to translocate in the 5′ to 3′ direction and suggest that the translocation activity of Pif1 could be used in activities other than unwinding. We would like to point out that we are not suggesting that Pif1 displaces streptavidin therefore it displaces the telomerase. In this contest, streptavidin displacement assay is used to simply suggest that translocation might be used to perform activities other than unwinding and that the proposed helicase activity of Pif1 in displacing the telomerase might not be the sole contributing factor. Whether this activity might be contributing to the displacement of the telomerase remains to be explored. Also, it should be pointed out that the efficiency of streptavidin displacement is low. If indeed the translocation and protein displacement activities of Pif1 were to contribute to the mechanism of telomerase displacement, it is possible that specific and transient interactions would lead to an increase in the efficiency of the reaction.
Recent work on the effect of different helicases on the ability of the replication fork to progress through sites that are difficult to replicate (either because of DNA structural barriers or tightly bound proteins) suggest a possible role of Pif1 in helping the replication fork to move more efficiently across sites of the DNA bound by proteins (78). It remains to be determined whether this function is coupled to the helicase activity of Pif1 or it originates from the ability of Pif1 to translocate on ssDNA as shown in this work. Finally, Pif1 down regulates the de novo telomere addition to double-stranded DNA breaks by the telomerase (19–21,79). It is currently not known whether the mechanism of telomerase inhibition by Pif1 at either telomeres or DSBs is the same. However, it has been shown that phosphorylation of Pif1 by the checkpoint kinases specifically regulates the activity of Pif1 at DSBs, leaving the Pif1 function at telomeres unaltered (79). It remains to be determined whether phosphorylation of Pif1 results in its specific recruitment at DSBs and/or in a change of its biochemical properties (e.g. unwinding versus translocation, monomer versus dimer) that allows for a separation of function.
SUPPLEMENTARY DATA
Supplementary Data are available at NAR Online: Supplementary Tables 1–3, Supplementary Figures 1–9, Supplementary Methods and Supplementary References [80–87].
FUNDING
National Institutes of Health (NIH) [GM098509 to R.G.]. Funding for open access charge: NIH [GM098509].
Conflict of interest statement. None declared.
Supplementary Material
ACKNOWLEDGEMENTS
We thank T.M. Lohman and his group for insightful and stimulating discussions, for open access to the softwares used to fit the translocation data and for access to their large collection of modified oligonucleotides used in the testing phase of this project. We thank Dr Barranco-Medina for help in the initial stages of this project.
REFERENCES
- 1.Bessler JB, Torredagger JZ, Zakian VA. The Pif1p subfamily of helicases: region-specific DNA helicases? Trends Cell Biol. 2001;11:60–65. doi: 10.1016/s0962-8924(00)01877-8. [DOI] [PubMed] [Google Scholar]
- 2.Boule JB, Zakian VA. Roles of Pif1-like helicases in the maintenance of genomic stability. Nucleic Acids Res. 2006;34:4147–4153. doi: 10.1093/nar/gkl561. [DOI] [PMC free article] [PubMed] [Google Scholar]
- 3.Lahaye A, Leterme S, Foury F. PIF1 DNA helicase from Saccharomyces cerevisiae. Biochemical characterization of the enzyme. J. Biol. Chem. 1993;268:26155–26161. [PubMed] [Google Scholar]
- 4.Lahaye A, Stahl H, Thines-Sempoux D, Foury F. PIF1: a DNA helicase in yeast mitochondria. Embo J. 1991;10:997–1007. doi: 10.1002/j.1460-2075.1991.tb08034.x. [DOI] [PMC free article] [PubMed] [Google Scholar]
- 5.Bochman ML, Sabouri N, Zakian VA. Unwinding the functions of the Pif1 family helicases. DNA Repair (Amst) 9:237–249. doi: 10.1016/j.dnarep.2010.01.008. [DOI] [PMC free article] [PubMed] [Google Scholar]
- 6.Boule JB, Vega LR, Zakian VA. The yeast Pif1p helicase removes telomerase from telomeric DNA. Nature. 2005;438:57–61. doi: 10.1038/nature04091. [DOI] [PubMed] [Google Scholar]
- 7.Budd ME, Reis CC, Smith S, Myung K, Campbell JL. Evidence suggesting that Pif1 helicase functions in DNA replication with the Dna2 helicase/nuclease and DNA polymerase delta. Mol. Cell. Biol. 2006;26:2490–2500. doi: 10.1128/MCB.26.7.2490-2500.2006. [DOI] [PMC free article] [PubMed] [Google Scholar]
- 8.Ivessa AS, Zhou JQ, Zakian VA. The Saccharomyces Pif1p DNA helicase and the highly related Rrm3p have opposite effects on replication fork progression in ribosomal DNA. Cell. 2000;100:479–489. doi: 10.1016/s0092-8674(00)80683-2. [DOI] [PubMed] [Google Scholar]
- 9.Zhou J, Monson EK, Teng SC, Schulz VP, Zakian VA. Pif1p helicase, a catalytic inhibitor of telomerase in yeast. Science. 2000;289:771–774. doi: 10.1126/science.289.5480.771. [DOI] [PubMed] [Google Scholar]
- 10.Doudican NA, Song B, Shadel GS, Doetsch PW. Oxidative DNA damage causes mitochondrial genomic instability in Saccharomyces cerevisiae. Mol. Cell. Biol. 2005;25:5196–5204. doi: 10.1128/MCB.25.12.5196-5204.2005. [DOI] [PMC free article] [PubMed] [Google Scholar]
- 11.O'Rourke TW, Doudican NA, Mackereth MD, Doetsch PW, Shadel GS. Mitochondrial dysfunction due to oxidative mitochondrial DNA damage is reduced through cooperative actions of diverse proteins. Mol. Cell. Biol. 2002;22:4086–4093. doi: 10.1128/MCB.22.12.4086-4093.2002. [DOI] [PMC free article] [PubMed] [Google Scholar]
- 12.Stith CM, Sterling J, Resnick MA, Gordenin DA, Burgers PM. Flexibility of eukaryotic Okazaki fragment maturation through regulated strand displacement synthesis. J. Biol. Chem. 2008;283:34129–34140. doi: 10.1074/jbc.M806668200. [DOI] [PMC free article] [PubMed] [Google Scholar]
- 13.Pike JE, Henry RA, Burgers PM, Campbell JL, Bambara RA. An alternative pathway for Okazaki fragment processing: resolution of fold-back flaps by Pif1 helicase. J. Biol. Chem. 2010;285:41712–41723. doi: 10.1074/jbc.M110.146894. [DOI] [PMC free article] [PubMed] [Google Scholar]
- 14.Pike JE, Burgers PM, Campbell JL, Bambara RA. Pif1 helicase lengthens some Okazaki fragment flaps necessitating Dna2 nuclease/helicase action in the two-nuclease processing pathway. J. Biol. Chem. 2009;284:25170–25180. doi: 10.1074/jbc.M109.023325. [DOI] [PMC free article] [PubMed] [Google Scholar]
- 15.Paeschke K, Capra JA, Zakian VA. DNA replication through G-quadruplex motifs is promoted by the Saccharomyces cerevisiae Pif1 DNA helicase. Cell. 2011;145:678–691. doi: 10.1016/j.cell.2011.04.015. [DOI] [PMC free article] [PubMed] [Google Scholar]
- 16.Ribeyre C, Lopes J, Boule JB, Piazza A, Guedin A, Zakian VA, Mergny JL, Nicolas A. The yeast Pif1 helicase prevents genomic instability caused by G-quadruplex-forming CEB1 sequences in vivo. PLoS Genet. 2009;5 doi: 10.1371/journal.pgen.1000475. e1000475. [DOI] [PMC free article] [PubMed] [Google Scholar]
- 17.Bochman ML, Judge CP, Zakian VA. The Pif1 family in prokaryotes: what are our helicases doing in your bacteria? Mol. Biol. Cell. 2011;22:1955–1959. doi: 10.1091/mbc.E11-01-0045. [DOI] [PMC free article] [PubMed] [Google Scholar]
- 18.Lopes J, Piazza A, Bermejo R, Kriegsman B, Colosio A, Teulade-Fichou MP, Foiani M, Nicolas A. G-quadruplex-induced instability during leading-strand replication. Embo J. 2011;30:4033–4046. doi: 10.1038/emboj.2011.316. [DOI] [PMC free article] [PubMed] [Google Scholar]
- 19.Schulz VP, Zakian VA. The saccharomyces PIF1 DNA helicase inhibits telomere elongation and de novo telomere formation. Cell. 1994;76:145–155. doi: 10.1016/0092-8674(94)90179-1. [DOI] [PubMed] [Google Scholar]
- 20.Myung K, Chen C, Kolodner RD. Multiple pathways cooperate in the suppression of genome instability in Saccharomyces cerevisiae. Nature. 2001;411:1073–1076. doi: 10.1038/35082608. [DOI] [PubMed] [Google Scholar]
- 21.Pennaneach V, Putnam CD, Kolodner RD. Chromosome healing by de novo telomere addition in Saccharomyces cerevisiae. Mol. Microbiol. 2006;59:1357–1368. doi: 10.1111/j.1365-2958.2006.05026.x. [DOI] [PubMed] [Google Scholar]
- 22.Boule JB, Zakian VA. The yeast Pif1p DNA helicase preferentially unwinds RNA DNA substrates. Nucleic Acids Res. 2007;35:5809–5818. doi: 10.1093/nar/gkm613. [DOI] [PMC free article] [PubMed] [Google Scholar]
- 23.Barranco-Medina S, Galletto R. DNA binding induces dimerization of Saccharomyces cerevisiae Pif1. Biochemistry. 2010;49:8445–8454. doi: 10.1021/bi100984j. [DOI] [PubMed] [Google Scholar]
- 24.Lohman TM, Tomko EJ, Wu CG. Non-hexameric DNA helicases and translocases: mechanisms and regulation. Nat. Rev. Mol. Cell Biol. 2008;9:391–401. doi: 10.1038/nrm2394. [DOI] [PubMed] [Google Scholar]
- 25.Lohman TM, Bjornson KP. Mechanisms of helicase-catalyzed DNA unwinding. Ann. Rev. Biochem. 1996;65:169–214. doi: 10.1146/annurev.bi.65.070196.001125. [DOI] [PubMed] [Google Scholar]
- 26.Maluf NK, Fischer CJ, Lohman TM. A Dimer of Escherichia coli UvrD is the active form of the helicase in vitro. J. Mol. Biol. 2003;325:913–935. doi: 10.1016/s0022-2836(02)01277-9. [DOI] [PubMed] [Google Scholar]
- 27.Fischer CJ, Maluf NK, Lohman TM. Mechanism of ATP-dependent translocation of E.coli UvrD monomers along single-stranded DNA. J. Mol. Biol. 2004;344:1287–1309. doi: 10.1016/j.jmb.2004.10.005. [DOI] [PubMed] [Google Scholar]
- 28.Brendza KM, Cheng W, Fischer CJ, Chesnik MA, Niedziela-Majka A, Lohman TM. Autoinhibition of Escherichia coli Rep monomer helicase activity by its 2B subdomain. Proc. Natl Acad. Sci. USA. 2005;102:10076–10081. doi: 10.1073/pnas.0502886102. [DOI] [PMC free article] [PubMed] [Google Scholar]
- 29.Kowalczykowski SC, Lonberg N, Newport JW, von Hippel PH. Interactions of bacteriophage T4-coded gene 32 protein with nucleic acids. I. Characterization of the binding interactions. J. Mol. Biol. 1981;145:75–104. doi: 10.1016/0022-2836(81)90335-1. [DOI] [PubMed] [Google Scholar]
- 30.Cantor CR, Schimmel PR. Biophysical Chemistry. W.H. Freeman and Company; 1980. [Google Scholar]
- 31.Dillingham MS, Wigley DB, Webb MR. Direct measurement of single-stranded DNA translocation by PcrA helicase using the fluorescent base analogue 2-aminopurine. Biochemistry. 2002;41:643–651. doi: 10.1021/bi011137k. [DOI] [PubMed] [Google Scholar]
- 32.Fischer CJ, Lohman TM. ATP-dependent translocation of proteins along single-stranded DNA: models and methods of analysis of pre-steady state kinetics. J. Mol. Biol. 2004;344:1265–1286. doi: 10.1016/j.jmb.2004.10.004. [DOI] [PubMed] [Google Scholar]
- 33.Niedziela-Majka A, Chesnik MA, Tomko EJ, Lohman TM. Bacillus stearothermophilus PcrA monomer is a single-stranded DNA translocase but not a processive helicase in vitro. J. Biol. Chem. 2007;282:27076–27085. doi: 10.1074/jbc.M704399200. [DOI] [PubMed] [Google Scholar]
- 34.Wu CG, Bradford C, Lohman TM. Escherichia coli RecBC helicase has two translocase activities controlled by a single ATPase motor. Nat. Struct. Mol. Biol. 2010;17:1210–1217. doi: 10.1038/nsmb.1901. [DOI] [PMC free article] [PubMed] [Google Scholar]
- 35.Tomko EJ, Fischer CJ, Niedziela-Majka A, Lohman TM. A nonuniform stepping mechanism for E. coli UvrD monomer translocation along single-stranded DNA. Mol. Cell. 2007;26:335–347. doi: 10.1016/j.molcel.2007.03.024. [DOI] [PMC free article] [PubMed] [Google Scholar]
- 36.Antony E, Tomko EJ, Xiao Q, Krejci L, Lohman TM, Ellenberger T. Srs2 disassembles Rad51 filaments by a protein-protein interaction triggering ATP turnover and dissociation of Rad51 from DNA. Mol. Cell. 2009;35:105–115. doi: 10.1016/j.molcel.2009.05.026. [DOI] [PMC free article] [PubMed] [Google Scholar]
- 37.Rajendar B, Lucius AL. Molecular mechanism of polypeptide translocation catalyzed by the Escherichia coli ClpA protein translocase. J. Mol. Biol. 2010;399:665–679. doi: 10.1016/j.jmb.2010.03.061. [DOI] [PubMed] [Google Scholar]
- 38.Graham JE, Sherratt DJ, Szczelkun MD. Sequence-specific assembly of FtsK hexamers establishes directional translocation on DNA. Proc. Natl Acad. Sci. USA. 2010;107:20263–20268. doi: 10.1073/pnas.1007518107. [DOI] [PMC free article] [PubMed] [Google Scholar]
- 39.Seidel R, Bloom JG, Dekker C, Szczelkun MD. Motor step size and ATP coupling efficiency of the dsDNA translocase EcoR124I. Embo J. 2008;27:1388–1398. doi: 10.1038/emboj.2008.69. [DOI] [PMC free article] [PubMed] [Google Scholar]
- 40.McClelland SE, Dryden DT, Szczelkun MD. Continuous assays for DNA translocation using fluorescent triplex dissociation: application to type I restriction endonucleases. J. Mol. Biol. 2005;348:895–915. doi: 10.1016/j.jmb.2005.03.018. [DOI] [PubMed] [Google Scholar]
- 41.Matlock DL, Yeruva L, Byrd AK, Mackintosh SG, Langston C, Brown C, Cameron CE, Fischer CJ, Raney KD. Investigation of translocation, DNA unwinding, and protein displacement by NS3h, the helicase domain from the hepatitis C virus helicase. Biochemistry. 2010;49:2097–2109. doi: 10.1021/bi901977k. [DOI] [PMC free article] [PubMed] [Google Scholar]
- 42.Fischer CJ, Tomko EJ, Wu CG, Lohman TM. Fluorescence methods to study DNA translocation and unwinding kinetics by nucleic Acid motors. Methods Mol. Biol. 2012;875:85–104. doi: 10.1007/978-1-61779-806-1_5. [DOI] [PMC free article] [PubMed] [Google Scholar]
- 43.Tomko EJ, Fischer CJ, Lohman TM. Ensemble methods for monitoring enzyme translocation along single stranded nucleic acids. Methods. 2010;51:269–276. doi: 10.1016/j.ymeth.2010.03.010. [DOI] [PMC free article] [PubMed] [Google Scholar]
- 44.Fischer CJ, Wooten L, Tomko EJ, Lohman TM. Kinetics of motor protein translocation on single-stranded DNA. Methods Mol. Biol. 2010;587:45–56. doi: 10.1007/978-1-60327-355-8_4. [DOI] [PMC free article] [PubMed] [Google Scholar]
- 45.Byrd AK, Raney KD. Protein displacement by an assembly of helicase molecules aligned along single-stranded DNA. Nat. Struct. Mol. Biol. 2004;11:531–538. doi: 10.1038/nsmb774. [DOI] [PubMed] [Google Scholar]
- 46.Morris PD, Byrd AK, Tackett AJ, Cameron CE, Tanega P, Ott R, Fanning E, Raney KD. Hepatitis C virus NS3 and simian virus 40 T antigen helicases displace streptavidin from 5'-biotinylated oligonucleotides but not from 3'-biotinylated oligonucleotides: evidence for directional bias in translocation on single-stranded DNA. Biochemistry. 2002;41:2372–2378. doi: 10.1021/bi012058b. [DOI] [PubMed] [Google Scholar]
- 47.Morris PD, Tackett AJ, Raney KD. Biotin-streptavidin-labeled oligonucleotides as probes of helicase mechanisms. Methods. 2001;23:149–159. doi: 10.1006/meth.2000.1116. [DOI] [PubMed] [Google Scholar]
- 48.Morris PD, Raney KD. DNA helicases displace streptavidin from biotin-labeled oligonucleotides. Biochemistry. 1999;38:5164–5171. doi: 10.1021/bi9822269. [DOI] [PubMed] [Google Scholar]
- 49.Byrd AK, Matlock DL, Bagchi D, Aarattuthodiyil S, Harrison D, Croquette V, Raney KD. Dda helicase tightly couples translocation on single-stranded DNA to unwinding of duplex DNA: Dda is an optimally active helicase. J. Mol. Biol. 2012;420:141–154. doi: 10.1016/j.jmb.2012.04.007. [DOI] [PMC free article] [PubMed] [Google Scholar]
- 50.Martinez-Senac MM, Webb MR. Mechanism of translocation and kinetics of DNA unwinding by the helicase RecG. Biochemistry. 2005;44:16967–16976. doi: 10.1021/bi0512851. [DOI] [PubMed] [Google Scholar]
- 51.Lucius AL, Maluf NK, Fischer CJ, Lohman TM. General methods for analysis of sequential “n-step” kinetic mechanisms: application to single turnover kinetics of helicase-catalyzed DNA unwinding. Biophys. J. 2003;85:2224–2239. doi: 10.1016/s0006-3495(03)74648-7. [DOI] [PMC free article] [PubMed] [Google Scholar]
- 52.Ali JA, Maluf NK, Lohman TM. An oligomeric form of E. coli UvrD is required for optimal helicase activity. J. Mol. Biol. 1999;293:815–834. doi: 10.1006/jmbi.1999.3185. [DOI] [PubMed] [Google Scholar]
- 53.Cheng W, Hsieh J, Brendza KM, Lohman TM. E. coli Rep oligomers are required to initiate DNA unwinding in vitro. J. Mol. Biol. 2001;310:327–350. doi: 10.1006/jmbi.2001.4758. [DOI] [PubMed] [Google Scholar]
- 54.Myong S, Rasnik I, Joo C, Lohman TM, Ha T. Repetitive shuttling of a motor protein on DNA. Nature. 2005;437:1321–1325. doi: 10.1038/nature04049. [DOI] [PubMed] [Google Scholar]
- 55.Soultanas P, Dillingham MS, Papadopoulos F, Phillips SE, Thomas CD, Wigley DB. Plasmid replication initiator protein RepD increases the processivity of PcrA DNA helicase. Nucleic Acids Res. 1999;27:1421–1428. doi: 10.1093/nar/27.6.1421. [DOI] [PMC free article] [PubMed] [Google Scholar]
- 56.Veaute X, Delmas S, Selva M, Jeusset J, Le Cam E, Matic I, Fabre F, Petit MA. UvrD helicase, unlike Rep helicase, dismantles RecA nucleoprotein filaments in Escherichia coli. Embo J. 2004;24:180–189. doi: 10.1038/sj.emboj.7600485. [DOI] [PMC free article] [PubMed] [Google Scholar]
- 57.Flores MJ, Sanchez N, Michel B. A fork-clearing role for UvrD. Mol. Microbiol. 2005;57:1664–1675. doi: 10.1111/j.1365-2958.2005.04753.x. [DOI] [PubMed] [Google Scholar]
- 58.Veaute X, Delmas S, Selva M, Jeusset J, Le Cam E, Matic I, Fabre F, Petit MA. UvrD helicase, unlike Rep helicase, dismantles RecA nucleoprotein filaments in Escherichia coli. Embo J. 2005;24:180–189. doi: 10.1038/sj.emboj.7600485. [DOI] [PMC free article] [PubMed] [Google Scholar]
- 59.Veaute X, Jeusset J, Soustelle C, Kowalczykowski SC, Le Cam E, Fabre F. The Srs2 helicase prevents recombination by disrupting Rad51 nucleoprotein filaments. Nature. 2003;423:309–312. doi: 10.1038/nature01585. [DOI] [PubMed] [Google Scholar]
- 60.Krejci L, Van Komen S, Li Y, Villemain J, Reddy MS, Klein H, Ellenberger T, Sung P. DNA helicase Srs2 disrupts the Rad51 presynaptic filament. Nature. 2003;423:305–309. doi: 10.1038/nature01577. [DOI] [PubMed] [Google Scholar]
- 61.Krejci L, Macris M, Li Y, Van Komen S, Villemain J, Ellenberger T, Klein H, Sung P. Role of ATP hydrolysis in the antirecombinase function of Saccharomyces cerevisiae Srs2 protein. J. Biol. Chem. 2004;279:23193–23199. doi: 10.1074/jbc.M402586200. [DOI] [PubMed] [Google Scholar]
- 62.Sikora B, Eoff RL, Matson SW, Raney KD. DNA unwinding by Escherichia coli DNA helicase I (TraI) provides evidence for a processive monomeric molecular motor. J. Biol. Chem. 2006;281:36110–36116. doi: 10.1074/jbc.M604412200. [DOI] [PubMed] [Google Scholar]
- 63.McGlynn P, Mahdi AA, Lloyd RG. Characterisation of the catalytically active form of RecG helicase. Nucleic Acids Res. 2000;28:2324–2332. doi: 10.1093/nar/28.12.2324. [DOI] [PMC free article] [PubMed] [Google Scholar]
- 64.Zhang XD, Dou SX, Xie P, Hu JS, Wang PY, Xi XG. Escherichia coli RecQ is a rapid, efficient, and monomeric helicase. J. Biol. Chem. 2006;281:12655–12663. doi: 10.1074/jbc.M513089200. [DOI] [PubMed] [Google Scholar]
- 65.Eoff RL, Raney KD. Kinetic mechanism for DNA unwinding by multiple molecules of Dda helicase aligned on DNA. Biochemistry. 2010;49:4543–4553. doi: 10.1021/bi100061v. [DOI] [PMC free article] [PubMed] [Google Scholar]
- 66.Jennings TA, Mackintosh SG, Harrison MK, Sikora D, Sikora B, Dave B, Tackett AJ, Cameron CE, Raney KD. NS3 helicase from the hepatitis C virus can function as a monomer or oligomer depending on enzyme and substrate concentrations. J. Biol. Chem. 2009;284:4806–4814. doi: 10.1074/jbc.M805540200. [DOI] [PMC free article] [PubMed] [Google Scholar]
- 67.Dumont S, Cheng W, Serebrov V, Beran RK, Tinoco I, Jr, Pyle AM, Bustamante C. RNA translocation and unwinding mechanism of HCV NS3 helicase and its coordination by ATP. Nature. 2006;439:105–108. doi: 10.1038/nature04331. [DOI] [PMC free article] [PubMed] [Google Scholar]
- 68.Serebrov V, Beran RK, Pyle AM. Establishing a mechanistic basis for the large kinetic steps of the NS3 helicase. J. Biol. Chem. 2009;284:2512–2521. doi: 10.1074/jbc.M805460200. [DOI] [PMC free article] [PubMed] [Google Scholar]
- 69.Sikora B, Chen Y, Lichti CF, Harrison MK, Jennings TA, Tang Y, Tackett AJ, Jordan JB, Sakon J, Cameron CE, et al. Hepatitis C virus NS3 helicase forms oligomeric structures that exhibit optimal DNA unwinding activity in vitro. J. Biol. Chem. 2008;283:11516–11525. doi: 10.1074/jbc.M708125200. [DOI] [PMC free article] [PubMed] [Google Scholar]
- 70.Harmon FG, Kowalczykowski SC. Biochemical characterization of the DNA helicase activity of the Escherichia coli RecQ helicase. J. Biol. Chem. 2001;276:232–243. doi: 10.1074/jbc.M006555200. [DOI] [PubMed] [Google Scholar]
- 71.Evans SK, Lundblad V. The Est1 subunit of Saccharomyces cerevisiae telomerase makes multiple contributions to telomere length maintenance. Genetics. 2002;162:1101–1115. doi: 10.1093/genetics/162.3.1101. [DOI] [PMC free article] [PubMed] [Google Scholar]
- 72.Evans SK, Lundblad V. Est1 and Cdc13 as comediators of telomerase access. Science. 1999;286:117–120. doi: 10.1126/science.286.5437.117. [DOI] [PubMed] [Google Scholar]
- 73.Zhou J, Hidaka K, Futcher B. The Est1 subunit of yeast telomerase binds the Tlc1 telomerase RNA. Mol. Cell. Biol. 2000;20:1947–1955. doi: 10.1128/mcb.20.6.1947-1955.2000. [DOI] [PMC free article] [PubMed] [Google Scholar]
- 74.Wu Y, Zakian VA. The telomeric Cdc13 protein interacts directly with the telomerase subunit Est1 to bring it to telomeric DNA ends in vitro. Proc. Natl Acad. Sci. USA. 2011;108:20362–20369. doi: 10.1073/pnas.1100281108. [DOI] [PMC free article] [PubMed] [Google Scholar]
- 75.Lue NF. A physical and functional constituent of telomerase anchor site. J. Biol. Chem. 2005;280:26586–26591. doi: 10.1074/jbc.M503028200. [DOI] [PMC free article] [PubMed] [Google Scholar]
- 76.Xia J, Peng Y, Mian IS, Lue NF. Identification of functionally important domains in the N-terminal region of telomerase reverse transcriptase. Mol. Cell. Biol. 2000;20:5196–5207. doi: 10.1128/mcb.20.14.5196-5207.2000. [DOI] [PMC free article] [PubMed] [Google Scholar]
- 77.Eugster A, Lanzuolo C, Bonneton M, Luciano P, Pollice A, Pulitzer JF, Stegberg E, Berthiau AS, Forstemann K, Corda Y, et al. The finger subdomain of yeast telomerase cooperates with Pif1p to limit telomere elongation. Nat. Struct. Mol. Biol. 2006;13:734–739. doi: 10.1038/nsmb1126. [DOI] [PubMed] [Google Scholar]
- 78.Anand RP, Shah KA, Niu H, Sung P, Mirkin SM, Freudenreich CH. Overcoming natural replication barriers: differential helicase requirements. Nucleic Acids Res. 2012;40:1091–1105. doi: 10.1093/nar/gkr836. [DOI] [PMC free article] [PubMed] [Google Scholar]
- 79.Makovets S, Blackburn EH. DNA damage signalling prevents deleterious telomere addition at DNA breaks. Nat. Cell Biol. 2009;11:1383–1386. doi: 10.1038/ncb1985. [DOI] [PMC free article] [PubMed] [Google Scholar]
- 80.Schuck P. On the analysis of protein self-association by sedimentation velocity analytical ultracentrifugation. Anal. Biochem. 2003;320:104–124. doi: 10.1016/s0003-2697(03)00289-6. [DOI] [PubMed] [Google Scholar]
- 81.Balbo A, Brown PH, Braswell EH, Schuck P. Measuring protein-protein interactions by equilibrium sedimentation. Curr. Protoc. Immunol. 2007 doi: 10.1002/0471142735.im1808s79. Chapter 18, Unit 18 18. [DOI] [PubMed] [Google Scholar]
- 82.Schuck P. Sedimentation analysis of noninteracting and self-associating solutes using numerical solutions to the Lamm equation. Biophys. J. 1998;75:1503–1512. doi: 10.1016/S0006-3495(98)74069-X. [DOI] [PMC free article] [PubMed] [Google Scholar]
- 83.Dam J, Velikovsky CA, Mariuzza RA, Urbanke C, Schuck P. Sedimentation velocity analysis of heterogeneous protein-protein interactions: Lamm equation modeling and sedimentation coefficient distributions c(s) Biophys. J. 2005;89:619–634. doi: 10.1529/biophysj.105.059568. [DOI] [PMC free article] [PubMed] [Google Scholar]
- 84.Galletto R, Jezewska MJ, Bujalowski W. Interactions of the Escherichia coli DnaB helicase hexamer with the replication factor the DnaC protein. Effect of nucleotide cofactors and the ssDNA on protein-protein interactions and the topology of the complex. J. Mol. Biol. 2003;329:441–465. doi: 10.1016/s0022-2836(03)00435-2. [DOI] [PubMed] [Google Scholar]
- 85.Hwang H, Kim H, Myong S. Protein induced fluorescence enhancement as a single molecule assay with short distance sensitivity. Proc. Natl Acad. Sci. USA. 2011;108:7414–7418. doi: 10.1073/pnas.1017672108. [DOI] [PMC free article] [PubMed] [Google Scholar]
- 86.Williams DJ, Hall KB. Monte Carlo applications to thermal and chemical denaturation experiments of nucleic acids and proteins. Method. Enzymol. 2000;321:330–352. doi: 10.1016/s0076-6879(00)21201-9. [DOI] [PubMed] [Google Scholar]
- 87.Lucius AL, Jason Wong C, Lohman TM. Fluorescence stopped-flow studies of single turnover kinetics of E.coli RecBCD helicase-catalyzed DNA unwinding. J. Mol. Biol. 2004;339:731–750. doi: 10.1016/j.jmb.2004.04.009. [DOI] [PubMed] [Google Scholar]
Associated Data
This section collects any data citations, data availability statements, or supplementary materials included in this article.