


Abstract
The metagenomic paradigm allows for an understanding of the metabolic and functional potential of microbes in a community via a study of their proteins. The substrate for protein identification is either the set of individual nucleotide reads generated from metagenomic samples or the set of contig sequences produced by assembling these reads. However, a read-based strategy using reads generated by next-generation sequencing (NGS) technologies, results in an overwhelming majority of partial-length protein predictions. A nucleotide assembly-based strategy does not fare much better, as metagenomic assemblies are typically fragmented and also leave a large fraction of reads unassembled. Here, we present a method for reconstructing complete protein sequences directly from NGS metagenomic data. Our framework is based on a novel short peptide assembler (SPA) that assembles protein sequences from their constituent peptide fragments identified on short reads. The SPA algorithm is based on informed traversals of a de Bruijn graph, defined on an amino acid alphabet, to identify probable paths that correspond to proteins. Using large simulated and real metagenomic data sets, we show that our method outperforms the alternate approach of identifying genes on nucleotide sequence assemblies and generates longer protein sequences that can be more effectively analysed.
INTRODUCTION
Metagenomics pertains to the study of the genomic content of microbial communities using cultivation-independent techniques and has revolutionized the field of microbial ecology (1,2). A fundamental computational problem in metagenomic analysis is assembly, where the goal is to infer from the input set of nucleotide sequence reads, complete or near-complete genome sequences of the microbial species present in the sample. Assembled sequences serve as substrates for gene identification and annotation, and thus form the basis for taxonomic and functional analysis of the community.
Metagenomic projects now routinely use next-generation sequencing (NGS) technologies (3–5) for generating nucleotide sequence data from DNA samples; however, those NGS technologies that allow for a cost-effective and deep sequencing of metagenomic samples, currently generate short reads (75–150 bp). Although nucleotide assembly benefits from the deep coverage afforded by NGS data, other factors like genomic variations at the strain level and differential abundance of the organisms in the community confound de novo reconstruction of genomes.
Published metagenomic studies illustrate the challenge in assembling even medium complexity communities, with assemblies resulting in short contig lengths and leaving a large fraction of the input reads unassembled. For instance, assembly of 6.6 Gb of Sanger data (7.7 million reads of length 850 bp) generated from metagenomic samples collected as part of the Global Ocean Sampling expedition studying surface ocean microbial communities (6) resulted in a contig size (N50) of 1.6 kb with 53% of the reads unassembled. The MetaHIT project (7) generated 576.7 Gb of Illumina GA data (8 billion reads of length 75 bp) and an assembly of these data resulted in a contig size (N50) of 2.2 kb with 57% of the reads unassembled. Metagenomic assembly remains an active area of research with several recently proposed assemblers that have been designed specifically to assemble data generated from mixtures of genomes (8–11). These methods vary in their scalability (to handle large data sets with 10 to 100 million reads) and also in their overall assembly quality.
A consequence of poor nucleotide sequence assemblies is that a vast majority of the gene sequences identified from these data are fragmentary. Annotations of these fragmentary sequences can suffer from a lack of accuracy and specificity. In addition, if annotation and analysis are limited to the assembled data, then a large fraction of the input data can remain unanalysed, leading to an incomplete picture of the community. Although a read-based analysis strategy, involving identification of genes on reads and their subsequent annotation, can be used for data sets containing tens of millions of reads, this strategy becomes computationally prohibitive on data sets containing a few billion (or even hundreds of millions of) reads.
As the availability of long protein sequences is extremely beneficial to any metagenomic data analysis and de novo nucleotide assembly remains a challenge, in this article, we describe an alternate approach to analyse proteins in metagenomic data. We address the problem of assembling complete protein sequences directly from their constituent peptide fragments identified on short reads and without the need for nucleotide assembly. Inference of complete protein sequences from metagenomic data sets will provide a more accurate picture of the functional and metabolic potential of the microbial community. We are motivated by the following observations:
Prokaryotic and viral genomes have high gene coding density. In these genomes, ∼90% of the sequence codes for genes (12). Consequently, a majority of the sequence reads generated by random samplings of these genomes will contain at least part of a protein-coding gene.
Amino acid conservation extends over a larger taxonomic range compared with nucleotide conservation. This follows from redundancy in the genetic code whereby the 64 codons (nucleotide triplets) code for only 20 amino acids, thus allowing for different nucleotide sequences to code for the same protein sequence. The implication of this redundancy is that nucleotide polymorphisms, a striking feature of natural microbial populations (6) and a major confounding factor in nucleotide assembly of related strains, will not be an obstacle when the assembly is carried out at the amino acid level, as there is a high degree of protein sequence conservation across strains from the same species. In fact, if there is conservation in the function of a protein across a wide taxonomic range, there will also be a high degree of similarity in its sequence across this range. This means that the sequence coverage for this protein can be high if that protein is present in many genomes, even if the individual abundances of those genomes are low. The use of amino acid substitution matrices (13,14) will allow for the identification and grouping of fragments belonging to such a protein.
There are de novo gene finders for metagenomic data that can predict genes on short reads with high accuracy and are computationally efficient (15–17). These gene finders can be used to predict fragmentary protein sequences (short peptides) from reads.
We present an assembly framework and describe short peptide assembler (SPA)—a new algorithm for protein reconstruction that can deal with large short-read NGS data sets. Although, in principle, our approach can use data from any of the NGS technologies, we test and evaluate our approach on paired-end short reads from Illumina’s sequencing technology (4). To our knowledge, MetaORFA (18) remains the only publication to-date addressing the problem of protein reconstruction from fragmentary peptide sequences in metagenomic data. This approach, which used a modified version of the EULER algorithm (19) for nucleotide assembly, was demonstrated on metagenomic data generated using the early releases of 454’s pyrosequencing technology.
MATERIALS AND METHODS
Assembly framework
The input to our framework is the set of short nucleotide reads generated from a metagenomic sample. Our assembly framework has three stages—Gene-Finding (GF), Short Peptide Assembler (SPA) and Post Processing (PP). In the GF stage, a metagenomic gene finder is used to identify protein-coding genes from the reads; given the nature of the reads, these predictions will almost exclusively be fragmentary protein sequences (short peptides). The resulting set of short peptides (denoted by S) is the input to the SPA stage. A set of paths corresponding to amino acid sequences is identified by SPA, and this set is further refined in the PP stage to output protein sequences.
Our SPA algorithm uses the concept of a de Bruijn graph (20,21) defined on an amino acid alphabet. A de Bruijn graph G is a directed graph and is constructed from S as follows: the vertices in G denote the distinct k-mers (that is, substrings of length k) present in sequences in S, and the (directed) edges in G represent the distinct (k + 1)-mers present in sequences in S. An edge exists from vertex vi to vertex vj if S has a (k + 1)-mer whose length k prefix corresponds to vi and whose length k suffix corresponds to vj. With this definition, it can be seen that every path traversal in G generates an amino acid sequence, and this sequence has the following property: the prefix (k + 1)-mer of the sequence corresponds to the first edge in this path, and subsequent consecutive (k + 1)-mers in the sequence correspond to consecutive adjacent edges in the path.
Notation
Here, we define the various terms and concepts used in the SPA algorithm description. For vertex v in G, we use mer(v) to denote the k-mer associated with v; similarly, for edge e in G, we use mer(e) to denote the (k + 1)-mer associated with e. For vertex v, we define coverage(v) as the total number of occurrences of mer(v) in sequences in S; we note that multiple occurrences of mer(v) in a protein sequence each contribute to the total count. Similarly, we define coverage(e) for an edge e, as the total number of occurrences of mer(e) in sequences in S. For a vertex v, we define seq(v) to be the subset of sequences in S that contain mer(v). Let P be a path of length l, with the sequence of vertices <v1,v2, … ,vl>, where v1 and vl are the source and sink vertices, respectively, in P. For sink vertex vl, we define n_pred(vl) = vl-n, if l > n, and n_pred(vl) = v1, otherwise (where n is a natural number). For source vertex v1, we define n_succ(v1) = vn + 1, if l > n, and n_succ(v1) = vl, otherwise. We define n_overlap(vl) = |seq(vl)∩seq(n_pred(vl))| and n_overlap(v1) = |seq(v1)∩seq(n_succ(v1))|.
SPA strategy
The assembly process involves traversals of the graph G to identify a set of initial paths. These paths, which are not necessarily edge-disjoint, are seeded by vertices chosen based on their coverage and are constructed using a greedy strategy that chooses the next vertex in the path based on the number of sequences in S that it shares with its neighbours. The initial paths are then merged and extended using their pairwise similarity. Finally, sequences in S that are as-yet unassigned to paths are used to latch and extend these paths. The various merging and latching steps involve the use of paired-end information. Our objective is to identify paths corresponding to full-length true protein sequences while avoiding paths that produce chimeric protein sequences or random amino acid sequences.
SPA algorithm
The graph G is first pre-processed by removing vertices and edges that have low coverage (below a preset threshold), and then re-computing coverage for the neighbours of the removed vertices and edges. The algorithm has the following stages:
Stage 1. Identification of initial path set (IPS): paths that constitute the IPS are identified in greedy traversals of G. The vertices that seed these paths are chosen based on their coverage. To increase the chance of identifying sufficiently long paths (while keeping in mind computational efficiency considerations), we consider only vertices with high coverage as seeds; let C denote this set of seed candidates. It is also desirable to defer selecting as seeds those vertices with high coverage and high degrees, as their associated k-mers may correspond to repeat regions. To implement this, we rank the vertices in C using a function F that takes into account their coverage as well as their in-degree and out-degree; our choice is an exponential weighted function 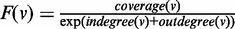 , where
  is a vertex in G.
The vertices in C are considered for seeding paths in the order of decreasing F values. For a seed vertex, we extend its path first by adding a new sink vertex in each step until one of the stopping rules is satisfied. Subsequently, we extend this path by adding a new source vertex in each step until one of the stopping rules is satisfied. When adding a new sink or source vertex to the path, that vertex u is chosen that has a maximum value for n_overlap(u), for a preset value of n. Path extension for a new sink (source) stops when one of the following rules is satisfied: (i) the current sink (source) is a terminal vertex in G; (ii) the n_overlap(u) value for the current sink (source) is below a preset threshold; (iii) any potential new sink (source) is such that the edge connecting it has coverage below a preset threshold; or (iv) repeat handling fails. Repeats manifest themselves as cycles in the graph. Our repeat handling essentially involves keeping track of cycles during graph traversal and continuing extension of the current path as long as a cycle has not been traversed twice in succession.
When a stopping rule has been encountered during the extension of a path, this path is added to IPS. Subsequently, the graph G is updated as follows: first, the sequences in S that contribute to this path are identified and assigned to it. This is done by keeping track of those sequences that contain k-mers contributing to this path. For a path P, let S(P) denote this set of sequences. Each s ∈ S(P) is aligned to the sequence generated by traversing P and is assigned to P if the alignment match score is high and covers nearly the full length of s. These sequences are removed from further consideration, and graph G is subsequently updated by trimming low-coverage vertices and edges. Second, the F values for the vertices in C are also updated, although no re-ranking is done. After these updates to G, the next highest ranked vertex in C is considered for seeding a new path.
Stage 2. Clustering of paths in IPS: highly similar path sequences are merged by a greedy clustering procedure similar to the approach in (22). Briefly, the paths in IPS are processed in order of longest to shortest. A path in IPS that is being processed is compared with existing cluster representatives. If this path sequence is within a preset similarity threshold of a cluster representative, it is aligned to that representative and added to the representative’s cluster; otherwise, this path starts a new cluster (with it being the cluster’s representative). The alignments are carried out using a substitution matrix. Let CPS denote the set of paths constituting the cluster representatives at the end of stage 2.
Stage 3. Recruitment of unassigned sequences in S: sequences in S that do not belong to any paths as yet are compared with the paths in CPS and merged with a path if they are determined to have a high similarity match over most of their length. For computational efficiency, this process is accomplished by anchoring candidate pairs (a read sequence and a path) using their shared k-mers, and then computing the similarity score of the inferred alignment; no indels are allowed in this stage. Let RPS denote the set of paths at the end of this step.
Stage 4. Extension and merging of paths in RPS: pairs of paths that are linked by paired-end reads and either have short overlaps or do not overlap but are bridged by multiple reads are identified and merged. In addition, single paths are extended in one direction if they have multiple reads that support the extension. Subsequently, pairs of paths that have a long overlap (regardless of paired read support) are merged. The alignments in this stage also use a substitution matrix. The resulting set of path sequences constitutes the input to the post-processing step.
Post-processing (PP)
Over-prediction of genes by gene finders can affect the specificity of SPA. We address this issue by re-calling genes on sequences generated by SPA. For a path sequence, the multiple sequence alignment (MSA) of its constituent peptide sequences induces an MSA of their corresponding nucleotide reads. This nucleotide MSA is essentially an assembly of the nucleotide reads. We use the same gene finder that was used in the GF stage, to verify that this stretch of DNA sequence codes for the same amino acid sequence as the original path sequence. The set of paths produced by the last stage of SPA is filtered using this process, and only paths longer than a preset value are output. The resulting set of paths, denoted by  , constitutes the output of the assembler.
SPA output
The assembly output consists of two representations of a path—(i) the sequence that is generated by traversing the vertices of the path and (ii) MSA of its constituent peptide fragments. Various statistics on the path, including path length, depth of coverage at each alignment column and the entropy of each column, are also output.
Implementation
We implemented a prototype of the SPA algorithm in C++ (Supplementary Data SA). In addition to data structures for graph G, we implemented auxiliary data structures for efficient querying. This includes an inverted index using a hash table to store the list of sequences in S for a given k-mer. A path P is implemented using a C++ object and contains identifiers of the sequences in S that belong to P along with their alignment information. The MSA for path P is obtained by aligning the constituent peptide sequences to the path sequence for P.
Our program is available for download at sourceforge (http://sourceforge.net/projects/spa-assembler/).
Data sets used for the evaluations
We used several simulated and real data sets described later in the text to evaluate our approach. Data sets DS1 and DS2 are amino acid sequence sets and were used to evaluate the SPA algorithm alone (without the GF and PP stages of the assembly framework). Data sets DS3, DS4, DS5 and DS6 are nucleotide sequence sets derived from collections of genomes and were used to evaluate the performance of the SPA algorithm in conjunction with the GF and PP stages.
DS1 (individual genomes)
We downloaded protein sets of 1165 (complete) prokaryotic genomes available in GenBank and generated peptide fragments of length 33 amino acids via random sampling, such that each protein sequence had a coverage depth of 100. Each of these 1165 peptide fragment sets was given as input to SPA. Each genome’s protein set was clustered at 95% identity using cd-hit (23), and the resulting set of non-redundant sequences constituted the reference set  for that genome.
DS2 (protein fragments from a collection of genomes)
This data set was created by combining the peptide fragment sets, generated as described for DS1, from genomes of all sequenced Lactobacillus and Streptococcus strains. This combined set consisted of 53 663 385 peptide fragments and was the input to SPA. The reference protein set  consisted of the non-redundant sequences obtained by clustering the full set of proteins from the chosen genomes using cd-hit at 95%.
DS3 (simulated oral metagenome)
We simulated a human oral microbiome community starting with a collection of 25 genomes sequenced from microbes isolated from this environment. This collection included sequenced genomes of Lactobacillus (strains of acidophilus, brevis, casei, fermentum, gasseri, rhamnosus and salivarius), Prevotella melaninogenica, Propionibacterium (strains of acnes), Streptococcus (strains of agalactiae, gordonii, mitis, mutans, pneumonia, pyogenes and sanguinis), Treponema denticola, Veillonella parvula and Fusobacterium nucleatum. These 25 genomes were used to generate a community of 500 genomes using the population sampler in MetaSim (24) that allows generation of offsprings from a single source sequence. The generation was done in a way that the initial 25 genomes did not all contribute the same numbers of offsprings (Supplementary Data SD and Supplementary Table S1). For this generation, the population sampler was run using the Jukes–Cantor model of DNA evolution (25). These 500 genome sequences were then sampled (at 10× depth of coverage) using wgsim (26) to generate 100-bp paired-end reads from inserts of size 300 bp. To study the effect of sequencing errors, we generated two data sets using wgsim, denoted as DS3 (0%) and DS3 (1%), corresponding to 0% sequencing error and 1% sequencing error, respectively. Both DS3 (0%) and DS3 (1%) contained 115 991 500 reads. The reference protein set  in this case was the set of 40 724 non-redundant sequences obtained by clustering the combined set of proteins from the initial 25 genomes using cd-hit at 95%.
DS4 (simulated marine metagenome)
Using a collection of 25 sequenced genomes, we simulated a surface marine metagenomic community containing organisms at varying abundances (27). This collection included strains of Candidatus pelagibacter, Prochlorococcus marinus, Synechococcus, Flavobacteriales, Nitrosococcus oceani, Vibrio, Photobacterium, Erythrobacter, Alteromonas, Roseobacter and Shewanella (Supplementary Data SD and Supplementary Table S1). Two data sets DS4 (0%) and DS4 (1%), each containing 103 915 150 reads, were generated in a manner similar to the method used for DS3. The reference protein set  in this case was the set of 64 913 non-redundant sequences obtained by clustering the combined set of proteins from the initial 25 genomes using cd-hit at 95%.
DS5 (saliva sample)
We downloaded a human microbiome data set (GenBank SRA accession SRS013942) generated from a saliva sample as part of the Human Microbiome Project (HMP) (28). The data set was already quality trimmed and filtered to remove human sequences, and it consisted of 14 637 415 Illumina reads (paired-end 100-bp reads).
DS6 (stool sample)
This data set (GenBank SRA accession SRS014459) consisted of Illumina paired-end reads generated from a stool sample as part of the HMP. It was also already quality trimmed and filtered to remove human sequences, and it consisted of 86 362 260 reads (100-bp reads).
RESULTS AND DISCUSSION
As part of the evaluations using data sets DS3, DS4, DS5 and DS6, we compared our peptide assembly framework with an alternate strategy that involves assembling nucleotide sequence reads and then identifying genes on the assembled contigs. MetaORFA, the peptide reconstruction method that we noted earlier, was not included in our evaluation. Although (to our knowledge) MetaORFA is not currently available as an open-source program, more importantly, it also had a different aim that is not directly comparable with ours. As described in the original article (18), MetaORFA first generates the set of all six-frame translations from the input sequence reads set, and then assembles the peptides that are subsequently searched against reference protein databases for diversity analysis. Because of the nature of the input sequences (six-frame translations), the MetaORFA output will contain a large number of assembled peptide sequences that are not true protein sequences, thus adversely affecting the method’s overall sensitivity and specificity (the criteria we use for our evaluation). Furthermore, the six-frame translation approach does not scale well for large Illumina data sets.
Six different nucleotide assemblers were used in our comparisons (Supplementary Data SB): Velvet (29), MetaVelvet (10), CLC (http://www.clcbio.com), SOAPdenovo (30), Meta-IDBA (9) and IDBA-UD (11). All evaluations were carried out using two different metagenomic gene finders: FragGeneScan (FGS) (16) and MetaGeneAnnotator (MGA) (15). Only output sequences  60 amino acids in length were considered in the evaluation for each method, including ours.
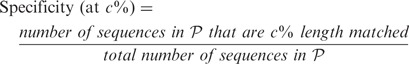
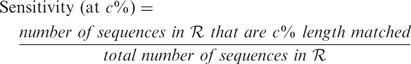
All methods were evaluated with respect to specificity, sensitivity, percentage of chimeric sequences generated (chimera rate) and percentage of reads incorporated in assembly (read assembly rate). We define the various terms here. Let  denote the set of amino acid sequences output by a method, and let
  denote the set of reference protein sequences. A sequence in
  is defined to be ‘c% length matched’ to a sequence in the reference set
  if the two sequences have an alignment with
  90% sequence identity and the alignment covers
  % of the length of the reference sequence. We use this concept to define specificity and sensitivity in the context of varying alignment length coverage of reference sequence. Thus,
 |
 |
A sequence in  is defined to be a chimera if distinct regions on this sequence have
  90% identity alignments to two different sequences in
  . Chimera rate is the percentage of sequences in
  that are labelled as chimeras.
For specificity and sensitivity calculations of each method, we excluded a sequence in  if it did not have a c% length match to a sequence in the reference protein set
  but did have a high-quality TBLASTN match (
 90% identity match over
  90% of its length) to one of the reference genomes used to construct the data set. We took this approach, as it was not always possible to distinguish between overcalling on the gene finder’s part and true genes that were missed by genome annotation.
We used these evaluation criteria to assess the performance of the methods on the data sets DS1, DS2, DS3, DS4, DS5 and DS6 that are of varying complexity.
The evaluation of SPA on DS1 was intended to test its ability to reconstruct protein sequences in a simplistic scenario, namely, when only a single prokaryotic genome is present and all of its constituent peptide fragments are available. The average specificity (at 90%), sensitivity (at 90%), chimera rate and read assembly rate of SPA on DS1 (1165 genomes) were 98.00%, 98.23%, 0.07% and 99.86%, respectively; for the length match definition in this evaluation, we required a sequence identity of  98% (instead of only
  90%), as we were considering each of the genomes separately. SPA’s performance shows that, for this scenario, it can recover nearly the full lengths of all the proteins from their constituent peptide fragments. Furthermore, in the reconstruction process, SPA incorporates nearly all of the constituent input peptide fragments while producing few false positives and a negligible number of chimeras.
DS2 was intended to evaluate the performance of SPA on a collection of closely related genomes in a scenario where all of the constituent peptide fragments from these genomes are available, and the genomes are in equal abundance. The specificity (at 90%), sensitivity (at 90%), chimera rate and read assembly rate on DS2 were 89.23%, 93.4%, 0.26% and 99.24%, respectively. Although its performance drops slightly compared with the simpler single genomes scenario; nevertheless, SPA is able to reconstruct nearly complete sequences of the proteins in these genomes with a very low chimera rate.
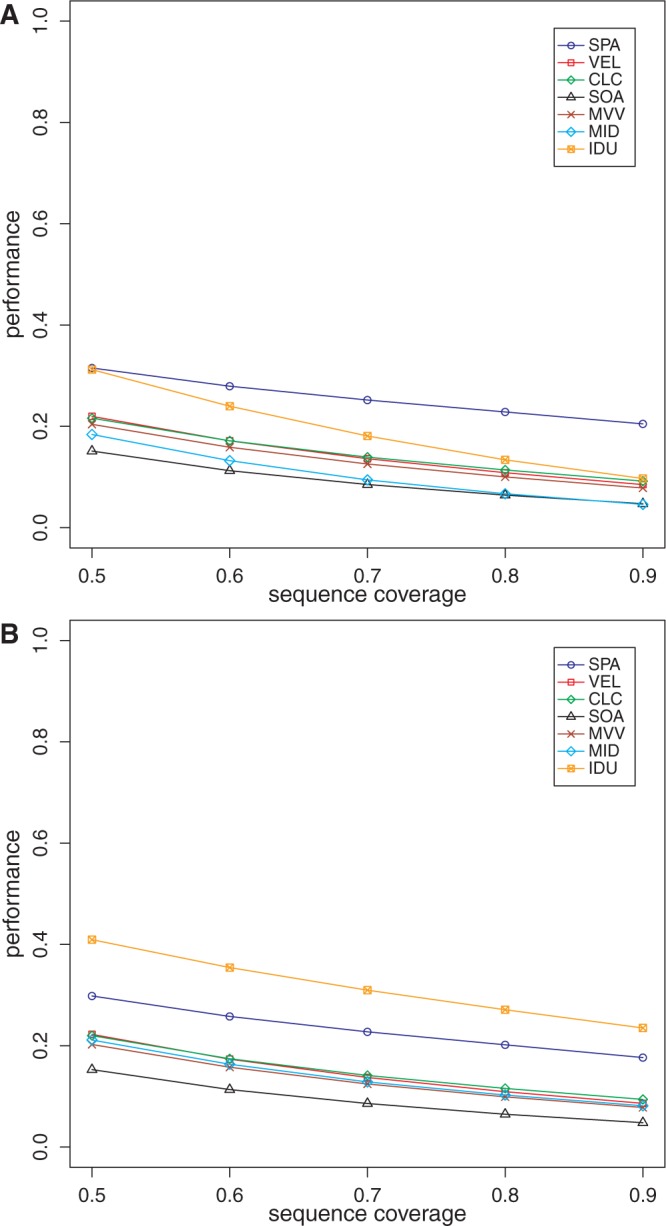
Data sets DS3 and DS4 were intended to model naturally occurring microbial communities (from human oral and surface marine environments) where groups of closely related organisms along with their strain variants are present at varying abundance levels (6,27,31,32), and the community has been sequenced to a reasonable depth. Specificity (at c%) and sensitivity (at c%) of all the methods (for c varying from 50 to 90) are shown in Figures 1 and 2. The chimera and read assembly rates are given in Table 1. From the table and figures, it can be seen that our peptide assembly framework offers an extremely promising approach for analysing proteins in metagenomic data sets. Our method has higher specificity and sensitivity compared with the alternate strategy of assembling nucleotide reads followed by the identification of genes. Our method also has the highest read assembly rate among all the methods evaluated. These observations hold even in the presence of sequencing errors (Figure 1B and D, Figure 2B and D, Supplementary Data SC, Supplementary Figures S1–S3 and Supplementary Table S2). The chimera rates for all the methods evaluated here are generally low. All of the methods generally had higher sensitivity compared with their specificity. Among the nucleotide read assembly based methods, there was no consistent ranking on the DS3 and DS4 data sets, but Velvet, MetaVelvet and IDBA-UD perform comparatively better in the absence of sequencing errors; at 1% sequencing error, however, IDBA-UD tends to perform better than the other nucleotide read assembly based methods. The performance of the nucleotide-based approaches on DS3 and DS4 shows that these methods are confounded by strain variations that result in predictions of fragmentary protein sequences. On the other hand, our assembly framework, which operates in amino acid space, is less impacted by these polymorphisms. We note that the choice of gene finders affects the specificity and sensitivity of all the methods. Our peptide assembly framework tends to perform slightly better when using FGS as the gene finder as compared with using MGA. We speculate that FGS’s ability to handle indels in the coding sequence may be one reason for the improved performance. As our method uses the gene finder in the GF stage, the overall performance can be impacted if genes are missed in this first stage. Specificity and sensitivity values for our method shown in Figures 1 and 2 were computed after excluding this effect of the gene finder. When it is taken into account, however, the specificity and sensitivity of our method decrease slightly; nevertheless, they are still higher compared with those of the other methods (Supplementary Data SE and Supplementary Figures S4 and S5).
Figure 1.

Specificity (SP) and sensitivity (SN) of the various methods on the oral microbiome data (DS3) as a function of reference protein sequence length coverage. Panels (A) and (B) show the performance when using FGS as gene finder on DS3 (0%) and DS3 (1%), respectively. Panels (C) and (D) show the performance when using MGA as gene finder on DS3 (0%) and DS3 (1%), respectively. VEL, Velvet; SOA, SOAPdenovo; MVV, MetaVelvet; MID, Meta-IDBA; IDU, IDBA-UD.
Figure 2.

Specificity (SP) and sensitivity (SN) of the various methods on the marine metagenome data (DS4) as a function of reference protein sequence length coverage. Panels (A) and (B) show the performance when using FGS as gene finder on DS4 (0%) and DS4 (1%), respectively. Panels (C) and (D) show the performance when using MGA as gene finder on DS4 (0%) and DS4 (1%), respectively. VEL, Velvet; SOA, SOAPdenovo; MVV, MetaVelvet; MID, Meta-IDBA; IDU, IDBA-UD.
Table 1.
Read assembly rate (Read) and chimera rate (Chim) for each of the methods on the oral [DS3 (0%) and DS3 (1%)], marine [DS4 (0%) and DS4 (1%)], saliva (DS5) and stool (DS6) metagenomes
| DS3 (0%) |
DS4 (0%) |
DS3 (1%) |
DS4 (1%) |
DS5 |
DS6 |
|||||||
|---|---|---|---|---|---|---|---|---|---|---|---|---|
| Read | Chim | Read | Chim | Read | Chim | Read | Chim | Read | Chim | Read | Chim | |
| SPA | ||||||||||||
| FGS | 93.00 | 0.13 | 92.30 | 0.06 | 85.02 | 0.15 | 82.73 | 0.10 | 60.60 | 0.03 | 81.93 | 0.07 |
| MGA | 92.07 | 0.15 | 90.92 | 0.05 | 83.32 | 0.16 | 80.74 | 0.10 | 61.98 | 0.03 | 81.70 | 0.07 |
| VEL | ||||||||||||
| FGS | 68.79 | 0.03 | 73.15 | 0.02 | 0.43 | 0.04 | 3.68 | 0 | 59.28 | 0.02 | 82.89 | 0.02 |
| MGA | 0.12 | 0.03 | 0.04 | 0.02 | 0.03 | |||||||
| CLC | ||||||||||||
| FGS | 21.64 | 0.02 | 33.36 | 0.03 | 7.11 | 0.04 | 14.47 | 0.04 | 64.87 | 0.05 | 88.29 | 0.03 |
| MGA | 0.04 | 0.03 | 0.03 | 0.03 | 0.04 | 0.03 | ||||||
| SOA | ||||||||||||
| FGS | 88.79 | 0.31 | 92.27 | 0.23 | 67.31 | 0.00 | 73.99 | 0 | 88.73 | 0.03 | 92.47 | 0.03 |
| MGA | 1.87 | 2.41 | 0.91 | 1.88 | 0.03 | 0.05 | ||||||
| MVV | ||||||||||||
| FGS | 95.64 | 0.02 | 91.87 | 0.02 | 13.39 | 0.03 | 25.29 | 0 | 84.06 | 0.02 | 93.05 | 0.02 |
| MGA | 3.21 | 1.18 | 0.03 | 0 | 0.03 | 0.03 | ||||||
| MID | ||||||||||||
| FGS | 11.62 | 0.01 | 17.16 | 0.02 | 5.48 | 0.02 | 8.76 | 0.02 | 54.91 | 0.04 | 79.89 | 0.07 |
| MGA | 0.01 | 0.02 | 0.01 | 0.02 | 0.03 | 0.03 | ||||||
| IDU | ||||||||||||
| FGS | 36.46 | 0.16 | 49.91 | 0.15 | 44.06 | 0.31 | 56.47 | 0.19 | 69.41 | 0.15 | 88.10 | 0.14 |
| MGA | 0.37 | 0.33 | 0.17 | 0.28 | 0.14 | 0.11 | ||||||
For Meta-IDBA, we computed the assembled read rate by mapping the reads back to the contigs using CLC mapper. VEL: Velvet, SOA: SOAPdenovo, MVV: MetaVelvet, MID: Meta-IDBA, and IDU: IDBA-UD.
We also evaluated the performance of all the methods on data sets DS5 and DS6. As these data sets were generated from real metagenomic samples, the ground truth (that is, the reference protein set) is not known. Thus, we could only evaluate specificity, chimera rate and read assembly rate. For computing specificity and chimera rate, we compared the amino acid sequences generated by each method with NCBI’s nraa database (33). The specificity plots for these data sets using the various methods are shown in Figures 3 and 4, and the chimera and read assembly rates are in Table 1. The specificity values on these data sets are not as high as those for DS3 and DS4. We suspect that this may be due to lower sequence coverage (that is, sequencing depth) of the organisms in these samples. When using FGS, our assembly framework tends to perform the best among all the methods. With MGA, on these data sets, IDBA-UD has the best performance with our approach not far behind. The chimera rates for all the methods are, again, low.
Figure 3.
Specificity of the various methods on the saliva metagenome as a function of reference protein sequence length coverage. (A) Performance when using FGS as gene finder; (B) performance when using MGA as gene finder. VEL, Velvet; SOA, SOAPdenovo; MVV, MetaVelvet; MID, Meta-IDBA; IDU: IDBA-UD.
Figure 4.
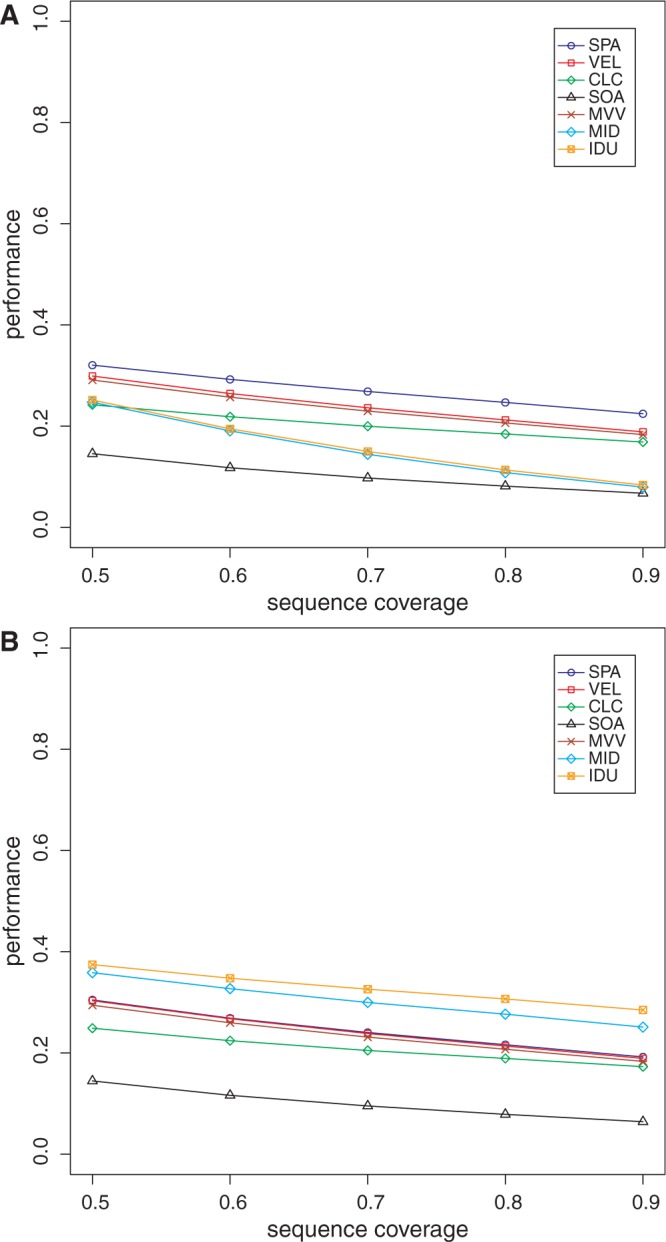
Specificity of the various methods on the stool metagenome as a function of reference protein sequence length coverage. (A) Performance when using FGS as gene finder; (B) performance when using MGA as gene finder. VEL, Velvet; SOA, SOAPdenovo; MVV, MetaVelvet; MID, Meta-IDBA; IDU, IDBA-UD.
Our method took 95 h (using FGS) and 101 h (using MGA) to process the stool sample (86 million reads) (Supplementary Table S3). As part of our future work, we will improve the computational efficiency of our implementation, including the use of distributed approaches that will allow for scaling with the data volume. We will also explore the use of combining gene finders to improve specificity and sensitivity.
In conclusion, our framework offers a promising approach for analysing proteins in large metagenomic data sets. It is also an effective approach for compressing large metagenomic data sets. The protein sequence assemblies generated by the framework can be easily incorporated into downstream functional analysis of metagenomic data. The constituent peptide fragment counts for an assembled protein can be used to compute that protein family’s abundance in the data set using statistics developed for read-based analysis (34). Also, the assembled proteins, being longer, can be annotated with greater accuracy. Furthermore, the assembled proteins themselves can be organized into protein families using various clustering approaches, thus allowing for studies of their function and evolution. Although a framework based on assembling peptides does not necessarily achieve taxonomic binning of sequences (as, as noted earlier, amino acid conservation extends over a larger taxonomic range compared with nucleotide conservation), the resulting peptide assemblies could nevertheless be used as a starting point for studying protein family evolution. For instance, the underlying nucleotide read sequences for an assembled protein sequence could themselves be assembled separately at a high stringency to identify gene sequences from individual strains or species (akin to haplotype phasing), and these gene sequences could then be used in phylogenetic analysis. Finally, although not evaluated here, our framework could, in principle, be used in the analysis of metatranscriptomic data generated from microbial communities (after the removal of non-coding RNA sequences) to assemble protein-coding genes.
SUPPLEMENTARY DATA
Supplementary Data are available at NAR Online: Supplementary Data A–E, Supplementary Tables 1–3 and Supplementary Figures 1–5.
FUNDING
National Institutes of Health (NIH) [AI084844, CA140233]; Beyster Family Foundation Fund of the San Diego Foundation; Life Technologies Foundation; Baltic Sea 2020 Foundation; Olle Enkvist Byggmästare Foundation. Funding for open access charge: NIH [CA140233]; Baltic Sea 2020 Foundation.
Conflict of interest statement. None declared.
Supplementary Material
REFERENCES
- 1.Handelsman J. Metagenomics: application of genomics to uncultured microorganisms. Microbiol. Mol. Biol. Rev. 2004;68:669–685. doi: 10.1128/MMBR.68.4.669-685.2004. [DOI] [PMC free article] [PubMed] [Google Scholar]
- 2.Williamson SJ, Yooseph S. From bacterial to microbial ecosystems (metagenomics) Methods Mol. Biol. 2012;804:35–55. doi: 10.1007/978-1-61779-361-5_3. [DOI] [PubMed] [Google Scholar]
- 3.Margulies M, Egholm M, Altman WE, Attiya S, Bader JS, Bemben LA, Berka J, Braverman MS, Chen YJ, Chen Z, et al. Genome sequencing in microfabricated high-density picolitre reactors. Nature. 2005;437:376–380. doi: 10.1038/nature03959. [DOI] [PMC free article] [PubMed] [Google Scholar]
- 4.Bentley DR. Whole-genome re-sequencing. Curr. Opin. Genet. Dev. 2006;16:545–552. doi: 10.1016/j.gde.2006.10.009. [DOI] [PubMed] [Google Scholar]
- 5.Valouev A, Ichikawa J, Tonthat T, Stuart J, Ranade S, Peckham H, Zeng K, Malek JA, Costa G, McKernan K, et al. A high-resolution, nucleosome position map of C. elegans reveals a lack of universal sequence-dictated positioning. Genome Res. 2008;18:1051–1063. doi: 10.1101/gr.076463.108. [DOI] [PMC free article] [PubMed] [Google Scholar]
- 6.Rusch DB, Halpern AL, Sutton G, Heidelberg KB, Williamson S, Yooseph S, Wu D, Eisen JA, Hoffman JM, Remington K, et al. The sorcerer II global ocean sampling expedition: Northwest Atlantic through Eastern Tropical Pacific. PLoS Biol. 2007;5 doi: 10.1371/journal.pbio.0050077. e77. [DOI] [PMC free article] [PubMed] [Google Scholar]
- 7.Qin J, Li R, Raes J, Arumugam M, Burgdorf KS, Manichanh C, Nielsen T, Pons N, Levenez F, Yamada T, et al. A human gut microbial gene catalogue established by metagenomic sequencing. Nature. 2010;464:59–65. doi: 10.1038/nature08821. [DOI] [PMC free article] [PubMed] [Google Scholar]
- 8.Laserson J, Jojic V, Koller D. Genovo: de novo assembly for metagenomes. J. Comput. Biol. 2011;18:429–443. doi: 10.1089/cmb.2010.0244. [DOI] [PubMed] [Google Scholar]
- 9.Peng Y, Leung HC, Yiu SM, Chin FY. Meta-IDBA: a de novo assembler for metagenomic data. Bioinformatics. 2011;27:i94–i101. doi: 10.1093/bioinformatics/btr216. [DOI] [PMC free article] [PubMed] [Google Scholar]
- 10.Namiki T, Hachiya T, Tanaka H, Sakakibara Y. In: Proceedings of the 2nd ACM Conference on Bioinformatics, Computational Biology and Biomedicine. ACM, Chicago, Illinois: 2011. MetaVelvet: an extension of Velvet assembler to de novo metagenome assembly from short sequence reads; pp. 116–124. [Google Scholar]
- 11.Peng Y, Leung HC, Yiu SM, Chin FY. IDBA-UD: a de novo assembler for single-cell and metagenomic sequencing data with highly uneven depth. Bioinformatics. 2012;28:1420–1428. doi: 10.1093/bioinformatics/bts174. [DOI] [PubMed] [Google Scholar]
- 12.Binnewies TT, Motro Y, Hallin PF, Lund O, Dunn D, La T, Hampson DJ, Bellgard M, Wassenaar TM, Ussery DW. Ten years of bacterial genome sequencing: comparative-genomics-based discoveries. Funct. Integr. Genomics. 2006;6:165–185. doi: 10.1007/s10142-006-0027-2. [DOI] [PubMed] [Google Scholar]
- 13.Henikoff S, Henikoff JG. Amino acid substitution matrices from protein blocks. Proc. Natl Acad. Sci. USA. 1992;89:10915–10919. doi: 10.1073/pnas.89.22.10915. [DOI] [PMC free article] [PubMed] [Google Scholar]
- 14.Dayhoff MO, Schwartz RM, Orcutt BC, editors. A Model of Evolutionary Change in Proteins. 3rd edn. Washington DC: National Biomedical Research Foundation; 1978. [Google Scholar]
- 15.Noguchi H, Taniguchi T, Itoh T. MetaGeneAnnotator: detecting species-specific patterns of ribosomal binding site for precise gene prediction in anonymous prokaryotic and phage genomes. DNA Res. 2008;15:387–396. doi: 10.1093/dnares/dsn027. [DOI] [PMC free article] [PubMed] [Google Scholar]
- 16.Rho M, Tang H, Ye Y. FragGeneScan: predicting genes in short and error-prone reads. Nucleic Acids Res. 2010;38:e191. doi: 10.1093/nar/gkq747. [DOI] [PMC free article] [PubMed] [Google Scholar]
- 17.Hoff KJ, Lingner T, Meinicke P, Tech M. Orphelia: predicting genes in metagenomic sequencing reads. Nucleic Acids Res. 2009;37:W101–W105. doi: 10.1093/nar/gkp327. [DOI] [PMC free article] [PubMed] [Google Scholar]
- 18.Ye Y, Tang H. An ORFome assembly approach to metagenomics sequences analysis. J. Bioinform. Comput. Biol. 2009;7:455–471. doi: 10.1142/s0219720009004151. [DOI] [PMC free article] [PubMed] [Google Scholar]
- 19.Pevzner PA, Tang H, Waterman MS. An Eulerian path approach to DNA fragment assembly. Proc. Natl. Acad. Sci. USA. 2001;98:9748–9753. doi: 10.1073/pnas.171285098. [DOI] [PMC free article] [PubMed] [Google Scholar]
- 20.Idury RM, Waterman MS. A new algorithm for DNA sequence assembly. J. Comput. Biol. 1995;2:291–306. doi: 10.1089/cmb.1995.2.291. [DOI] [PubMed] [Google Scholar]
- 21.Compeau PE, Pevzner PA, Tesler G. How to apply de Bruijn graphs to genome assembly. Nat. Biotechnol. 2011;29:987–991. doi: 10.1038/nbt.2023. [DOI] [PMC free article] [PubMed] [Google Scholar]
- 22.Li W, Jaroszewski L, Godzik A. Clustering of highly homologous sequences to reduce the size of large protein databases. Bioinformatics. 2001;17:282–283. doi: 10.1093/bioinformatics/17.3.282. [DOI] [PubMed] [Google Scholar]
- 23.Li W, Godzik A. Cd-hit: a fast program for clustering and comparing large sets of protein or nucleotide sequences. Bioinformatics. 2006;22:1658–1659. doi: 10.1093/bioinformatics/btl158. [DOI] [PubMed] [Google Scholar]
- 24.Richter DC, Ott F, Auch AF, Schmid R, Huson DH. MetaSim: a sequencing simulator for genomics and metagenomics. PLoS One. 2008;3:e3373. doi: 10.1371/journal.pone.0003373. [DOI] [PMC free article] [PubMed] [Google Scholar]
- 25.Jukes TH, Cantor CR. Evolution of Protein Molecules. New York: Academic Press; 1969. [Google Scholar]
- 26.Li H, Handsaker B, Wysoker A, Fennell T, Ruan J, Homer N, Marth G, Abecasis G, Durbin R. The sequence alignment/map format and SAMtools. Bioinformatics. 2009;25:2078–2079. doi: 10.1093/bioinformatics/btp352. [DOI] [PMC free article] [PubMed] [Google Scholar]
- 27.Yooseph S, Nealson KH, Rusch DB, McCrow JP, Dupont CL, Kim M, Johnson J, Montgomery R, Ferriera S, Beeson K, et al. Genomic and functional adaptation in surface ocean planktonic prokaryotes. Nature. 2010;468:60–66. doi: 10.1038/nature09530. [DOI] [PubMed] [Google Scholar]
- 28.Peterson J, Garges S, Giovanni M, McInnes P, Wang L, Schloss JA, Bonazzi V, McEwen JE, Wetterstrand KA, Deal C, et al. The NIH human microbiome project. Genome Res. 2009;19:2317–2323. doi: 10.1101/gr.096651.109. [DOI] [PMC free article] [PubMed] [Google Scholar]
- 29.Zerbino DR, Birney E. Velvet: algorithms for de novo short read assembly using de Bruijn graphs. Genome Res. 2008;18:821–829. doi: 10.1101/gr.074492.107. [DOI] [PMC free article] [PubMed] [Google Scholar]
- 30.Li R, Zhu H, Ruan J, Qian W, Fang X, Shi Z, Li Y, Li S, Shan G, Kristiansen K, et al. De novo assembly of human genomes with massively parallel short read sequencing. Genome Res. 2010;20:265–272. doi: 10.1101/gr.097261.109. [DOI] [PMC free article] [PubMed] [Google Scholar]
- 31.Dewhirst FE, Chen T, Izard J, Paster BJ, Tanner AC, Yu WH, Lakshmanan A, Wade WG. The human oral microbiome. J. Bacteriol. 2010;192:5002–5017. doi: 10.1128/JB.00542-10. [DOI] [PMC free article] [PubMed] [Google Scholar]
- 32.Methe BA, Nelson KE, Pop M, Creasy HH, Giglio MG, Huttenhower C, Gevers D, Petrosino JF, Abubucker S, Badger JH, et al. A framework for human microbiome research. Nature. 2012;486:215–221. doi: 10.1038/nature11209. [DOI] [PMC free article] [PubMed] [Google Scholar]
- 33.Wheeler DL, Barrett T, Benson DA, Bryant SH, Canese K, Chetvernin V, Church DM, DiCuccio M, Edgar R, Federhen S, et al. Database resources of the National Center for Biotechnology Information. Nucleic Acids Res. 2007;35:D5–D12. doi: 10.1093/nar/gkl1031. [DOI] [PMC free article] [PubMed] [Google Scholar]
- 34.Sharon I, Pati A, Markowitz VM, Pinter RY. In: Proceedings of the 13th Annual International Conference on Research in Computational Molecular Biology. Tucson, Arizona: Springer; 2009. A Statistical Framework for the Functional Analysis of Metagenomes; pp. 496–511. [Google Scholar]
Associated Data
This section collects any data citations, data availability statements, or supplementary materials included in this article.