


Abstract
Digital transcriptome analysis by next-generation sequencing discovers substantial mRNA variants. Variation in gene expression underlies many biological processes and holds a key to unravelling mechanism of common diseases. However, the current methods for construction of co-expression networks using overall gene expression are originally designed for microarray expression data, and they overlook a large number of variations in gene expressions. To use information on exon, genomic positional level and allele-specific expressions, we develop novel component-based methods, single and bivariate canonical correlation analysis, for construction of co-expression networks with RNA-seq data. To evaluate the performance of our methods for co-expression network inference with RNA-seq data, they are applied to lung squamous cell cancer expression data from TCGA database and our bipolar disorder and schizophrenia RNA-seq study. The preliminary results demonstrate that the co-expression networks constructed by canonical correlation analysis and RNA-seq data provide rich genetic and molecular information to gain insight into biological processes and disease mechanism. Our new methods substantially outperform the current statistical methods for co-expression network construction with microarray expression data or RNA-seq data based on overall gene expression levels.
INTRODUCTION
Despite great progress in genetic studies of complex diseases has been made, information on the function of the identified genetic variation in association studies has still been limited (1). Gene expression variation may significantly contribute to phenotype variation (2). Gene expression analyses are important sources to study function of genetic variation and are increasingly acquiring an important role in unravelling mechanism of complex traits. The rapidly developed next-generation sequencing technologies have been becoming the platform of choice for gene expression profiling. RNA-seq for expression profiling offers comprehensive picture of transcriptome and is superior to microarray platforms. RNA-seq has made a number of significant qualitative and quantitative improvements on gene expression analysis and provides multiple layers of resolutions and transcriptome complexity: the expression at exon, single-nucleotide polymorphism (SNP) and positional level; splicing; post-transcriptional RNA editing across the entire gene; isoform and allele-specific expressions (ASE) (1,3–5).
Variation in complex phenotypes is not caused by a single gene acting as a marker, but by a set of interacted genes that are often organized into various types of biological networks (6). Gene co-expression networks are often used to extract important information about groups of co-regulated genes that play a central role in regulatory processes. Co-expression networks are able to comprehensively capture the relationships of individual components of the transcriptome perturbed by environments (7); hence, they provide a powerful tool to gain new insights into the function of genes, biological processes, the global structure of the transcriptome and mechanism of complex diseases (6,8–11).
Traditional statistical methods for construction of co-expression networks, such as weighted co-expression networks, mutual information relevance networks, covariance selection and sparse graphical model, and partial correlation methods are mainly designed for microarray expression data (12–15). All these methods use a single value of summarizing statistic to represent gene expression level and overlook all information on expression difference in exons, genomic position and alleles. Therefore, although RNA-seq dramatically increases the level of biological details (11), we still use the traditional statistical methods for co-expression network inference, which are designed for microarray expression data and do not efficiently use all of the information contained in RNA-seq data. To fully use the comprehensive information of the transcriptome and capture expression variation at the level of exon, chromosomal position, allele and splicing isoforms which are provided by RNA-seq, development of powerful computational tools for expression data analysis is highly desirable (16).
In this article, we develop computational methods to address challenges arising from co-expression network inference with RNA-seq data. To explore observed expression variation in exons or in genomic position across the genes, we use an ordinary single variate canonical correlation analysis (CCA) that quantifies the correlation between a linear combination of the expressions at exon levels or position levels in one gene and another such combination of expressions in a second gene to construct co-expression networks. Specifically, the expression level at each exon, or expression level at each genomic position, will be considered as variables. The exon expressions or genomic positional-level expressions of two genes form two large sets of variables. We wish to study those linear combinations of variables most highly correlated. The goal of CCA is to seek linear combinations of two sets of variables that maximize the correlation between two sets of variables. To achieve this, we first identify the pair of linear combinations that have the largest correlation. Next, we identify the pair of linear combinations having the largest correlation among all pairs uncorrelated with the initially selected pair, and so on. Therefore, CCA measures the co-expression between two genes that can take genomic position and allele levels of expressions into consideration. To model ASE, we develop bivariate CCA to construct co-expression networks with ASE data, allowing levels of ASE to vary across SNPs and to consider complicated patterns of ASE because of allele-specific splicing and alternative transcription start sites (2). Bivariate CCA consider two sets of vectors of measurements. Two allele-specific expressions at each SNP form a vector for the SNP. Bivariate CCA is to seek a few linear combinations of vectors with two alleles’ expressions that have the largest correlations. Therefore, two variate CCA measure the co-expressions between two genes that can consider expressions of two alleles at each SNP. To evaluate the performance of CCA for co-expression network inference with RNA-seq data, the CCA for co-expression network construction is applied to lung squamous cell cancer (LUSC) expression data from TCGA and a bipolar disorder and schizophrenia RNA-seq study. We find that CCA for co-expression network construction with RNA-seq data substantially outperforms the current statistical methods for co-expression network construction with microarray expression data or overall gene expression data. A program for implementing the developed CCA for co-expression network construction can be downloaded from bioconductor (http://www.bioconductor.org/) and our local website http://www.sph.uth.tmc.edu/hgc/faculty/xiong/index.htm.
MATERIALS AND METHODS
Data access
The TCGA RNA-seq data sets are publicly available from the TCGA website (https://tcga-data.nci.nih.gov/tcga/). Pathways are available from KEGG database (17,18) (http://www.genome.jp/kegg/pathway.html).
CCA method for construction of gene co-expression networks
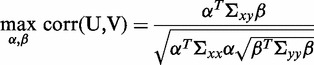
A gene co-expression network is considered as an undirected graph, where a gene is represented as a node and each edge connecting two nodes is regarded as the co-expression relationship of the two connected genes. Construction of co-expression networks is often carried out by detecting the pairwise correlation of gene co-expression. The CCA is to seek maximization of the correlation between two linear combination of the variables in the data sets (19). Suppose that we have  exons or positions in one gene and
  exons or positions in another gene. Let
  denote the expression of the
  -th exon or the number of reads at the
  -th genomic position within the first gene. We can similarly define
  for the second gene. Let
  and
and  . For the convenience of presentation, we assume that
  . Let
. Let
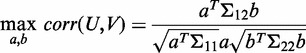
Construction of co-expression networks is implemented by seeking maximization of correlation coefficients between linear combination  for the first gene and linear combination
  :
:
 |
(1) |
Solutions to the optimization problem (1) are the eigenvalues  and their corresponding eigenvectors of the of the Rayleigh quotient matrix:
In RNA-seq data, we observe either multiple exon expressions or sets of number of reads at genomic position levels across two genes. The exon-level or genomic positional-level expressions form two sets of variables or two vectors of variables. Canonical correlation between two genes is to find the pair of linear combinations of the variables determined by  such that their correlation is maximized. The first pair of linear combination is called the first pair of canonical variables. Their largest correlation is called the first canonical correlations. Next, we identify the pair of linear combinations that have the largest correlation among all pairs uncorrelated with the initially selected pair and called the second pair of canonical variables, and so on. The first canonical correlation is equal to the square root of the largest eigenvalue
  of the matrix
  , the second canonical correlation is equal to the square root of the largest eigenvalue
  of the matrix
  , and so on. Let
  be the eigenvector of the matrix R associated with the eigenvalue
  . Then, the vectors of coefficients
  and
and  are given by
Ordinary correlation coefficient can only measure the linear relationship between two variables. When it is applied to quantify co-expression between two genes, exon-level expressions or genomic positional-level expressions need to be aggregated into overall expressions. The exon-level and genomic positional-level expression variation information cannot be preserved in the ordinary correlation. Canonical correlation is extension of ordinary correlation between two variables to canonical correlation between two sets of variables. Therefore, canonical correlation for measuring co-expression between two genes in RNA-seq data can more accurately quantify the linear relationship between two genes than the ordinary correlation.
Let  be the P-value of the test statistic (20)
 with distribution
  , where
  is sample size for testing the null hypothesis
  . We assign a weight to the edge connecting two genes:
 |
(2) |
where  . When the denominator is zero, the weight is zero.
The method for determining the threshold for retaining an edge by the CCA method is hard threshold method (8). We first ranked edges by their weights from the largest to the smallest. We then select edges by pre-determined number of edges or percentage of edges. In this article, we selected 5% of edges with top weights.
The edges with rank larger than threshold are retained in the network.
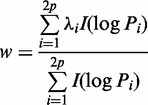
In general, we have multiple canonical variables and canonical correlations. To fully use canonical correlations to characterize the relationships between two sets of variables, we introduce the weight  . The larger the contribution to the edge weight, the larger the eigenvalue or canonical correlation. If the
  -th canonical correlation is not significant (P > 0.05), its contribution to the edge weight will be small. Therefore,
  is given value of 0. The edge weight defined by Equation (2) can fully use canonical correlation information to measure the degrees of co-expression of two genes.
Bivariate CCA for construction of co-expression networks with ASE data
We develop novel bivariate CCA for construction of co-expression networks with ASE data. Let  and
and  be the number of reads of the major and minor allele at the
  -the SNP in the gene, respectively. We can similarly define
  for another gene. Let
  ,
,  and
and  . Define linear combinations
  and
and  , where
  ,
,  and
and  . These linear combinations can be rewritten as
 and
and  ,
,
where  ,
,  ,
, 
 ,
,  ,
,  ,
,  and
and 
 .
.
Define the covariance matrices:
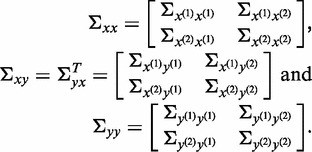 |
The CCA seeks to maximize
 |
(3) |
where  and
and  .
.
The solutions to the optimization problem (3) are the eigenvectors of the matrix with the eigenvalues  :
:
Our formulation considers the correlation between the expressions of two alleles. If we do not take their correlations into account, the two variate CCA will become two single variate CCA.
Again, let  be the P-value of the test statistic (20)
  with distribution
  , where
  is sample size for testing the null hypothesis
  . We assign a weight to the edge connecting two genes:
 |
(4) |
where  . When the denominator is zero, the weight is zero.
Similar to single CCA for construction of co-expression networks, after we rank the weights, we also use rank procedure to prune the networks.
Graphical LASSO
Sparse undirected graphical models can be estimated by the use of  (LASSO: least absolute shrinkage and selection operator) regularization (21). We assume that the overall expressions of genes have a multivariate Gaussian distribution with mean
  and covariance matrix
  . It is shown that if the
  the component of the inverse matrix
  is zero, then variables i and j are conditionally independent, given the other variables. Therefore, co-expression networks can be constructed by estimating the inverse of covariance matrix
  through
  regularization.
RESULTS
Canonical correlation analysis for construction of co-expression networks with exon-level expression data
A gene co-expression network is represented as an undirected graph, where each node denotes a gene or more precisely a gene expression profile, and each edge connecting two nodes indicates significant co-expression relationships of the two genes. To explore exons with varying expression information, we developed a CCA-based method for construction of co-expression networks. The canonical correlations measure the strength of association between the two sets of exon expression. To illustrate the application of CCA for construction of co-expression networks with exon expression data, the CCA was applied to LUSC RNA-seq data set from TCGA database. LUSC consists of 242 samples (225 case samples and 17 control samples). Here, we only use data belonging to the case group. The CCA method was compared with a graphic LASSO (GLASSO) (21) method that used overall gene expression to construct co-expression network (for detail, see ‘Materials and Methods’ section). A simple rank-based cut-off method was used to prune the network (for detail, see ‘Materials and Methods’ section).
We first randomly selected The TCGA RNA-seq level 3 data with 50, 200, 400, 600 and 1000 genes, resulting in five RNA-seq data sets. We then applied GLASSO and CCA to these five sampled RNA-seq data sets to construct co-expression networks that were called the original co-expression networks as the basis to evaluate the performance of CCA and GLASSO for construction of co-expression networks. We used bootstrapping for re-sampling RNA-seq data 1000 times from each of five RNA-seq data sets. The CCA and GLASSO methods were applied to the re-sampled RNA-seq data to construct co-expression networks for testing the accuracy (how many edges in the original networks are reserved in the reconstructed co-expression networks from the re-sampled RNA-seq data sets). The results were shown in Supplementary Figure S1. It was clearly shown that the accuracy of CCA method for construction of co-expression networks was much higher than that by GLASSO under all different network sizes. Then we studied non-small cell lung cancer pathway in KEGG with LUSC data set. After discarding the isolated nodes in the pathway and matching to the TCGA LUSC RNA-seq level 3 data, we included 44 genes in the analysis. The constructed co-expression networks for the non-small cell lung cancer pathway by the CCA and GLASSO (21) method were shown in Figure 1. Edges with red colour were in the co-expression network constructed only by CCA. Edges with blue colour were in the co-expression networks constructed by both CCA and GLASSO. Edges with cyan colour were in the co-expression networks constructed only by GLASSO. It consisted of four pathways: ErbB signalling pathway, MAPK signalling pathway, PI3K pathway and apoptosis pathway. Figure 1 showed that EGF (epidermal growth factor)–EGFR–PI3K/Akt–apoptosis signal pathway and MAPK (Raf–MEK–ERK) signal pathway were in the co-expression network constructed by the CCA method. However, EGF–EGFR–PI3K pathway and MAPK pathway connections were not in the co-expression network constructed by GLASSO. Recent studies uncovered (22) that the EGF stimulates the production of interleukin (IL)-8 from lung cancer cells, which in turn activates EGFR and signalling pathway of PI3K/Akt. PI3K/Akt pathway activation plays a crucial role in lung cancer development and proliferation. Raf–MEK–ERK was involved in gene transcription, regulation of cell survival and angiogenesis and was associated with lung metastasis (23).
Figure 1.

The shared network structure by non-small lung cancer pathway in KEGG and reconstructed co-expression networks using the CCA and GLASSO methods.
Network topology plays an important role in the function and information processing of biological networks (24). Assortativity and centralization are two important topology measures of networks. Assortativity is a preference for a network’s nodes to attach to other similar nodes. Assortativity is measured by the assortativity coefficient that is defined as the Pearson correlation coefficient of degree between pairs of linked nodes (25). If the assortativity coefficient was positive, the network was said to be assortative. On the other hand, if the assortativity coefficient was negative, the network was recognized as disassortative. We observe that in social networks, highly connected nodes tend to be connected with other high degree nodes. The assortativity coefficient in social networks is, hence, positive (25). However, technological and biological networks typically show that high-degree nodes tend to attach to low-degree nodes. Their assortativity coefficient is negative. For random networks, the assortativity coefficient tended to be nearly zero (Wikipedia, the free encyclopedia). The centrality of a vertex within a graph that determines the relative importance of a vertex within the graph is an important concept in network theory. Centralization is based on the concept of centrality. It is defined as measuring the sum in differences in centrality between the most central node in a network and all other nodes. It attempts to quantify the level of a network about how centralized it was around particular nodes (26). Table 1 showed that assortativity and centralization of co-expression networks constructed by the CCA, GLASSO, random selection and true non-small cell lung cancer pathway in KEGG, where standard deviation was calculated by 1000 re-sampling. We observed that topology of the co-expression network constructed by GLASSO (overall gene expression) was close to the random network; however, topology of the co-expression network constructed was close to the structure of true non-small cell lung cancer pathway in KEGG. Table 1 indicated that the co-expression networks constructed by RNA-seq exon expressions were highly centralized and disassortative, which were inherent topology features in the biological networks. This further demonstrated that the co-expression network constructed by RNA-seq exon expressions was more biologically meaningful than that by overall gene expressions.
Table 1.
Topology property of co-expression networks generated by CCA, GLASSO, random and KEGG
| Method | Assortativity | Centralization |
|---|---|---|
| Mean (SD) | Mean (SD) | |
| CCA | −0.3937 (0.0407) | 0.7606 (0.0078) |
| GLASSO | −0.0482 (0.0868) | 0.6297 (0.0458) |
| Random | −0.0489 (0.0064) | 0.5666 (0.0033) |
| KEGG | −0.2305 | 0.7257 |
To further evaluate the performance of the CCA for construction of co-expression networks, we applied both CCA and GLASSO methods to another TCGA RNA-seq data set (uterine corpus endometrioid carcinoma) where 416 case samples of UCEC were used in the study. The reconstructed pathway for the endometrial cancer by the CCA and GLASSO method were shown in Supplementary Figure S2. From this figure, it was shown that only the CCA method detected the MAPK (Raf–MEK–ERK) signal pathway in the co-expression network. We also present the network topology comparison of two reconstructed network as well as random network and true endometrioid carcinoma pathway in the Supplementary Table S1. This table showed that the co-expressed network reconstructed by the CCA method was closer to the pathway in KEGG, but the topology of co-expression network inferred by the overall expressions and GLASSO was more similar to the random one.
CCA for co-expression network construction with position-level RNA-seq data
The current methods for co-expression network construction with RNA-seq data are to collapse the position-level read data into a single overall gene expression measurement. Collapsing the position-level read counts may lose detailed position-level information of gene expressions. To fully use information contained in RNA-seq data, we developed CCA for co-expression network construction that directly modelled the position-level read counts. We maximized the correlation between a linear combination of the number of read counts at each position within one gene and a linear combination of the number of read counts at each position within another gene.
To illustrate its application, the CCA for construction of co-expression network with position-level RNA-seq data was applied to bipolar and schizophrenia RNA-seq study that sequenced mRNA in 31schizophrenia, 25 bipolar and 26 normal samples. The RNA samples were from post-mortem brain tissues; the brain region is anterior cingulate cortex, also called Brodmann’s area 24. The RNA-seq data were produced on IlluminaHiSeq platform. Data pre-processing and normalization were followed the Beijing Genomics Institute (BGI’s) protocol (http://www.genomics.cn/index). A total of 65 genes in Wnt signal pathway were included in the analysis. If the number of reads at the position was <5 in 80% of samples, this position was removed from analysis. The co-expression networks constructed by the CCA and GLASSO with the position-level RNA-seq data and gene-level aggregate data from schizophrenia, bipolar and normal tissues were shown in Figures 2–4 and Supplementary Figures S3–S5, respectively.
Figure 2.

The co-expression network reconstructed by CCA method using position-level RNA-seq data in Wnt pathway of schizophrenia tissue samples. Nodes are sized, numbered and coloured by their degree value.
Figure 3.

The co-expression network reconstructed by CCA method using position-level RNA-seq data in Wnt pathway of bipolar tissue samples. Nodes are sized, numbered and coloured by their degree value.
Figure 4.

The co-expression network reconstructed by CCA method using position-level RNA-seq data in Wnt pathway of normal tissue samples. Nodes are sized, numbered and coloured by their degree value.
To unravel the merits and limitations of the CCA with the position-level RNA-seq data and GLASSO with the gene-level aggregate data for construction of gene co-expression networks, we will mainly investigate biological significance of the hub genes in the networks and the other network properties. Table 2 summarized the topology properties of constructed networks. We observed that only the co-expression network constructed by the CCA showed the disassortative property of the biological network. The networks inferred by GLASSO showed either a nearly zero assortativity coefficient, which usually appeared in random networks, or a positive assortativity coefficient, which was often observed in the social networks.
Table 2.
Topology property of co-expression networks generated by CCA and GLASSO with position-level and gene-level data
| Methods | Tissues | Assortativity | Centralization |
|---|---|---|---|
| CCA | Bipolar | −0.6444 | 0.8420 |
| Schizophrenia | −0.7215 | 0.8249 | |
| Normal | −0.6316 | 0.8163 | |
| GLASSO | Bipolar | 0.0567 | 0.7408 |
| Schizophrenia | 0.0324 | 0.7325 | |
| Normal | 0.2061 | 0.6574 | |
| Random | −0.0359 | 0.7000 |
We also observed that the co-expression networks constructed by position-level RNA-seq data were much more centralized than those inferred by the gene-level aggregate data. Although no hub genes in the networks constructed by the gene-level aggregate data were found, we identified six hub genes: PLCB1, APC, CAMK2A, CAMK2B, PPP3R1 and MAPK10, which were highly connected and had degree >10 in the co-expression networks constructed by the position-level RNA-seq data, no matter they were from disease tissue samples or from normal tissue samples. The average gene-level expressions in schizophrenia, bipolar and normal tissue samples and the P-values for testing the differential expression between schizophrenia and normal samples or between bipolar and normal samples were listed in Table 3. Five genes—PLCB1, APC, PPP3R1, CAMK2A and MAPK10—were differentially expressed between disease tissues (schizophrenia and bipolar) and normal tissues. More specifically, they were downregulated in both bipolar and schizophrenia samples. However, we observed that CAMK2B was downregulated in schizophrenia and upregulated in bipolar disorder samples.
Table 3.
Expression pattern of the hub genes in the co-expression networks for three types of tissues
| Gene | Number of SNPs | Average expressions |
P-values |
|||
|---|---|---|---|---|---|---|
| Bipolar | Schizophrenia | Normal | Bipolar | Schizophrenia | ||
| PLCB1 | 17 | 28.65 | 32.94 | 36.66 | 1.83E-05 | 2.38E-02 |
| APC | 19 | 27.31 | 27.45 | 31.4 | 9.92E-03 | 1.44E-03 |
| PPP3R1 | 12 | 179.04 | 180.25 | 209.42 | 4.90E-03 | 4.31E-03 |
| CAMK2B | 13 | 157.34 | 148.28 | 151.84 | 3.11E-01 | 5.18E-01 |
| CAMK2A | 23 | 288.49 | 276.61 | 321.92 | 6.54E-03 | 1.80E-04 |
| MAPK10 | 24 | 87.81 | 84.79 | 98.79 | 2.00E-02 | 2.38E-03 |
These hub genes were essential for the maintenance of gene regulations and were of functional importance. It was reported that PLCB1 played key roles in two processes: long-term depression and long-term potentiation, which were both involved in learning and memory of neuron cells and associated with both schizophrenia and bipolar diseases (27). PLCB1 functions via co-regulation with gene PLCB4, which was closely located in the downstream region of PLCB1. It was interesting to observe that co-expressed PLCB1 and PLCB4 were also co-expressed with other hub genes (APC, CAMK2A and CAMK2B) in the normal tissues (Figure 4). However, in the bipolar co-expression network (Figure 3), although the co-expressed pattern of PLCB1 and PLCB4 was still remained, PLCB4 was no longer co-expressed with other genes. In the schizophrenia co-expression network (Figure 2), PLCB1 and PLCB4 were not co-expressed. It seems that PLCB4 lost regulatory function in schizophrenia and bipolar.
Both CAMK2A and CAMK2B were crucial for central nervous system and may function at the plasticity of glutamatergic synapses (28). CAMK2A was responsible for spatial learning, neurotransmitter release and hippocampal long-term potentiation. They were ubiquitously expressed in the brain and phosphorylated a subunit of the NMDA receptor involved in schizophrenia (29). Another study reported a decrease in the expression of CAMK2A in bipolar disorder patients (30). CAMK2B is involved in the reorganization of actin cytoskeleton during the plasticity of synapse with the help of CAMK2A. MAPK10, also known as JNK3, is involved in neuronal proliferation and many other cell processes. This gene was expressed selectively in neurons (31). Several studies had reported the relationship of MAPK10 and schizophrenia (32–35). APC, known as an antagonist of the Wnt signalling pathway, was a tumour suppressor gene. It was involved in a number of key cell processes, such as transcriptional activation, cell migration, adhesion and apoptosis, and it regulates the expression of many genes (36). PPP3R1 was a regulatory subunit of calcineurin, a calmodulin-stimulated phosphatase, which was linked to receptors for several important brain chemicals, such as dopamine, GABA and NMDA (37). An animal study (38) had validated that lack of calcineurin could cause several symptoms similar to those in schizophrenia.
The Glutamatergic synapse pathway is also essential in neurology process. To demonstrate that the CCA method for construction of co-expression works using genomic positional-level RNA-seq data can reveal more biologically important information on the mechanism of schizophrenia and bipolar, we applied the CCA and GLASSO methods to the glutamatergic synapse pathway that consists of 63 genes. The reconstructed networks were shown in Supplementary Figures S6–S11. The co-expression networks reconstructed by the CCA method using position-level RNA-seq data have clear hub structure, in which degrees of hub genes were >10. However, no hub genes can be found in networks reconstructed by overall expression data and GLASSO method. Topology comparison of the co-expression networks constructed by the CCA and GLACCO methods was shown in the Supplementary Table S2.
The hub genes play an important role in schizophrenia and bipolar. Hub genes SLC1A2 (39) and PLCB1 (27) had been reported to be highly related with both schizophrenia and bipolar disorder. GRM5 was reported to be associated with schizophrenia (40) and other neurological disease (41). Researchers also observed that a point mutation in the GNAO1 gene can show significantly decreased affinity for RGS4 (42) whose variations are possibly associated with schizophrenia, which are discovered by many studies (43–45). DLGAP1 was also an important gene that had been reported to be associated with schizophrenia (46,47). Furthermore, the interactions between DLGAP1 and DLG4, SHANK1 and SHANK3 observed in the co-expression networks constructed by the genomic position-level expressions, and CCA method can be confirmed from UniProtKB database (48).
Bivariate CCA for co-expression network construction with ASE RNA-seq data
To fully use the information of the captured exons, genomic position, allele- and isoform-specific expression provided by RNA-seq, we developed a novel bivariate CCA method for construction of co-expression networks with ASE RNA-seq data. The bivariate CCA method allows levels of ASE to vary across SNPs within genes. The complicated patterns of ASE may come from allele-specific splicing, alternative polyadenylation site usage and alternative transcription start sites (2). The traditional single variate CCA analyses the correlation between two sets of variables in which each variable has only one dimension. Therefore, the single variate CCA cannot distinguish difference in expressions between two alleles. Taking difference in expressions between two alleles into account, we extended single variate CCA to bivariate CCA, in which each vector with two components represents expressions of two alleles at an SNP. To evaluate performance of bivariate CCA for co-expression network construction with ASE data, we again used the GLASSO with the gene-level aggregate data to construct co-expression networks. The bivariate CCA for construction of co-expression network with ASE data was applied to schizophrenia and bipolar RNA-seq data set described before. We included 65 genes in the Wnt signal pathway in the analysis. The co-expression networks for schizophrenia, bipolar and normal tissue samples constructed by bivariate CCA (ASE) and the GLASSO are shown in Figures 5–7 and Supplementary Figures S3–S5, respectively.
Figure 5.

The co-expression network reconstructed by bivariate CCA method using ASE RNA-seq data of schizophrenia tissue samples. Nodes are sized, numbered and coloured according to their degree value. The important SNPs in genes are represented by their names, expression value and their CCA coefficients in the figure and described elaborately in the article.
Figure 6.

The co-expression network reconstructed by bivariate CCA method using ASE RNA-seq data of bipolar. Nodes are sized, numbered and coloured according to their degree value. The important SNPs in genes are represented by their names, expression value and their CCA coefficients in the figure and described elaborately in the article.
Figure 7.

The network reconstructed by bivariate CCA method using ASE RNA-seq data of normal tissue samples. Nodes are sized, numbered and coloured according to their degree value. The important SNPs in genes are represented by their names, expression value and their CCA coefficients in the figure and described elaborately in the article.
To unravel the merits and limitations of using ASE and gene-level expressions for construction of co-expression networks, we investigated the biological significance of the hub genes in the networks. Compared with the position-level networks, more hub genes, which had been previously reported to be involved with schizophrenia, bipolar disorder and other neurological diseases, were detected in the networks by the bivariate CCA method and ASE data. Five genes (CAMK2B, PPP3R1, PSEN1, TBL1XR1 and CSNK2A1) in the schizophrenia network and five genes (CAMK2B, NFAT5, TBL1XR1, GSK3B and RAC1) in the bipolar networks constructed by ASE were detected to be hub genes in the networks. The function of CAMK2B and PPP3R1 and their association with the two disorders had been described in the previous section. PSEN1 is a core protein that regulates the process of γ-secretase (49) and is also a well-known cause of Alzheimer’s disease (50). This gene was also suspected to be involved in schizophrenia (51). TBL1XR1 contained an F-box-like domain and might act as function in transcription activation (52). A recent Genome-wide association study (GWAS) study reported an association of this gene with bipolar disorder (53). CSNK2A1 is a serine/threonine protein kinase and might be related to Alzheimer’s disease (54). GSK3B is a proline-directed serine–threonine kinase and involved in neuronal cell development (55). This gene had been reported to play important roles in many neurology diseases, such as Parkinson’s disease (56), bipolar disorder (57) and schizophrenia (58). NFAT5 belongs to the protein family of the nuclear factors of activated T cells (NFAT) and plays a key role in inducible gene transcription during the process of immune response. It was reported to have alternative splicing in a neurodegenerative disorder (59). This gene mainly plays key roles in cancer (60). Although there were no direct evidence of its relationship with bipolar disorder and schizophrenia, this gene’s exchange factor, ARHGEF6, is a mental retardation protein, which plays important roles in the plasticity of synaptic networks (61).
We observed a number of SNPs at which either major allele or minor allele or both alleles showed differential expressions between affected tissue samples and normal tissue samples (Supplementary Table S3). Among them, some SNPs were found to have interesting molecular features (62–64) (Table 4). The top hub gene in both schizophrenia and bipolar networks was the CAMK2B gene. We found that the SNP rs11542227 in CAMK2B was an exonic splicing enhancer. We also imputed the genotypes of samples that were used for RNA-seq and tested the association of rs11542227 with schizophrenia and bipolar (65). Although we did not find association of rs11542227 with schizophrenia [P < 0.4155, odds ratio (OR) 1.37] and bipolar (P < 0.0541, OR 2.26), we identified association of rs11542228 that is only nine base pairs away from rs11542227 with bipolar (P < 0.009138, OR 2.90). P-value for testing the association of rs11542228 with schizophrenia still did not reach significance level, but close to  (P < 0.0617, OR 2.04). We also found that major allele at rs11542227 (P < 0.0241) and minor allele at rs11542228 (P < 0.0383) were differentially expressed between bipolar and normal tissues. To be noticed, we detected the co-expressed pattern of CAMK2B and CCND3 in both schizophrenia and bipolar networks. Interestingly, the alleles rs11542227 and rs11542228 had high canonical coefficients (see Figures 5 and 6 for details), which contributed mostly to the detection of the co-expressed pattern. Besides, we identified a cis-eQTL rs56346434 in intron within CAMK2B, which was associated with expression of rs11542227 (P < 7.8E-03). We also observed that rs1065359 and rs1127065 were located in CpG islands. Minor allele at rs1065359 and major allele at rs1127065 were differentially expressed between bipolar disorder and normal tissue samples (P < 0.0147 and P < 0.0292, respectively). Interestingly, rs1127065 was reported in a haplotype associated with fasting glucose alteration and weight gain (66). Its cis-eQTL site, rs4724298, detected in our study, was suspected to be a risk factor for therapeutic effect of risperidone in a pharmacogenetic study of antipsychotic response (67). rs11692815, which was located in PPP3R1, was a stop codon site. Its two alleles were differentially expressed between bipolar disorder and normal tissue samples (major, P < 0.0283; minor, P < 0.0377). Nearby SNP rs875 in the intron was a cis-eQTL, which was associated with expressions of both alleles at rs11692815 (major, P < 0.0044; minor, P < 0.000022). Although there were no direct evidences for the association of rs11692815 with bipolar disorder or schizophrenia, a nearby SNP rs1868402 (only −6.73 kb from rs11692815 and +1.11 kb from rs875) was most significantly associated with Alzheimer’s disease reported in a GWAS study (68). SNP rs3188952 in TBL1XR1 was a non-synonymous mutation. Its major allele was differentially expressed between bipolar disorder and normal tissues. SNP rs78060044 was associated with the expression of its major allele (P < 0.007), and SNP rs3188952 was highly significantly associated with the expression of its minor allele (P < 1.7
 ). Its nearby SNP rs1564764 was associated with schizophrenia (P < 0.02247, OR 2.61). The mutation of rs362384 in PSEN1 had been reported to be involved in Alzheimer’s disease (69). In our study, we found that a cis-eQTL site rs214260 was associated with the expression of major allele at rs362384 in PSEN1 (P < 7.2E-04), which was also reported to be involved with Alzheimer’s disease (70).
Table 4.
Biological characterization of typical SNPs in hub genes
| SNP | Gene |
P-values |
Function | |||||
|---|---|---|---|---|---|---|---|---|
| Schizophrenia |
Bipolar |
cis-eQTL(in groups) |
||||||
| Major | Minor | Major | Minor | SNP | ||||
| −14193bpa | PSEN1 | 0.262 | 0.0835 | 0.0454 | 0.0296 | |||
| rs362384 | PSEN1 | 0.209 | 0.3571 | 0.8719 | 0.099 | rs214260 (major) | 7.2E-04 | Non-synb |
| rs11692815 | PPP3R1 | 0.7297 | 0.8015 | 0.0283 | 0.0377 | rs875 (major) | 4.4E-03 | Non-syn; stop-gainb |
| rs875 (minor) | 2.2E-05 | |||||||
| rs9529 | CCND3 | 0.1552 | 0.8015 | 0.1076 | 0.1765 | rs16895130 (major) | 3.2E-05 | Non-synb; esec,d |
| rs4714522 (minor) | 4.0E-05 | |||||||
| +733bpa | CCND3 | 0.4127 | 0.2174 | 0.0156 | 0.015 | |||
| rs1065359 | CAMK2B | 0.1064 | 0.9904 | 0.7414 | 0.0147 | rs1127065 (major) | 2.0E-02 | CpG: 25e |
| rs76804431 (minor) | 1.0E-02 | |||||||
| rs1127065 | CAMK2B | 0.9711 | 0.18 | 0.0292 | 0.5598 | rs4724298 (major) | 3.2E-02 | CpG: 25e |
| rs1065359 (minor) | 1.5E-02 | |||||||
| rs11542227 | CAMK2B | 0.8915 | 0.9966 | 0.0241 | 0.0697 | rs56346434 (major) | 7.8E-03 | esec,d |
| rs56256432 (major) | 7.8E-03 | |||||||
| rs3188952 | TBL1XR1 | 0.9056 | 0.1264 | 0.0202 | 0.8172 | rs78060044 (major) | 1.7E-03 | Non-synb |
| rs3188952 (minor) | 1.7E-10 | |||||||
a‘−’ stands for upstream of the nearby SNP; ‘+’ stands for downstream of the nearby SNP.
bH-Inv database v 7.0.
cese is short for exonic splicing enhancer.
dGeneCard.
eSNP nexus database.
DISCUSSION
Allele-specific alternative splicing, polyadenylation, allele-specific transcription start sites and differential promoter usage generate a large variability at the transcriptional level. RNA-seq technologies are able to measure mRNA variation across the genes. They provide substantially detailed biological insight than microarray platform. RNA-seq is now opening unprecedented avenues to address the analysis of entire transcriptomes (71). However, few statistical methods for construction of co-expression network with RNA-seq data are available. RNA-seq also poses great challenges to use its remarkable features in analysis. To address these challenges, we developed two CCA-based statistical methods for construction of co-expression networks with RNA-seq data. We demonstrated that the CCA can effectively use position- and allele-level information of RNA-seq and has several remarkable features.
First, a unique strength of the CCA for construction of co-expression networks is its ability to explore substantial variation of mRNA expression across SNPs. The current statistical methods for construction of co-expression networks are designed to infer network structure using overall gene expression and cannot allow the levels of expressions to vary across the positions and SNPs. However, the CCA is to measure correlation between two sets of count of sequenced reads across SNPs within the genes; hence, it can consider genomic position and allele levels of expressions. The CCA for construction of co-expression networks is designed for RNA-seq data.
Second, the co-expression networks constructed by the CCA are more similar to true biological network than the networks constructed by the current methods and overall gene expressions. Our network topology analysis illustrates that the connectivity, centralization and heterogeneity of the co-expression networks estimated by the CCA methods are much higher than that estimated by the current methods (taking GLASSO as a representative) and overall gene expressions. Simulations show that the networks constructed by the overall gene expressions are similar to random networks. Our analysis of lung cancer TCGA data set also demonstrates that the co-expression network constructed by CCA is more overlapped with the pathways in KEGG database than the network constructed by GLASSO method.
Third, the major advantage of bivariate CCA for construction of co-expression networks is its ability to explore information on allelic differences of mRNA expressions. Widespread ASE was observed (72). It may be expected that almost every gene shows allelic differences of expressions (2). ASE provides substantially detailed biological insight into transcriptome structure. To use ASE information, we develop novel bivariate CCA for construction of co-expression networks. We demonstrate that the co-expression networks constructed by ASE and bivariate CCA in schizophrenia and bipolar RNA-seq data analysis harbour highly connected genes with biological significance. We observe that a number of alternative splicing enhancer, stop codon sites, CpG island, non-synonymous mutations in the hub genes show significant allelic differences in expressions between schizophrenia and normal samples or between bipolar and normal samples. The genetic variation of some of these sites are associated with either schizophrenia or bipolar or both. We also identify cis-eQTLs that underlie ASE variation of the identified hub genes. The co-expression networks constructed by ASE data and bivariate CCA provide rich genetic and molecular information to gain insight into biological processes and disease mechanism. However, the co-expression networks constructed by the GLASSO method and overall gene expression data summarizing all number of reads across the gene are similar to random networks. We observed few hub genes showing biological significance in these co-expression networks.
RNA-seq can identify different mRNA variants and measure expressions at exon, SNP, positional and allelic levels. Gene co-expression variations are often caused by alternative and allele-specific splicing, alternative polyadenylation of pre-messenger RNA molecules and alternative promoter usage. The proposed CCA methods for construction of co-expression networks take the various transcript variants into account; hence, they can consider complex patterns of gene expressions. Therefore, they can accurately predict co-expressions and efficiently characterize regulatory processes, which finally lead to discovery of mechanism underlying complex traits. Summarizing number of sequence reads along transcripts into an overall expression of the gene removes substantial mRNA variation across the transcripts and information on regulatory process. Substantial biological information contained in the gene expressions will be lost in the co-expression networks constructed by the current methods and overall gene expressions. The CCA for co-expression network construction with RNA-seq data substantially outperforms the current statistical methods for co-expression network construction with microarray expression data or RNA-seq data based on overall gene expression levels.
Digital transcriptome RNA-seq analysis open up unprecedented avenue to address the analysis of entire transcriptomes. The results in this article are preliminary. The purpose of this article is to stimulate further discussions regarding great challenges we are facing in developing statistical methods and computational algorithms for analysing large and formidably complex data sets to optimally use biological information hidden in the RNA-seq data and unravel mechanism of diseases.
SUPPLEMENTARY DATA
Supplementary Data are available at NAR Online: Supplementary Tables 1–3 and Supplementary Figures 1–11.
FUNDING
National Institutes of Health and NHLBI [1R01AR057120–01, 1R01HL106034-01]; National Basic Research Program [2012CB944600]; Ministry of Science and Technology [2011BAI09B00, 2007AA02Z312]; Ministry of Health [201002007]; National Science Foundation of China [30890034]. Funding for open access charge: National Basic Research Program [2012CB944600].
Conflict of interest statement. None declared.
Supplementary Material
ACKNOWLEDGEMENTS
The authors thank the China Scholarship Council for supporting Shengjun Hong’s 2 years study at the University of Texas at Houston. They also acknowledge the TCGA Research Group for their work to publish data.
REFERENCES
- 1.Costa V, Aprile M, Esposito R, Ciccodicola A. RNA-Seq and human complex diseases: recent accomplishments and future perspectives. Eur. J. Hum. Genet. 2012;21:134–142. doi: 10.1038/ejhg.2012.129. [DOI] [PMC free article] [PubMed] [Google Scholar]
- 2.Skelly DA, Johansson M, Madeoy J, Wakefield J, Akey JM. A powerful and flexible statistical framework for testing hypotheses of allele-specific gene expression from RNA-seq data. Genome Res. 2011;21:1728–1737. doi: 10.1101/gr.119784.110. [DOI] [PMC free article] [PubMed] [Google Scholar]
- 3.Wang Z, Gerstein M, Snyder M. RNA-Seq: a revolutionary tool for transcriptomics. Nat. Rev. Genet. 2009;10:57–63. doi: 10.1038/nrg2484. [DOI] [PMC free article] [PubMed] [Google Scholar]
- 4.Westermann AJ, Gorski SA, Vogel J. Dual RNA-seq of pathogen and host. Nat. Rev. Microbiol. 2012;10:618–630. doi: 10.1038/nrmicro2852. [DOI] [PubMed] [Google Scholar]
- 5.Uyar B, Chu JS, Vergara IA, Chua SY, Jones MR, Wong T, Baillie DL, Chen N. RNA-seq analysis of the C. briggsae transcriptome. Genome Res. 2012;22:1567–1580. doi: 10.1101/gr.134601.111. [DOI] [PMC free article] [PubMed] [Google Scholar]
- 6.Kugler KG, Mueller LA, Graber A, Dehmer M. Integrative network biology: graph prototyping for co-expression cancer networks. PLoS One. 2011;6:e22843. doi: 10.1371/journal.pone.0022843. [DOI] [PMC free article] [PubMed] [Google Scholar]
- 7.Auffray C, Hood L. Editorial: systems biology and personalized medicine—the future is now. Biotechnol. J. 2012;7:938–939. doi: 10.1002/biot.201200242. [DOI] [PubMed] [Google Scholar]
- 8.Xulvi-Brunet R, Li H. Co-expression networks: graph properties and topological comparisons. Bioinformatics. 2010;26:205–214. doi: 10.1093/bioinformatics/btp632. [DOI] [PMC free article] [PubMed] [Google Scholar]
- 9.Ray M, Zhang W. Analysis of Alzheimer's disease severity across brain regions by topological analysis of gene co-expression networks. BMC Syst. Biol. 2010;4:136. doi: 10.1186/1752-0509-4-136. [DOI] [PMC free article] [PubMed] [Google Scholar]
- 10.Ideker T, Krogan NJ. Differential network biology. Mol. Syst. Biol. 2012;8:565. doi: 10.1038/msb.2011.99. [DOI] [PMC free article] [PubMed] [Google Scholar]
- 11.Iancu OD, Kawane S, Bottomly D, Searles R, Hitzemann R, McWeeney S. Utilizing RNA-Seq data for de novo coexpression network inference. Bioinformatics. 2012;28:1592–1597. doi: 10.1093/bioinformatics/bts245. [DOI] [PMC free article] [PubMed] [Google Scholar]
- 12.Zhang B, Horvath S. A general framework for weighted gene co-expression network analysis. Stat. Appl. Genet. Mol. Biol. 2005;4:Article17. doi: 10.2202/1544-6115.1128. [DOI] [PubMed] [Google Scholar]
- 13.Peng J, Wang P, Zhou N, Zhu J. Partial correlation estimation by joint sparse regression models. J. Am. Stat. Assoc. 2009;104:735–746. doi: 10.1198/jasa.2009.0126. [DOI] [PMC free article] [PubMed] [Google Scholar]
- 14.Butte AJ, Kohane IS. Mutual information relevance networks: functional genomic clustering using pairwise entropy measurements. Pac. Symp. Biocomput. 2000:418–429. doi: 10.1142/9789814447331_0040. [DOI] [PubMed] [Google Scholar]
- 15.Zhou S, Rütimann P, Xu M, Bühlmann P. High-dimensional covariance estimation based on Gaussian graphical models. J. Mach. Learn. Res. 2011;12:2975–3026. [Google Scholar]
- 16.Garber M, Grabhert MG, Guttman M, Trapnell C. Computational methods for transcriptome annotation and quantification using RNA-seq. Nat. Methods. 2011;8:469–477. doi: 10.1038/nmeth.1613. [DOI] [PubMed] [Google Scholar]
- 17.Kanehisa M, Goto S. KEGG: kyoto encyclopedia of genes and genomes. Nucleic Acids Res. 2000;28:27–30. doi: 10.1093/nar/28.1.27. [DOI] [PMC free article] [PubMed] [Google Scholar]
- 18.Kanehisa M, Goto S, Sato Y, Furumichi M, Tanabe M. KEGG for integration and interpretation of large-scale molecular data sets. Nucleic Acids Res. 2011;40:D109–D114. doi: 10.1093/nar/gkr988. [DOI] [PMC free article] [PubMed] [Google Scholar]
- 19.Johnson RA, Wichern DW. Applied Multivariate Statistical Analysis. New Jersey: Prentice Hall; 2002. [Google Scholar]
- 20.Fujikoshi Y. The likelihood ratio tests for the dimensionality of regression coefficients. J. Multivar. Anal. 1974;4:327–340. [Google Scholar]
- 21.Friedman J, Hastie T, Tibshirani R. Sparse inverse covariance estimation with the graphical lasso. Biostatistics. 2008;9:432–441. doi: 10.1093/biostatistics/kxm045. [DOI] [PMC free article] [PubMed] [Google Scholar]
- 22.Zhang Y, Wang L, Zhang M, Jin M, Bai C, Wang X. Potential mechanism of interleukin-8 production from lung cancer cells: an involvement of EGF-EGFR-PI3K-Akt-Erk pathway. J. Cell Physiol. 2012;227:35–43. doi: 10.1002/jcp.22722. [DOI] [PubMed] [Google Scholar]
- 23.Yu Y, Luk F, Yang JL, Walsh WR. Ras/Raf/MEK/ERK pathway is associated with lung metastasis of osteosarcoma in an orthotopic mouse model. Anticancer Res. 2011;31:1147–1152. [PubMed] [Google Scholar]
- 24.Klemm K, Bornholdt S. Topology of biological networks and reliability of information processing. Proc. Natl Acad. Sci. USA. 2005;102:18414–18419. doi: 10.1073/pnas.0509132102. [DOI] [PMC free article] [PubMed] [Google Scholar]
- 25.Newman MEJ. Assortative mixing in networks. Phys. Rev. Lett. 2002;89:208701. doi: 10.1103/PhysRevLett.89.208701. [DOI] [PubMed] [Google Scholar]
- 26.Freeman L. Centrality in social network conceptual clarification. Soc. Netw. 1978;1:215–239. [Google Scholar]
- 27.Ban HJ, Kim SC, Seo J, Kang HB, Choi JK. Genetic and metabolic characterization of insomnia. PLoS One. 2011;6:e18455. doi: 10.1371/journal.pone.0018455. [DOI] [PMC free article] [PubMed] [Google Scholar]
- 28.Rakic P, Bourgeois JP, Goldman- Rakic PS. Synaptic devel-opment of the cerebral cortex: implications for learning, memory, and mental illness. Prog. Brain Res. 1994;102:227–243. doi: 10.1016/S0079-6123(08)60543-9. [DOI] [PubMed] [Google Scholar]
- 29.Zhou K, Yang Y, Gao L, He G, Li W, Tang K, Ji B, Zhang M, Li Y, Yang J, et al. NMDA receptor hypofunction induces dysfunctions of energy metabolism and semaphorin signaling in rats: a synaptic proteome study. Schizophr Bull. 2012;38:579–591. doi: 10.1093/schbul/sbq132. [DOI] [PMC free article] [PubMed] [Google Scholar]
- 30.Xing G, Russell S, Hough C, O’Grady J, Zhang L, Yang S. Decreased prefrontal CaMKII alpha mRNA in bipolarillness. Neuroreport. 2002;13:501–505. doi: 10.1097/00001756-200203250-00029. [DOI] [PubMed] [Google Scholar]
- 31.Davis RJ. Signal transduction by the JNK group of MAP kinases. Cell. 2000;103:239–252. doi: 10.1016/s0092-8674(00)00116-1. [DOI] [PubMed] [Google Scholar]
- 32.Kyosseva SV, Owens SM, Elbein AD, Karson CN. Differential and region-specific activation of mitogen-activated protein kinases following chronic administration of phencyclidine in rat brain. Neuropsychopharmacology. 2001;24:267–277. doi: 10.1016/S0893-133X(00)00180-9. [DOI] [PubMed] [Google Scholar]
- 33.Kyosseva SV. The role of the extracellular signal-regulated kinase pathway in cerebellar abnormalities in schizophrenia. Cerebellum. 2004;3:94–99. doi: 10.1080/14734220410029164. [DOI] [PubMed] [Google Scholar]
- 34.Kyosseva SV. Differential expression of mitogen-activated protein kinases and immediate early genes fos and jun in thalamus in schizophrenia. Prog. Neuropsychopharmacol. Biol. Psychiatry. 2004;28:997–1006. doi: 10.1016/j.pnpbp.2004.05.017. [DOI] [PubMed] [Google Scholar]
- 35.Kyosseva SV, Elbein AD, Hutton TL, Griffin ST, Mrak RE, Sturner WQ, Karson CN. Increased levels of transcription factors Elk-1, cyclic adenosine monophosphate response element-binding protein, and activating transcription factor 2 in the cerebellar vermis of schizophrenic patients. Arch. Gen. Psychiatry. 2000;57:685–691. doi: 10.1001/archpsyc.57.7.685. [DOI] [PubMed] [Google Scholar]
- 36.Aoki K, Taketo MM. Adenomatous polyposis coli (APC): a multi-functional tumor suppressor gene. J. Cell Sci. 2007;120:3327–3335. doi: 10.1242/jcs.03485. [DOI] [PubMed] [Google Scholar]
- 37.Guerini D, Krinks MH, Sikela JM, Hahn WE, Klee CB. Isolation and sequence of a cDNA clone for human calcineurin B, the Ca2+-binding subunit of the Ca2+/calmodulin-stimulated protein phosphatase. DNA. 1989;8:675–682. doi: 10.1089/dna.1.1989.8.675. [DOI] [PubMed] [Google Scholar]
- 38.Miyakawa T, Leiter LM, Gerber DJ, Gainetdinov RR, Sotnikova TD, Zeng H, Caron MG, Tonegawa S. Conditional calcineurin knockout mice exhibit multiple abnormal behaviors related to schizophrenia. Proc. Natl Acad. Sci. USA. 2003;100:8987–8992. doi: 10.1073/pnas.1432926100. [DOI] [PMC free article] [PubMed] [Google Scholar]
- 39.Shao L, Vawter MP. Shared gene expression alterations in schizophrenia and bipolar disorder. Biol. Psychiatry. 2008;64:89–97. doi: 10.1016/j.biopsych.2007.11.010. [DOI] [PMC free article] [PubMed] [Google Scholar]
- 40.Devon RS, Anderson S, Teague PW, Muir WJ, Murray V, Pelosi AJ, Blackwood DH, Porteous DJ. The genomic organisation of the metabotropic glutamate receptor subtype 5 gene, and its association with schizophrenia. Mol. Psychiatry. 2001;6:311–314. doi: 10.1038/sj.mp.4000848. [DOI] [PubMed] [Google Scholar]
- 41.Bruno V, Battaglia G, Copani A, D'Onofrio M, Di Iorio P, De Blasi A, Melchiorri D, Flor PJ, Nicoletti F. Metabotropic glutamate receptor subtypes as targets for neuroprotective drugs. J. Cereb. Blood Flow Metab. 2001;21:1013–1033. doi: 10.1097/00004647-200109000-00001. [DOI] [PubMed] [Google Scholar]
- 42.Lan KL, Sarvazyan NA, Taussig R, Mackenzie RG, DiBello PR, Dohlman HG, Neubig RR. A point mutation in Galphao and Galphai1 blocks interaction with regulator of G protein signaling proteins. J. Biol. Chem. 1998;273:12794–12797. doi: 10.1074/jbc.273.21.12794. [DOI] [PubMed] [Google Scholar]
- 43.Mirnics K, Middleton FA, Stanwood GD, Lewis DA, Levitt P. Disease-specific changes in regulator of G-protein signaling 4 (RGS4) expression in schizophrenia. Mol. Psychiatry. 2001;6:293–301. doi: 10.1038/sj.mp.4000866. [DOI] [PubMed] [Google Scholar]
- 44.Morris DW, Rodgers A, McGhee KA, Schwaiger S, Scully P, Quinn J, Meagher D, Waddington JL, Gill M, Corvin AP. Confirming RGS4 as a susceptibility gene for schizophrenia. Am. J. Med. Genet. B Neuropsychiatr. Genet. 2004;125B:50–53. doi: 10.1002/ajmg.b.20109. [DOI] [PubMed] [Google Scholar]
- 45.Prasad KM, Chowdari KV, Nimgaonkar VL, Talkowski ME, Lewis DA, Keshavan MS. Genetic polymorphisms of the RGS4 and dorsolateral prefrontal cortex morphometry among first episode schizophrenia patients. Mol. Psychiatry. 2005;10:213–219. doi: 10.1038/sj.mp.4001562. [DOI] [PubMed] [Google Scholar]
- 46.Aoyama S, Shirakawa O, Ono H, Hashimoto T, Kajimoto Y, Maeda K. Mutation and association analysis of the DAP-1 gene with schizophrenia. Psychiatry Clin. Neurosci. 2003;57:545–547. doi: 10.1046/j.1440-1819.2003.01162.x. [DOI] [PubMed] [Google Scholar]
- 47.Kajimoto Y, Shirakawa O, Lin XH, Hashimoto T, Kitamura N, Murakami N, Takumi T, Maeda K. Synapse-associated protein 90/postsynaptic density-95-associated protein (SAPAP) is expressed differentially in phencyclidine-treated rats and is increased in the nucleus accumbens of patients with schizophrenia. Neuropsychopharmacology. 2003;28:1831–1839. doi: 10.1038/sj.npp.1300212. [DOI] [PubMed] [Google Scholar]
- 48.The UniProt Consortium. Reorganizing the protein space at the Universal Protein Resource (UniProt) Nucleic Acids Res. 2012;40:D71–D75. doi: 10.1093/nar/gkr981. [DOI] [PMC free article] [PubMed] [Google Scholar]
- 49.St George-Hyslop P, Fraser PE. Assembly of the presenilin gamma-/epsilon-secretase complex. J. Neurochem. 2012;120(Suppl 1):84–88. doi: 10.1111/j.1471-4159.2011.07505.x. [DOI] [PubMed] [Google Scholar]
- 50.Duff K, Eckman C, Zehr C, Yu X, Prada CM, Perez-tur J, Hutton M, Buee L, Harigaya Y, Yager D, et al. Increased amyloid-beta42(43) in brains of mice expressing mutant presenilin 1. Nature. 1996;383:710–713. doi: 10.1038/383710a0. [DOI] [PubMed] [Google Scholar]
- 51.Rujescu D, Collier DA. Dissecting the many genetic faces of schizophrenia. Epidemiol. Psichiatr. Soc. 2009;18:91–95. [PubMed] [Google Scholar]
- 52.Yoon HG, Chan DW, Huang ZQ, Li J, Fondell JD, Qin J, Wong J. Purification and functional characterization of the human N-CoR complex: the roles of HDAC3, TBL1 and TBLR1. EMBO J. 2003;22:1336–1346. doi: 10.1093/emboj/cdg120. [DOI] [PMC free article] [PubMed] [Google Scholar]
- 53.Perlis RH, Huang J, Purcell S, Fava M, Rush AJ, Sullivan PF, Hamilton SP, McMahon FJ, Schulze TG, Potash JB, et al. Genome-wide association study of suicide attempts in mood disorder patients. Am. J. Psychiatry. 2010;167:1499–1507. doi: 10.1176/appi.ajp.2010.10040541. [DOI] [PMC free article] [PubMed] [Google Scholar]
- 54.Masliah E, Iimoto DS, Mallory M, Albright T, Hansen L, Saitoh T. Casein kinase II alteration precedes tau accumulation in tangle formation. Am. J. Pathol. 1992;140:263–268. [PMC free article] [PubMed] [Google Scholar]
- 55.Plyte SE, Hughes K, Nikolakaki E, Pulverer BJ, Woodgett JR. Glycogen synthase kinase-3: functions in oncogenesis and development. Biochim. Biophys. Acta. 1992;1114:147–162. doi: 10.1016/0304-419x(92)90012-n. [DOI] [PubMed] [Google Scholar]
- 56.Kwok JB, Hallupp M, Loy CT, Chan DK, Woo J, Mellick GD, Buchanan DD, Silburn PA, Halliday GM, Schofield PR. GSK3B polymorphisms alter transcription and splicing in Parkinson's disease. Ann. Neurol. 2005;58:829–839. doi: 10.1002/ana.20691. [DOI] [PubMed] [Google Scholar]
- 57.Benedetti F, Bernasconi A, Lorenzi C, Pontiggia A, Serretti A, Colombo C, Smeraldi E. A single nucleotide polymorphism in glycogen synthase kinase 3-beta promoter gene influences onset of illness in patients affected by bipolar disorder. Neurosci. Lett. 2004;355:37–40. doi: 10.1016/j.neulet.2003.10.021. [DOI] [PubMed] [Google Scholar]
- 58.Mozhui KWX, Chen J, Mulligan MK, Li Z, Ingles J, Chen X, Lu L, Williams RW. Genetic regulation of Nrnx1 expression: an integrative cross-species analysis of schizophrenia candidate genes. Transl. Psychiatry. 2011;1:e38. doi: 10.1038/tp.2011.24. [DOI] [PMC free article] [PubMed] [Google Scholar]
- 59.Dalski A, Wagner HJ, Schwinger E, Zuhlke C. Quantitative PCR analysis of different splice forms of NFAT5 revealed specific gene expression in fetal and adult brain. Brain Res. Mol. Brain Res. 2000;83:125–127. doi: 10.1016/s0169-328x(00)00202-3. [DOI] [PubMed] [Google Scholar]
- 60.Hodis E, Watson IR, Kryukov GV, Arold ST, Imielinski M, Theurillat JP, Nickerson E, Auclair D, Li L, Place C, et al. A landscape of driver mutations in melanoma. Cell. 2012;150:251–263. doi: 10.1016/j.cell.2012.06.024. [DOI] [PMC free article] [PubMed] [Google Scholar]
- 61.Node-Langlois R, Muller D, Boda B. Sequential implication of the mental retardation proteins ARHGEF6 and PAK3 in spine morphogenesis. J. Cell Sci. 2006;119:4986–4993. doi: 10.1242/jcs.03273. [DOI] [PubMed] [Google Scholar]
- 62.Safran M, Dalah I, Alexander J, Rosen N, Iny Stein T, Shmoish M, Nativ N, Bahir I, Doniger T, Krug H, et al. GeneCards Version 3: the human gene integrator. Database (Oxford) 2010;2010:baq020. doi: 10.1093/database/baq020. [DOI] [PMC free article] [PubMed] [Google Scholar]
- 63.Yamasaki C, Murakami K, Takeda J, Sato Y, Noda A, Sakate R, Habara T, Nakaoka H, Todokoro F, Matsuya A, et al. H-InvDB in 2009: extended database and data mining resources for human genes and transcripts. Nucleic Acids Res. 2010;38:D626–D632. doi: 10.1093/nar/gkp1020. [DOI] [PMC free article] [PubMed] [Google Scholar]
- 64.Chelala C, Khan A, Lemoine NR. SNPnexus: a web database for functional annotation of newly discovered and public domain single nucleotide polymorphisms. Bioinformatics. 2009;25:655–661. doi: 10.1093/bioinformatics/btn653. [DOI] [PMC free article] [PubMed] [Google Scholar]
- 65.Browning BL, Browning SR. A unified approach to genotype imputation and haplotype-phase inference for large data sets of trios and unrelated individuals. Am. J. Hum. Genet. 2009;84:210–223. doi: 10.1016/j.ajhg.2009.01.005. [DOI] [PMC free article] [PubMed] [Google Scholar]
- 66.Weedon MN, Clark VJ, Qian Y, Ben-Shlomo Y, Timpson N, Ebrahim S, Lawlor DA, Pembrey ME, Ring S, Wilkin TJ, et al. A common haplotype of the glucokinase gene alters fasting glucose and birth weight: association in six studies and population-genetics analyses. Am. J. Hum. Genet. 2006;79:991–1001. doi: 10.1086/509517. [DOI] [PMC free article] [PubMed] [Google Scholar]
- 67.Need AC, Keefe RS, Ge D, Grossman I, Dickson S, McEvoy JP, Goldstein DB. Pharmacogenetics of antipsychotic response in the CATIE trial: a candidate gene analysis. Eur. J. Hum. Genet. 2009;17:946–957. doi: 10.1038/ejhg.2008.264. [DOI] [PMC free article] [PubMed] [Google Scholar]
- 68.Cruchaga C, Kauwe JS, Mayo K, Spiegel N, Bertelsen S, Nowotny P, Shah AR, Abraham R, Hollingworth P, Harold D, et al. SNPs associated with cerebrospinal fluid phospho-tau levels influence rate of decline in Alzheimer's disease. PLoS Genet. 2010;6:e1001101. doi: 10.1371/journal.pgen.1001101. [DOI] [PMC free article] [PubMed] [Google Scholar]
- 69.Kauwe JS, Jacquart S, Chakraverty S, Wang J, Mayo K, Fagan AM, Holtzman DM, Morris JC, Goate AM. Extreme cerebrospinal fluid amyloid beta levels identify family with late-onset Alzheimer's disease presenilin 1 mutation. Ann. Neurol. 2007;61:446–453. doi: 10.1002/ana.21099. [DOI] [PubMed] [Google Scholar]
- 70.Hamilton G, Harris SE, Davies G, Liewald DC, Tenesa A, Starr JM, Porteous D, Deary IJ. Alzheimer's disease genes are associated with measures of cognitive ageing in the lothian birth cohorts of 1921 and 1936. Int. J. Alzheimers Dis. 2011;2011:505984. doi: 10.4061/2011/505984. [DOI] [PMC free article] [PubMed] [Google Scholar]
- 71.Richard H, Schulz MH, Sultan M, Nurnberger A, Schrinner S, Balzereit D, Dagand E, Rasche A, Lehrach H, Vingron M, et al. Prediction of alternative isoforms from exon expression levels in RNA-Seq experiments. Nucleic Acids Res. 2010;38:e112. doi: 10.1093/nar/gkq041. [DOI] [PMC free article] [PubMed] [Google Scholar]
- 72.Rozowsky J, Abyzov A, Wang J, Alves P, Raha D, Harmanci A, Leng J, Bjornson R, Kong Y, Kitabayashi N, et al. AlleleSeq: analysis of allele-specific expression and binding in a network framework. Mol. Syst. Biol. 2011;7:522. doi: 10.1038/msb.2011.54. [DOI] [PMC free article] [PubMed] [Google Scholar]
Associated Data
This section collects any data citations, data availability statements, or supplementary materials included in this article.