


Abstract
To determine the functional specificity of inflammation, it is critical to orchestrate the timely activation and repression of inflammatory responses. Here, we explored the PAF1 (RNA polymerase II associated factor)-mediated signal- and locus-specific repression of genes induced through the pro-inflammatory cytokine interleukin (IL)-1β. Using microarray analysis, we identified the PAF1 target genes whose expression was further enhanced by PAF1 knockdown in IL-1β–stimulated HepG2 hepatocarcinomas. PAF1 bound near the transcription start sites of target genes and dissociated on stimulation. In PAF1-deficient cells, more elongating RNA polymerase II and acetylated histones were observed, although IL-1β–mediated activation and recruitment of nuclear factor κB (NF-κB) were not altered. Under basal conditions, PAF1 blocked histone acetyltransferase general control non-depressible 5 (GCN5)-mediated acetylation on H3K9 and H4K5 residues. On IL-1β stimulation, activated GCN5 discharged PAF1 from chromatin, allowing productive transcription to occur. PAF1 bound to histones but not to acetylated histones, and the chromatin-binding domain of PAF1 was essential for target gene repression. Moreover, IL-1β–induced cell migration was similarly controlled through counteraction between PAF1 and GCN5. These results suggest that the IL-1β signal-specific exchange of PAF1 and GCN5 on the target locus limits inappropriate gene induction and facilitates the timely activation of inflammatory responses.
INTRODUCTION
Interleukin-1β (IL-1β) is one of main inflammatory cytokines released from the local inflammatory site, together with tumor necrosis factor (TNF)-α and IL-6, to mediate the induction of defense and tissue repair responses on recognition of the danger or pathogen (1). The recognition of IL-1β by the IL-1 receptor activates DNA sequence-specific transcription factors and induces the expression of inflammatory proteins, including acute phase proteins in the liver, chemokines and adhesion molecules in infiltrating immune cells and extracellular proteases for tissue remodeling (2,3). IL-1β–dependent responses, including fever, metastases, angiogenesis, proliferation, apoptosis and cartilage breakdown, are required for pathogen clearance or stress adaptation; however, excessive IL-1β is strongly linked to disease states, as reported in research on myocardial infarction from ischemic injury, atherosclerosis, type 2 diabetes and cancer (2,3). Hence, inflammatory gene expression should be selectively repressed under basal conditions to prevent detrimental effects. However, compared with the activation mechanism, the transcriptional repression of inflammatory gene expression without stimulation is poorly understood.
To ensure the appropriate temporal and spatial control of inflammation, the expression of genes required for the inflammatory response is well orchestrated through signal-specific transcription factors, epigenetic regulators and mRNA stability regulators (4–6). The recognition of IL-1β initiates signaling cascades that eventually activate DNA sequence-specific transcription factors, such as activator protein 1 (AP-1), interferon regulatory factor 3 (IRF3), CCAAT/enhancer-binding protein β (CEBP/β) and NF-κB (3,7,8). The activated transcription factors interact with histone acetyltransferases (HATs) and histone deacetyltransferases to define the signal-specific target genes for transcriptional regulation (5,6,9). Similarly, histone methyltransferases (HMTs), chromatin remodelers and transcription co-activators are also recruited, via protein interactions, for the exquisite control of the epigenetic status of target loci (5). Because of the selectivity and complexity of the inflammatory process, every step of transcription is coupled and inter-connected for the temporal, quantitative and locus-specific regulation of IL-1β–responsive gene expression.
PAF1 is a component of the PAF complex (PAFc), which was characterized as an Srb-containing mediator-independent RNA polymerase II (Pol II)-binding factor (10,11). PAF1 comprises the protein subunits PAF1, CTR9, LEO1, CDC73 and RTF1 (human PAFc also includes SKI8) and has been associated with virtually every step of transcription, including diverse histone modifications (11). The PAFc recruits SET1 via H2B ubiquitination or SET2 histone-modifying enzymes to the promoter and coding regions of actively transcribed target genes, respectively (11–14). In addition, recent studies suggest that PAFc plays a role in the transcriptional repression of selected target genes. PAFc is required for the recruitment of suppressor of variegation 3-9 homolog 1 (SUV39H1), the histone methyltransferase responsible for repressive H3K9 trimethylation at the promoter region of the target gene CCND1 (15). In yeast, the presence of PAFc inhibits the association of the transcriptional activator GCN4 with chromatin and the subsequent acetylation of histones (16). The regulation of histone acetylation through PAFc also modulates cryptic transcription in yeast, but the underlying mechanisms remain elusive (17).
Because of its global role as a platform for Pol II-mediated transcription, PAFc was initially considered as a component of the general transcription machinery (11). However, subsequent studies have indicated signal- and locus-specific roles for PAFc in cell cycle regulation, apoptosis and development (18–22). Alterations in mCdc73 cause growth retardation and early fatality during development (21), while genetic components of PAFc are mutated or duplicated in various types of cancer (23). Moreover, it was recently suggested that PAFc plays a role in the anti-viral response and inflammatory gene regulation (24,25). We previously observed a dynamic Paf1 expression in the liver of mice during systemic inflammation (25). Based on this observation, we characterized the involvement of PAF1 in the transcriptional regulation of inflammation. In the present study, we demonstrate the molecular mechanism of the repressive PAF1 in IL-1β–inducible gene expression under basal conditions. The dynamic association and dissociation of PAF1 to target chromatin was delicately controlled in a signal- and GCN5-dependent manner via histone acetylation.
MATERIALS AND METHODS
Cell culture, transfection and reagents
HegG2 cells were grown in minimum essential medium (MEM) with 10% fetal bovine serum (FBS) (Hyclone, Logan, UT, USA) and penicillin/streptomycin (Invitrogen, Carlsbad, CA, USA). For stimulation, cells were treated with rhIL-6 plus IL-6sR, interferon (IFN)-α/β, TNF-α, IL-10 or IL-1β (all purchased from R&D systems, Minneapolis, MN, USA). BAY 11-7082, SP600125 and SB202190 were purchased from Sigma-Aldrich (St. Louis, MO, USA). Transfections were performed with Lipofectamine 2000 (Invitrogen). Sequences of siRNA are provided in Supplementary Table S1.
Plasmids
Cloning of mPAF1-MYC (N′-EQKLISEEDL-C′, peptide sequence of c-myc) and mCTR9-MYC are described in the study conducted by Youn et al. (25). For mLEO1-V5 expression vector, cDNA was amplified by reverse transcriptase–polymerase chain reaction (RT–PCR) from lipopolysaccharides (LPS)-treated mice liver and then cloned using Gateway recombination system (Invitrogen). Human PLAU promoter (−1973 to +132) or JUN promoter (−374 to +170) was amplified from HepG2 genomic DNA and cloned into pGL3-basic vector (Promega, Madison, WI, USA). Deletion mutants of mPAF1 were generated by PCR and cloned into pcDNA3.1 expression vector. For PAF1 shRNA, primers targeting hPAF1 mRNA (794–813, AAGAGACGTTGAAGAAACGAA) were cloned into pSilencer™ vector (Invitrogen). To obtain glutathion-S-transferase (GST) tagged PAF1 expression plasmid, hPAF1 cDNA was cloned into the pEBG vector.
RNA purification and quantitative analysis
Total RNA was isolated with the RNA isoplus (TAKARA BIO, Japan) reagent. For cDNA synthesis, 1 µg of RNA was used for the reverse transcription using an oligo-dT15 primer (Promega). Quantitative real-time PCR was performed with 2× SYBR premix (TAKARA BIO) and specific primers using StepOne Real-Time PCR System (Applied Biosystems, Foster City, CA, USA). Primers for real-time PCR are listed in Supplementary Table S2.
Microarray analysis
HepG2 cells were transfected with PAF1-shRNA or control-shRNA for 48 h. After stimulation with IL-1β (10 ng/ml) for 3 h, total RNA was extracted and purified with RNeasy kit (Qiagen, Valencia, CA, USA). A total of 500 ng of RNA was amplified with Totalprep amplification kit (Ambion, Austin, TX, USA). Amplified cDNA was hybridized to HumanRef_8_v3 expression beadchip and scanned with the Illumina BeadArray Reader (Illumina Inc., San Diego, CA, USA).
Luciferase assay
HepG2 cells were transfected with reporter construct along with pRL-gapdhPro to normalize the transfection efficiency. Cells were stimulated with IL-1β (10 ng/ml) for 12 h, and luciferase activity was measured with a dual luciferase assay kit (Promoga) according to manufacturer’s instruction.
Immunoblotting
Cells were harvested in lysis buffer [150 mM NaCl, 1% Triton X-100, 25 mM Tris, pH 7.5, 0.5% deoxycholic acid, 0.1% sodium dodecyl sulfate (SDS), 1 mM dithiothreitol(DTT), 2 µg/ml of pepstatin, 0.1 mg/ml of phenylmethanesulfonyl fluoride (PMSF), 5 µg/ml of aprotinin, 5 µg/ml of leupeptin, 1 mM benzamidine, 160 mM β-glycerophosphate and 10 mM NaF], and total cell lysates were separated by SDS–polyacrylamide gel electrophoresis. For detection of the immunoreactive signal, the LAS4000 image analyzer (Fujifilm, Japan) was used. Anti-PAF1, -CTR9 and -LEO1 antibodies were purchased from Bethyl laboratory (Montgomery, TX, USA), anti-CDC73, -TATA-binding protein (TBP), -p65, -MYC, -IκB-α and -Pol II (pan-CTD) from Santacruz (Santa Cruz, CA, USA), anti-Pol II (S2P) from Abcam and anti-cJUN, phospho-cJUN and phospho-p38 from NEB (Ipswich, MA, USA).
Chromatin-bound and -unbound fractionations
Cell fractionation was performed as described previously (26). Cells were incubated with chromatin-unbound fraction buffer (100 mM NaCl, 300 mM sucrose, 10 mM 1,4-Piperazinediethanesulfonic acid (PIPES), pH 6.8, 3 mM MgCl2, 1 mM Ethylene-bis(oxyethylenenitrilo)tetraacetic acid (EGTA), 0.2% Triton X-100, 1 mM DTT, 2 µg/ml pepstatin, 0.1 mg/ml PMSF, 5 µg/ml aprotinin, 5 µg/ml leupeptin and 1 mM benzamidine) for 5 min on ice. After centrifugation, supernatant was collected as chromatin-unbound fraction, and pellet was incubated with chromatin-bound fraction buffer (100 mM NaCl, 300 mM sucrose, 10 mM PIPES, pH 6.8, 3 mM MgCl2, 1 mM EGTA, 0.5 U/µl of DNaseI and protease inhibitors) for 20 min at 37°C incubator after cold phosphate-buffered saline washing. After centrifugation, the supernatant was collected as chromatin-bound fraction.
Chromatin immunoprecipitation (ChIP)
Cells were cross-linked with 1% formaldehyde for 10 min. For PAF1 immunoprecipitation, 1.5 mM ethylene glycolbis[succinimidyl succinate] (EGS) (Pierce-Thermo Scientific, Rockford, IL, USA) in phosphate-buffered saline was pre-treated for 20 min before formaldehyde incubation. After 5 min incubation of 0.125 M glycine (final concentration), collected cells were lysed in lysis buffer I [10 mM 4-(2-Hydroxyethyl)piperazine-1-ethanesulfonic acid (HEPES), pH 6.5, 10 mM ethylenediaminetetraacetic acid (EDTA), 0.5 mM EGTA, 0.25% Triton X-100 and protease inhibitors] and then resuspended in lysis buffer II (1 mM EDTA, 0.5 mM EGTA, 10 mM HEPES, 200 mM NaCl and protease inhibitors) after centrifugation. After centrifugation, pellet was resuspended in fresh lysis buffer (20 mM Tris–Cl, pH 8.1, 0.1% SDS, 10 mM EDTA and protease inhibitors) and sonicated for 3 min at 40-amplitude using a Vibra cell™ sonicator. After centrifugation, lysate was diluted in dilution buffer (9-fold volume of lysate, 20 mM Tris–Cl, pH 8.1, 2 mM EDTA, 150 mM NaCl and 0.1% Triton X-100), and mixture was incubated with antibodies with protein A/G agarose beads (Calbiochem San Diego, CA) overnight. Beads were washed with wash buffer (0.1% SDS, 1% Triton X-100, 2 mM EDTA, pH 8.0, 150 mM NaCl, 20 mM Tris–HCl, pH 8.0) three times, and with final wash buffer (0.1% SDS, 1% Triton X-100, 2 mM EDTA, pH 8.0, 500 mM NaCl and 20 mM Tris–HCl, pH 8.0). For ChIP assay against GCN5, salt concentration was reduced in final wash buffer (0.1% SDS, 1% Triton X-100, 2 mM EDTA, pH 8.0, 300 mM NaCl and 20 mM Tris–HCl, pH 8.0). DNA was eluted in elution buffer (1% SDS and 0.1 M NaHCO3) at 65°C and incubated for overnight at 65°C after RNase A (1.0 µg/ml) addition. DNA was purified using a PCR purification kit (Nucleogen, Korea), and immunoprecipitated DNA was measured with quantitative real-time PCR with input DNA (1/20 of immunoprecipitation reaction). Primers used were listed in Supplementary Table S3. The antibodies are annotated in Supplementary Material. The locus-specific ChIP intensity (percentage to input) relative to intergenic intensity (percentage to input) was calculated and normalized to IgG negative control.
Cell migration assay
Modified Boyden chamber assay was performed as described previously (27). Cells in 0.5% FBS-containing MEM were loaded with or without IL-1β (10 ng/ml) on the upper chamber of 48-well Boyden chamber (Neuro Probe), and 8-μm pore membrane (Osmonics Inc) was sandwiched between upper and lower chamber. In all, 0.5 or 10% FBS was filled in lower chamber, and after 24 h incubation, migrated cells were stained with Diff-Quick staining solutions (Sysmex Corp.).
Statistics
Each graph shows the mean of independent experiments, and error bars indicate ± standard deviation (SD). Asterisks represent the P-value obtained from t-test. *P < 0.05, **P < 0.01, ***P < 0.001.
RESULTS
PAF1 is a negative regulator of IL-1β–inducible genes
We previously reported that the expression of PAFc components was altered in the liver of the LPS-injected mice (25). LPS is the bacterial component that induces systemic inflammation through the production of various inflammatory cytokines, such as IL-1β, TNF-α and IL-6. We also observed that both endogenous hPAF1 and exogenous mPAF1-V5 proteins, but not PAF1 transcript levels, were up-regulated after prolonged IL-1β or TNF-α stimulation in HepG2 hepatocarcinoma cells (Figure 1A and Supplementary Figure S1A–C). For dynamic regulation of gene expression during inflammation, signal-specific activators and repressors of transcription are often reported to be timely regulated by the same signal (5). Therefore, it prompts us to test whether PAFc plays any regulatory role in the IL-1β–mediated inflammatory response.
Figure 1.
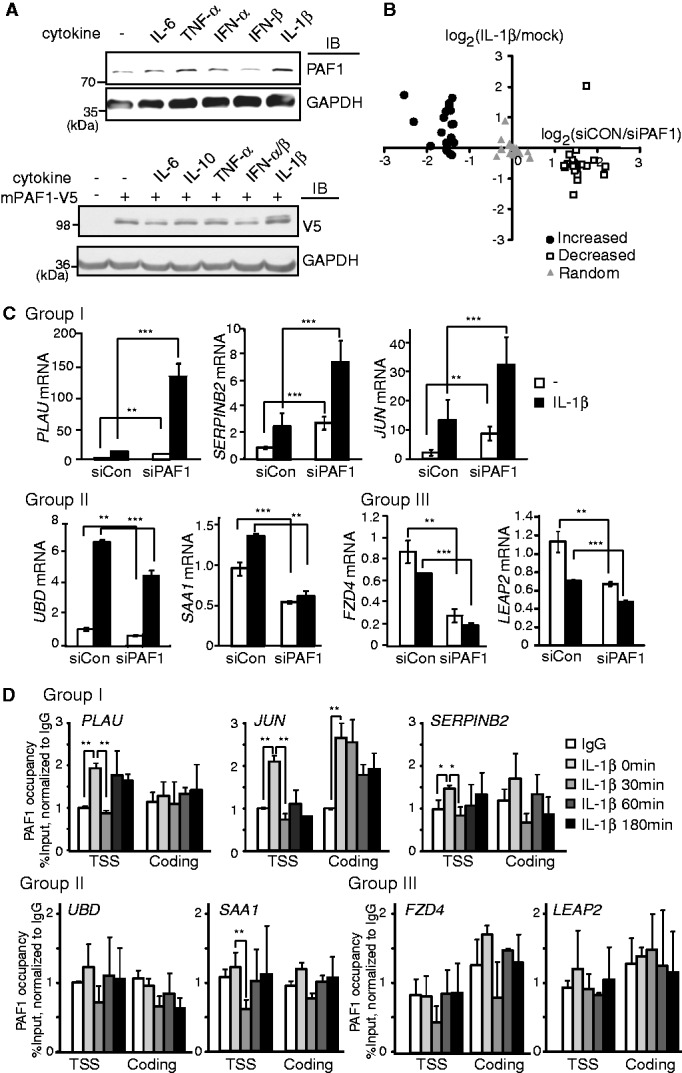
PAF1 represses IL-1β–inducible gene expression. (A) HepG2 (top) or mPAF1-V5–expressing HepG2 (bottom) cells were stimulated with IL-6+IL-6sR (10 ng/ml), TNF-α (10 ng/ml), IFN-α/β (each 100 units/ml), IL-10 (10 ng/ml) or IL-1β (10 ng/ml) for 12 h. Antibodies against PAF1 (top) or V5 (bottom) were used to examine the expression of endogenous or tagged exogenous PAF, respectively. (B) The microarray analysis was performed using control or hPAF1 shRNA-transfected HepG2 cells before and after IL-1β (10 ng/ml) stimulation. For each gene, PAF1 dependency (control shRNA/PAF1 shRNA, without stimulation) and IL-1β induction (after/before stimulation, control shRNA) were determined. The graph shows the IL-1β induction of the top 20 genes with increased (filled circles) or reduced (open squares) expression in PAF1-deficient cells. To generate a random set (gray triangles), 20 genes were randomly selected from the microarray platform. (C) qRT–PCR validation; expression of IL-1β–inducible Group I genes was increased under basal and IL-1β stimulation after PAF1 silencing. The expression of IL-1β–inducible Group II and IL-1β–repressive Group III genes was reduced after PAF1 silencing. Mean ± SD of three experiments. (D) ChIP analysis of PAF1 on Group I, II and III genes. HepG2 cells were stimulated with IL-1β (10 ng/ml) for the indicated times. The specific PAF1 occupancy at target locus relative to the intergenic region was calculated, and normalized to IgG negative control. Mean ± SD of two experiments was presented. The asterisks represent the P-values obtained from a t-test. *P < 0.05, **P < 0.01, ***P < 0.001.
To explore this possibility, genome-wide expression of IL-1β–responsive genes was measured in PAF1-deficient cells. Although PAFc has been identified as a general regulator of transcription, the expression of most transcripts was not significantly altered after PAF1 silencing under basal conditions. Moreover, similar numbers of transcripts were either enhanced or repressed after PAF1 silencing (Supplementary Figure S1D). We selected the top 20 genes that were either positively or negatively regulated by PAF1 under basal conditions and analyzed their expression levels in response to IL-1β (Figure 1B). Interestingly, we observed a significant inverse correlation between IL-1β induction and PAF1 dependency; those genes with reduced expression in PAF1-deficient cells were repressed, whereas genes with induced expression after PAF1 silencing were enhanced after IL-1β stimulation. These data indicate that PAFc might be a transcriptional repressor for the regulation of IL-1β–mediated gene expression. We classified IL-1β–responsive genes based on PAF1 dependency and validated the expression of these genes through independent qRT–PCR analysis (Figure 1C). To confirm the specificity of PAF1 silencing, different regions of PAF1 mRNA were targeted with shRNA for microarray analysis and siRNA for qRT–PCR. In the first group of genes, including PLAU, SERPINB2 and JUN, the gene expression was induced after IL-1β stimulation and further enhanced after PAF1 knockdown (Group I). In the second group of genes, including UBD and SAA1, the gene expression was similarly induced by IL-1β but reduced in PAF1-deficient cells (Group II). Moreover, the third group of genes was slightly repressed after IL-1β stimulation and PAF1 knockdown under both basal and IL-1β–stimulated conditions (Group III).
We examined the association of PAF1 with target genes in IL-1β–stimulated cells to determine whether the binding of PAF1 to DNA directly affects the expression of IL-1β–responsive genes (Figure 1D). Under basal conditions, PAF1 binding was observed at the transcription start site (TSS) of the Group I genes PLAU, SERPINB2 and JUN. On IL-1β stimulation, a transient dissociation of PAF1 was observed in the TSS region of Group I genes. Although the IL-1β–dependent dissociation of PAF1 in SERPINB2 was not strong, this dissociation was consistently observed (Supplementary Figure S1E). For Group I genes, we always observed PAF1 dissociation after IL-1β stimulation. However, the magnitude of dissociation was somewhat varied, probably reflecting the rapid kinetics of PAF1 dynamics on chromatin, which usually occurs <30 min of stimulation. Consistent with the results of the ChIP analysis, the transient release of PAF1 from the chromatin-bound fraction was observed after IL-1β stimulation (Supplementary Figure S1F). In contrast, the association of PAF1 was rarely detected in the TSS or coding regions of the second group (UBD and SAA1) and third group (FZD4 and LEAP2) of genes, and it was not changed significantly after IL-1β stimulation, suggesting that PAF1 might indirectly regulate the expression of group II or III genes.
To understand what specifies different response of Group I and Group II/III genes by PAF1, we next examined RNA Pol II occupancy at the TSS or coding regions of these genes under basal conditions (Supplementary Figure S1G). Group I genes showed a high pausing index, characterized by enriched RNA Pol II near the TSS region, relative to downstream regions, at basal state. In contrast, Group II or III genes exhibited relatively low pausing index. These data, therefore, indicate that PAF1 might affect the expression of paused versus non-paused genes differentially.
Both NF-κB activation and recruitment to target genes are not affected after PAF1 silencing
The inflammatory IL-1β signal is transmitted through the biochemical cascades of IκB kinase (IKK), p38 and c-Jun N-terminal kinases (JNK), eventually activating transcription factors, such as NF-κB and AP-1 (3). Because IL-1β–stimulated PLAU or JUN expression was altered by NF-κB (Bay 11-7082) or AP-1 (SP600125 and SB202190) inhibitors (Figure 2A), we examined whether PAF1 directly affects the transcriptional activities of NF-κB or AP-1. In PAF1-deficient cells, neither the IL-1β–induced degradation of IκB (Figure 2B) nor the NF-κB–dependent luciferase expression was altered (Figure 2C), indicating that the transcriptional activity of NF-κB was not significantly affected after PAF1 silencing. In contrast, the activation of JUN, a component of AP-1, was slightly increased after PAF1 silencing, although p38 phosphorylation was not affected (Figure 2D and E). In addition, the increased AP-1–dependent luciferase expression might reflect enhanced JUN expression (Figure 1C).
Figure 2.
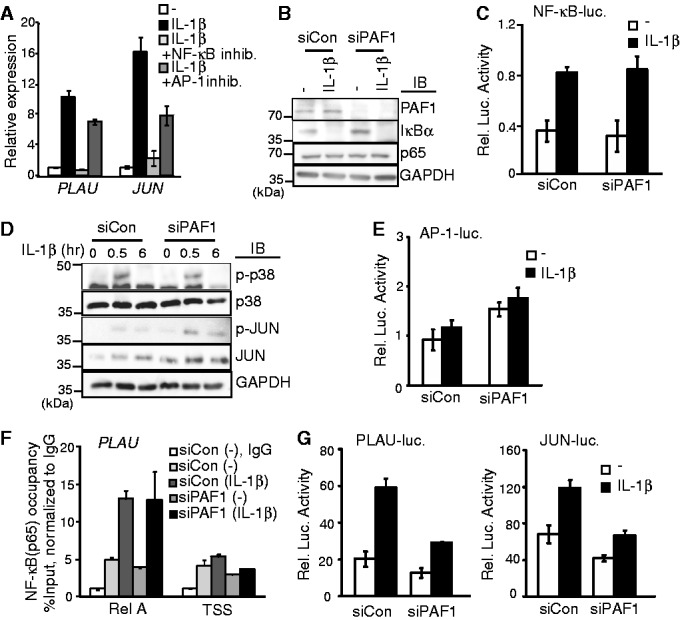
PAF1 does not affect NF-κB activation and recruitment to target genes. (A) HepG2 cells were pretreated with an NF-κB inhibitor (BAY 11-7082; 10 µM) or AP1 inhibitors (SP600125 and SB202190; each 10 µM) for 30 min before IL-1β stimulation. qRT–PCR was performed to measure the relative mRNA levels of PLAU and JUN. (B and D) Control or PAF1 siRNA-transfected HepG2 cells were stimulated with IL-1β for 0 or 30 min (B) or as indicated (D), and the protein levels of PAF1, IκB-α and p65 (B) or phsopho-p38, p38, phospho-JUN and JUN (D) were determined using western blot analysis. (C and E) HepG2 cells were co-transfected with NF-κB-luc (C) or AP-1-luc (E) reporter constructs along with control or PAF1 siRNA. The luciferase activity was measured under basal (open) or IL-1β–stimulated (filled) conditions. (F) ChIP analysis of p65 binding on the NF-κB binding site of promoter region or TSS of PLAU gene. IL-1β was stimulated for 0 or 30 min. NF-κB occupancy values are presented relative to the IgG signal after normalization to the intergenic region. (G) Luciferase assay using reporter constructs containing a PLAU promoter (PLAU-luc) or JUN promoter (JUN-luc) in control or PAF1 siRNA-transfected cells. Bars indicate averages of values from three (A, C, E and G) or two (F) experiments; error bars represent SD.
We subsequently examined whether PAF1 regulates the association of NF-κB with the promoter of a target gene (Figure 2F). The activating component of NF-κB, p65 was specifically recruited to the promoter of PLAU gene after IL-1β stimulation, but the physical association of p65 with chromatin was not affected in PAF1-deficient cells. We also measured the luciferase activity of reporter constructs containing the endogenous promoters of either PLAU or JUN to determine the effect of PAF1 on IL-1β–mediated promoter activation. Although the expression of PLAU or JUN was significantly increased after PAF1 silencing (Figure 1C), both the basal and the IL-1β–induced promoter activity of PLAU or JUN were not enhanced (Figure 2G). Together these results suggest that PAF1 controls the expression of Group I genes in transcriptional processes rather than the promoter activation step.
PAF1 blocks productive elongation of paused genes through the inhibition of histone acetylation before signal activation
We examined occupancy of phosphorylated RNA Pol II after IL-1β stimulation in PAF1-deficient cells. The binding of phosphorylated RNA Pol II to target genes was measured in a ChIP assay using antibodies specific to phosphoserine at the fifth (Ser5-P) or second (Ser2-P) position of C-terminal domain (CTD) heptads. The recruitment of the Ser5-P RNA Pol II occurred predominantly near the TSS of the PLAU gene after IL-1β stimulation, which was slightly increased after PAF1 silencing (Figure 3A and B). In addition, the IL-1β–dependent recruitment of Ser2-P RNA Pol II at both the TSS and coding region of the PLAU gene was significantly enhanced after PAF1 silencing, suggesting that PAF1 functions as an inhibitor that blocks the productive elongation step of transcription (Figure 3C). It has been previously reported that global protein levels of Ser2-P RNA Pol II are affected after the depletion of the PAF complex in yeast (28); therefore, we examined the effect of PAF1 knockdown on Ser2-P RNA Pol II expression. The expression of Ser2-P RNA Pol II, but not total RNA Pol II, was reduced in the lysates of PAF1-silenced HepG2 cells (Supplementary Figure S2A). Therefore, the enhanced Ser2-P RNA Pol II occupancy at the PLAU locus after PAF1 silencing was not general event, but might reflect a regulated event that occurs at limited loci.
Figure 3.
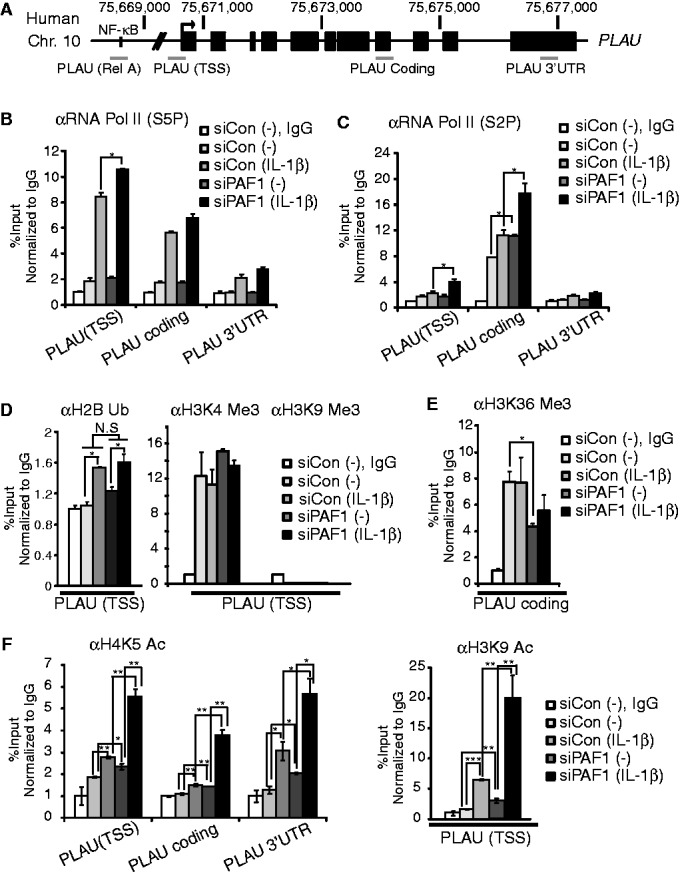
PAF1 deficiency enhances RNA polymerase II progression and histone acetylation at the PLAU locus. (A) Schematic illustration of the PLAU locus and the ChIP primers used in this article. (B–F) ChIP analysis of RNA Pol II with phosphoserine 5 on CTD (B), RNA Pol II with phosphoserine 2 on CTD (C), H2B ubiquitination, H3K4 trimethylation or H3K9 trimethylation (D), H3K36 trimethylation (E) and H4K5 acetylation or H3K9 acetylation (F). HepG2 cells were transfected with control or PAF1 siRNA and stimulated with IL-1β (10 ng/ml) for 0 or 30 min. The PCR amplification was performed using ChIP primers as indicated. The specific ChIP signal at the target locus relative to the intergenic region was calculated and normalized to an IgG negative control. Mean ± SD of two experiments was presented.
PAFc is required for Rad6/Bre1-dependent H2B ubiquitination and subsequent H3K4 trimethylation for gene activation (12,14,29,30). Therefore, we next examined the effect of PAF1 on the modification of histones surrounding the PLAU genomic locus. Although enhanced recruitment of H2B ubiquitination was observed after IL-1β stimulation, it was not significantly changed by PAF1 silencing, near the PLAU locus (Figure 3D). H3K4 trimethylation, which was reduced after Ash2L silencing, a component of human myeloid/lymphoid or mixed lineage leukemia (MLL) histone methyltransferase, was constitutively observed at the TSS of PLAU under basal condition (Figure 3D and Supplementary Figure S2B). However, PAF1 silencing did not affect H3K4 trimethylation, neither. In contrast, H3K4 trimethylation at the TSS of the Group II genes, such as SAA1 or UBD, or haptoglobin (HP), which was affected by CTR9 knockdown (25), was significantly downregulated after PAF1 silencing (Supplementary Figure S2C). PAFc is also reported to involve in the recruitment of SET2 for H3K36 methylation to the coding regions of actively transcribed target genes (11,13). However, H3K36 trimethylation surrounding the coding region of the PLAU gene were not significantly altered by IL-1β stimulation, although it was slightly reduced after PAF1 silencing (Figure 3E). Although many studies demonstrated that H3K36 methylation is coupled to transcription activation, transcription repression and histone deacetylation mediated by H3K36 methylation have been also reported (31). Therefore, the reduction of H3K36 methylation could partially contribute to PAF1-mediated repression. Nonetheless, these alternations on histone modification cannot explain the inhibitory effect of PAF1 completely.
Therefore, we next assessed the effect of PAF1 on the regulation of histone acetylation. In response to IL-1β, we observed increased acetylation at the H3K9 and H4K5 residues surrounding the TSS and coding regions of the PLAU gene (Figure 3F). More importantly, both acetylated H3K9 and H4K5 residues were increased after IL-1β stimulation in PAF1-deficient cells. The occupancy of the acetylated histone near the PAF1 target genes was inversely correlated with the PAF1 presence, suggesting that PAF1 might negatively influence on the histone acetylation and thereby regulate transcription at IL-1β–responsive target gene loci.
Enzymatic activity of GCN5 is required to discharge PAF1 from target loci for IL-1β–inducible gene expression
To characterize the PAF1-mediated regulation of histones acetylation, we identified the HAT that controls IL-1β–inducible PLAU expression. For this purpose, various HATs, including GCN5, p300, MOZ, Ybf2/ Sas3, Sas2 and Tip60 (MYST2), K(lysine) acetyltransferase 5 (KAT5), activating transcription factor 2 (ATF2), nuclear receptor coactivator 1 (NCOA1) and HAT1, were silenced through the transfection of the appropriate siRNAs, and the expression of PLAU was assessed (Figure 4A and Supplementary Figure S3A). Among the HATs tested, GCN5 and NCOA1 exerted significant effects on IL-1β–inducible PLAU gene expression. Because GCN5 acts as an activator and NCOA1 functions as a repressor, we focused on the functional interaction between GCN5 and PAF1 during IL-1β–induced PLAU gene expression. The contribution of GCN5 during IL-1β–inducible PLAU gene expression was determined using MB-3, a catalytic inhibitor of GCN5 (Figure 4B). To confirm the function of GCN5 in histone acetylation near the PLAU locus, IL-1β–dependent changes in histone acetylation were measured in GCN5-deficient cells (Figure 4C). The IL-1β–induced acetylation of H4K5 and H3K9 near the TSS of the PLAU locus was significantly reduced after GCN5 silencing, confirming the GCN5-mediated regulation of IL-1β–dependent PLAU gene expression via histone acetylation.
Figure 4.

PAF1 and GCN5 HAT counteract during IL-1β–responsive PLAU gene expression. (A) Specific siRNAs for GCN5, p300, MYST2, KAT5, ATF2, NCOA1, HAT1 or control siRNA were transfected, and IL-1β was stimulated for 0 or 1 h. qRT–PCR analysis of PLAU mRNA. (B) qRT–PCR of PLAU mRNA; HepG2 cells were pretreated with MB-3 (0.1 or 0.2 mM) for 24 h before IL-1β stimulation. (C) After control or GCN5 siRNA transfection, cells were stimulated with IL-1β for 0 or 30 min. Histone acetylation on H4K5 (left) or H3K9 (right) was measured using ChIP analysis at the PLAU TSS. (D) ChIP analysis of GCN5 on the PLAU genomic locus after IL-1β stimulation. (E) HepG2 cells were transfected with control or GCN5 siRNA and stimulated with IL-1β for 0 or 30 min. PAF1 ChIP was performed for PAF1 protein, and the abundance of PAF1 at the PLAU TSS was measured using qPCR. (F) HepG2 cells were pre-treated with MB-3 (0.2 mM) for 24 h and stimulated with IL-1β for 30 min. ChIP analysis was performed for PAF1 at the TSS of the PLAU gene. (G) After control or PAF1 siRNA transfection, HepG2 cells were stimulated with IL-1β for 0 or 30 min. GCN5 abundance on the TSS region of the PLAU gene was measured using ChIP analysis. (H) HepG2 cells were pre-treated with BAY11-7082 (10 µM) or with SP600125 and SB202190 (10 µM) for 30 min before IL-1β stimulation (30 min). PAF1 and GCN5 abundance on the TSS of the PLAU gene was measured using ChIP analysis. (C-H) PAF1 or GCN5 occupancy levels are presented relative to the IgG signal after normalization to the intergenic region. ‘N.S’ indicates not significant. Bars indicate averages of values from three (A and B) or two (C–H) experiments; error bars represent SD.
Next, we assessed the genomic occupancy of GCN5 in response to IL-1β at the PLAU genomic locus (Figure 4D). In contrast to the IL-1β–dependent dissociation and re-association of PAF1 on the PLAU gene (Figure 1D), GCN5 was specifically recruited to both the TSS and coding regions of the PLAU genomic locus in response to IL-1β stimulation. The PAF1 occupancy was also examined after GCN5 knockdown (Figure 4E). When GCN5 was depleted, the IL-1β–dependent dissociation of PAF1 from the PLAU locus ceased. Furthermore, with MB-3 pre-treatment, the IL-1β–induced dissociation of PAF1 from the PLAU locus (Figure 4F) and the IL-1β–induced release of PAF1 from the chromatin-bound fraction were similarly blocked (Supplementary Figure S3B). These data indicate that the expression of GCN5 and/or enzymatic activity is required to discharge PAF1 from the PLAU locus.
Next, we examined the role of PAF1 in the recruitment of GCN5. Under PAF1 knockdown conditions, GCN5 bound the TSS region of the PLAU gene before IL-1β stimulation, and this occupancy pattern did not change after further stimulation (Figure 4G). Therefore, PAF1 might prevent GCN5 recruitment to target loci in the absence of the proper signal for transcriptional activation and should be released from target loci to initiate signal-dependent transcription. To ascertain how IL-1β–mediated signaling activity is responsible for PAF1 and GCN5 dynamics at the PLAU locus; inhibitors of NF-κB or AP-1 were applied before IL-1β stimulation; and the occupancies of PAF1 and GCN5 were compared. Both inhibitors simultaneously abolished the recruitment of GCN5 to the PLAU locus and the IL-1β–dependent dissociation of PAF1 (Figure 4H).
Because all experiments were conducted using HepG2 cells, we examined whether the role of PAF1 and GCN5 in IL-1β–inducible gene expression could be observed in other cell types. We examined the effect of PAF1 or GCN5 silencing on PLAU and JUN expression and PAF1 occupancy after IL-1β stimulation using HEK293FT cells (Supplementary Figure S4). As observed in HepG2 cells, the expression of both PLAU and JUN was increased after PAF1 silencing and reduced after GCN5 silencing (Supplementary Figure S4A and B). Furthermore, PAF1 was dissociated from the TSS of the PLAU and JUN loci after IL-1β stimulation (Supplementary Figure S4C). Taken together, these data suggest that IL-1β–mediated signaling activity is required to recruit GCN5, which in turn discharges pre-occupied PAF1 from the PLAU locus to activate transcription.
The internal 70 amino acids residues of PAF1 mediate chromatin binding and are essential to repress PLAU expression
We also explored the functional domain of PAF1 responsible for IL-1β–mediated PLAU gene regulation. Mammalian PAF1 contains an N-terminal domain with yPaf1 homology and C-terminal Glu- and Ser-rich domains (32) (Figure 5A). An internal nuclear localization signal (NLS) was predicted (32), and its function was verified using a mutant form of mPAF1 in transfected cells (Supplementary Figure S5A). Full-length mPAF1 localized to the nucleus, whereas the ΔNLS mutant was cytoplasmic. We, therefore, examined whether the nuclear localization of PAF1 was required to elicit IL-1β–inducible PLAU repression. We first determined whether the overexpression of exogenous PAF1 elicits a repressive effect on PLAU gene expression. For this purpose, an mPAF1 expression vector was co-transfected with control or hPAF1 siRNA. In cells with endogenous PAF1, the overexpression of mPAF1 did not significantly affect PLAU gene expression. However, when endogenous PAF1 was depleted via hPAF1 silencing, a repressive effect of exogenous mPAF1 was observed (Supplementary Figure S5B). Under endogenous PAF1-silencing conditions, the expression of full-length mPAF1, but not the mPAF1–ΔNLS mutant, rescued the loss of endogenous PAF1, suggesting that nuclear retention is important for the regulatory function of PAF1 (Figure 5B).
Figure 5.

The internal 70 amino acids residues of PAF1 mediate chromatin association and the transcriptional repression of the PLAU gene. (A) Schematic diagram of the secondary structure of full-length and mutant PAF1, predicted using the Jpred3 program. A cylinder indicates the predicted α-helix, an arrow represents the β-sheet and the bars represent the coiled-coil secondary structure. (B) Left, control or hPAF1 siRNA was transfected along with empty vector, full length or deleted forms of MYC-tagged mPAF1 as indicated. Cells were stimulated with IL-1β for 0 (open bar) or 1 h (filled bar). qRT–PCR for PLAU mRNA. Right, western blot analysis of endogenous hPAF1 (asterisk) and exogenous MYC-tagged mPAF1 constructs. (C and D) Control or hPAF1 siRNA was transfected with empty vector, PAF1 C-terminal (C) or N-terminal deletion mutants. (D) Top, qRT-PCR of PLAU mRNA. Bottom, western blot analysis of endogenous hPAF1 and exogenous mPAF1(MYC). (E) Control or hPAF1 siRNA was transfected along with empty vector, mPAF1 (Δ213–254)-MYC or mPAF1 (Δ285–355)-MYC. Top, qRT–PCR of PLAU mRNA. Bottom, western blot analysis. (F) HepG2 cells were transfected with empty vector, full-length mPAF1-MYC, mPAF1 (Δ213–254)-MYC or mPAF1 (Δ285–355)-MYC and subsequently fractionated into chromatin-bound and chromatin-unbound fractions for western blot analysis. Asterisks indicate endogenous PAF1 proteins. Arrowheads indicate MYC-tagged PAF1 proteins. Chromatin-bound or chromatin-unbound fractions were quantitated and calculated relative to total proteins using Multi-Gauge V3.1 (Fuji Film). (B–E) Bars indicate averages of data from three experiments; error bars represent standard deviation. ‘N.S.’ indicates not significant (P > 0.05).
To identify the functional domain of PAF1 for PLAU repression, we generated a series of C- or N-terminal deletion constructs (Figure 5A) and assessed the effects of these mutations on transcriptional regulation in endogenous PAF1-deficient cells (Figure 5C and D). The overexpression of the C-terminal deletion mutants C1 or C2 and the N-terminal deletion mutants N1 or N2 was sufficient to repress IL-1β–induced PLAU gene expression. The repression level was comparable with that observed with the full-length PAF1 protein, indicating that an internal PAF1 domain spanning 213–355 amino acids is responsible for transcriptional repression. Therefore, we further generated two additional constructs containing the NLS but lacking half of the internal domain, mPAF1 (Δ213–254) and mPAF1 (Δ285–355). The overexpression of mPAF1 (Δ285–355) but not mPAF1 (Δ213–254) failed to rescue loss of endogenous PAF1 (Figure 5E), although this mutant localized to the nucleus (Supplementary Figure S5C).
To understand the PAF1-mediated repression of PLAU gene expression, we next investigated the chromatin-binding ability of the mutant mPAF1 (Δ285–355) under basal conditions. Total cell lysates were fractionated into chromatin-bound and chromatin-unbound fractions, and the expression of PAF1 was assessed in both fractions. The overexpressed MYC-tagged full-length mPAF1 was primarily observed in the chromatin-bound fraction (Figure 5F). However, MYC-tagged mPAF1 exhibited a lower affinity for chromatin compared with endogenous PAF1 (Supplementary Figure S5D). It is possible that tagging might hinder chromatin association or protein interactions, which partially explains the incomplete rescue of PAF1 depletion using MYC-tagged PAF1 (Figure 5B). In contrast to full-length mPAF1 or mPAF1 (Δ213–254), which were primarily observed in the chromatin-bound fraction, PAF1 (Δ285–355) was detected in the chromatin unbound fraction (Figure 5F and Supplementary Figure S5D). These data indicate that the 70 amino acids internal domain of PAF1, spanning residues 285–355, is essential for mediating chromatin binding and the repression of the IL-1β–inducible target gene expression.
The PAFc was disassociated from the TSS of PAF1 target genes under IL-1β stimulation
It has been previously reported that the components of the human PAFc are tightly associated and function as a complex (33). However, other studies have suggested an independent biochemical role for individual members of the PAFc (24,34,35). Therefore, we examined whether the PAF1-mediated regulation of IL-1β–inducible gene expression depends strictly on PAF1 alone or requires complete PAFc activity. First, when individual components of the PAFc were silenced, a repressive effect on PLAU gene was generally observed, but with some differences (Figure 6A and Supplementary Figure S6A–B). PAF1 silencing increased both basal and IL-1β–stimulated PLAU gene induction, whereas CTR9, LEO1 or SKI8 silencing only affected signal-mediated gene induction. We then investigate whether the presence of other components of the PAFc could rescue the silencing effect of endogenous PAF1 on PLAU gene expression (Figure 6B and Supplementary Figure S6C). However, none of the other PAFc components rescued the PAF1 silencing effect on IL-1β–induced PLAU gene expression.
Figure 6.
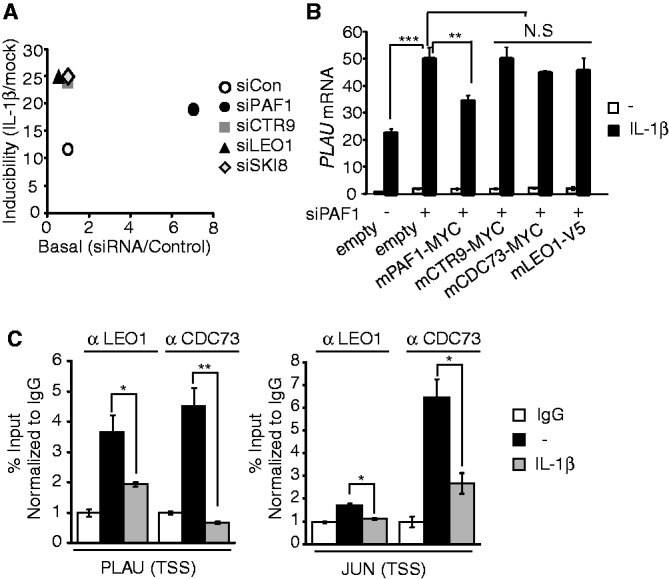
PAFc-associated PAF1 represses IL-1β–inducible genes. (A) Using data from Supplementary Figure S6B, the knockdown effect of individual PAFc components to IL-1β inducibility (y-axis, relative ratio of PLAU mRNA with IL-1β to without IL-1β) and basal expression (x-axis, relative ratio of PLAU mRNA with PAFc siRNA to control siRNA without IL-1β) are shown. (B) HepG2 cells were co-transfected with control or hPAF1 siRNA along with empty vector or indicated mPAFc expression vectors, and qRT–PCR for PLAU mRNA was performed. Bar indicates averages of data from three experiments; error bars represent SD. (C) ChIP analysis of CDC73 (as also known as parafibromin) and LEO1. HepG2 cells were stimulated with IL-1β (10 ng/ml) for 0 or 30 min. The specific protein occupancy at the target locus relative to the intergenic region was calculated and normalized to the IgG control. Bar indicates averages of data from two experiments; error bars represent standard deviation. ‘N.S.’ indicates not significant (P > 0.05).
We also examined whether PAF1 bound to target genes with other components as a complex. For this purpose, we assessed the occupancies of the other PAFc components, LEO1 and CDC73, at Group I genes (Figure 6C). Similar to PAF1, both LEO1 and CDC73 bound near the TSS of PLAU or JUN gene under basal conditions and were transiently dissociated after IL-1β stimulation. Therefore, we next asked whether the physical interaction with other component is required for the repressive effect of PAF1 on target gene expression. Among the mPAF1 mutants that exhibited normal PLAU gene repression (Figure 5D), mPAF1-N2 mutant failed to interact with CTR9 (Supplementary Figure S6D). These results indicate that the strong association of complex formation might not be essential to elicit PAF1-mediated target gene repression.
GCN5 counteracts repressive PAF1 to induce IL-1β–mediated cell migration
The pro-inflammatory cytokine IL-1β controls the expression of metalloprotease or plasminogen activators to induce the migration of airway epithelial, immune and hepatostellate cells (36–39). Including PLAU, several genes that were repressed by PAF1 in the microarray analysis have been implicated in cell migration (Supplementary Table S4). Therefore, we investigated whether PAF1 directly controls IL-1β–mediated cell migration using the Boyden chamber assay. When serum was used as a chemoattractant (27), treating HepG2 cells with IL-1β increased cell migration (Supplementary Figure S7). Under basal conditions, cell migration was significantly increased after PAF1 silencing and further enhanced after IL-1β stimulation, indicating that PAF1 plays an inhibitory role in cell migration (Figure 7A). The overexpression of mPAF1 partially blocked the effect of PAF1 silencing on cell migration (Figure 7B). As previously observed (Figure 5), incomplete rescue of tagged mPAF1 might be partly because of hindered chromatin association. We also examined whether GCN5 is involved in IL-1β–mediated cell migration. As predicted from the positive effect of GCN5 on IL-1β–inducible gene expression, GCN5 acted as an activator of cell migration; both GCN5 silencing and MB-3 treatment exhibited similar inhibitory effects on IL-1β–mediated cell migration (Figure 7C and D). Altogether, these data suggest that functional counteractions between PAF1 and GCN5 play a role in the regulation of IL-1β–responsive gene induction and cell migration under inflammatory conditions.
Figure 7.
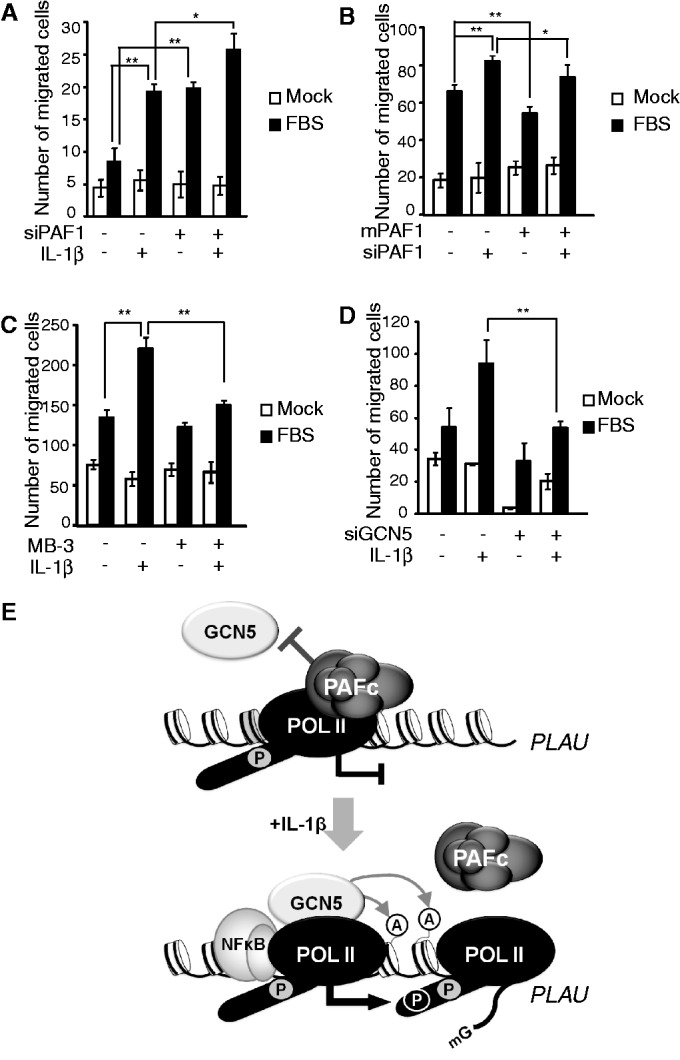
The counteraction between PAF1 and GCN5 controls the IL-1β–induced migration of HepG2 cells. (A–D) HepG2 cells with or without IL-1β stimulation were loaded onto the upper chamber, and cell migration towards the FBS-containing lower chamber during 24 h was determined using Diff-Quick staining. Three independent wells of a Boyden chamber were used to count the migrating cells. (A) Cells transfected with control or PAF1 siRNA were analyzed using a Boyden chamber assay. (B) Cells were co-transfected with control or PAF1 siRNA and empty vector or mPAF1 expression vector, and cell migration was determined without IL-1β stimulation. (C) HepG2 cells were pre-treated with MB-3 for 24 h, and cell migration was determined with or without IL-1β stimulation. (D) Cells transfected with control or GCN5 siRNA were analyzed using a Boyden chamber assay. (A–D) Mean ± SD of three experiments was presented. (E) A proposed model of PAF1-mediated gene repression. Without stimulation, chromatin-bound PAFc blocks the recruitment of GCN5 and represses RNA Pol II paused gene expression. Upon IL-1β stimulation, the GCN5-dependent acetylation of histones releases PAFc from chromatin and facilitates continued productive transcription.
DISCUSSION
In the present study, we demonstrated the repressive activity of PAF1 in transcription during the inflammatory response. Under basal conditions, chromatin-bound PAFc associates with the paused RNA Pol II and blocks the recruitment of GCN5 HAT to the target locus, thereby repressing inappropriate transcription. On IL-1β stimulation, PAFc is dissociated from the target locus, which is dependent on the enzymatic activity of the recruited GCN5, and RNA Pol II proceeds for productive transcription (Figure 7E). Although most PAF1 was associated with chromatin under basal conditions, the GCN5-dependent dissociation of PAF1 occurred only at limited region (Supplementary Figure S1F and S3B); hence, PAF1-mediated IL-1β–responsive transcriptional regulation is limited to a subset of target genes, such as paused PLAU or JUN.
The regulatory role of PAFc in the activation of transcription has been extensively studied after the RNA Pol II-associated factor was identified [review in detail, (11)]. In contrast, the role of PAFc in transcriptional repression has only been recently reported (15,16,40), and the regulatory mechanism underlying this function has not been fully elucidated. Generally, repressors either compete with transcriptional activators for direct binding to DNA elements or sequester transcriptional activators from transcription activating complexes (41). Repressors might also alter the chromatin structure surrounding target genes via the regulation of chromatin modifying enzymes (41). Interestingly, it has been suggested that PAFc represses gene expression via the modification of histone methylation, such as H3K9 methylation or H2B ubiquitination followed by H3K4 trimethylation (15,16,40). In Saccharomyces cerevisiae, paused RNA Pol II associated with PAF1 represses heat inducible FK506 sensitivity protein 2 (FKS2) expression under basal conditions through interaction with the Sen1-Nrd1-Nab3 transcription termination complex (42). On stimulation, recruited PAF1 interacts with stress-induced Mpk1 mitogen-activated protein kinase (MAPK) and blocks the recruitment of the Sen1 complex to RNA Pol II, thereby activating transcription (42). In contrast, we demonstrated a counteraction between the HAT GCN5 and PAF1 in the repression of paused IL-1β–inducible genes. We showed that under basal conditions, PAF1 binds target genes and blocks the recruitment of GCN5, which transfers an acetyl group to H3K9 or H4K5 residues on surrounding chromatin. After IL-1β stimulation, chromatin-bound PAF1 is transiently dissociated from the target locus, facilitating continued productive transcription.
In HepG2 cells, the majority of PAF1 was detected in the chromatin-bound fraction. Relatively small amounts of PAF1 dissociated from the chromatin region after IL-1β stimulation in a manner that depended on the enzymatic activity of GCN5 (Figure 4F and Supplementary Figure S3B). This finding suggests that the dynamics of PAF1 on chromatin might be a key regulatory step for transcriptional regulation. Recently, the direct interaction between PAF1 and histone proteins was demonstrated in vitro and in vivo (24,43). Binding between PAF1 and histone proteins was not significantly altered after H3K4 methylation, but acetylated histones did not interact with PAF1 protein (24). Based on the weak interaction of acetylated histone with PAF1 (Supplementary Figure S8), GCN5-mediated histone acetylation might disrupt the association of PAF1 with chromatin; it is possible that IL-1β–stimulated NF-κB binds to the promoter region of the target gene and recruits GCN5 (9), which subsequently acetylates nearby histones and reduces the binding affinity of PAF1 for chromatin. We ruled out the possibility of IL-1β–dependent GCN5-mediated PAF1 acetylation for chromatin association, as no significant change was observed in the degree of mPAF1 acetylation after IL-1β stimulation (Supplementary Figure S9).
Interestingly, recent evidence suggests a regulatory role for PAFc in carcinogenesis. Mutated parafibromin has been associated with parathyroid jaw tumors (44), and the amplification of the PAF1 gene has been observed in pancreatic cancers (23). In the present study, we demonstrated that PAF1 represses IL-1β–mediated cell migration (Figure 7), which plays an important role during inflammation and cancer progression. Although the genetic amplification or overexpression of PAF1 is often involved in cell proliferation (32), the simultaneous downregulation of PAF1 expression and upregulation of PLAU expression was observed in breast or colon cancer samples (http://www.oncomine.org) (Supplementary Figure S10). Based on the molecular and cellular function of PAF1 in IL-1β–mediated gene expression and cell migration, we, therefore, propose that PAF1 might play a role in inflammation and metastasis during cancer development. The detailed mechanisms underlying the contribution of PAF1 to carcinogenesis, particularly in metastasis via the regulation of inflammation, should be further investigated.
SUPPLEMENTARY DATA
Supplementary Data are available at NAR Online: Supplementary Tables 1–4, Supplementary Figures 1–10, Supplementary Methods and Supplementary References [45–50].
FUNDING
National Research Foundation of Korea funded by the Ministry of Education, Science and Technology [NO. 2012R1A2A2A01007525 to J.Y.Y., KRF-2008-313-C00604 to J.Y.Y.]; T.J. Park Doctoral Fellowship (to N.K.). Funding for open access charge: National Research Foundation of Korea funded by the Ministry of Education, Science and Technology.
Conflict of interest statement. None declared.
Supplementary Material
ACKNOWLEDGEMENTS
The authors thank Mr J. Kim and Dr D. Hwang of Microarray Facility for the technical support.
REFERENCES
- 1.Medzhitov R. Origin and physiological roles of inflammation. Nature. 2008;454:428–435. doi: 10.1038/nature07201. [DOI] [PubMed] [Google Scholar]
- 2.Dinarello CA. A clinical perspective of IL-1beta as the gatekeeper of inflammation. Eur. J. Immunol. 2011;41:1203–1217. doi: 10.1002/eji.201141550. [DOI] [PubMed] [Google Scholar]
- 3.Dinarello CA. Biologic basis for interleukin-1 in disease. Blood. 1996;87:2095–2147. [PubMed] [Google Scholar]
- 4.Hao S, Baltimore D. The stability of mRNA influences the temporal order of the induction of genes encoding inflammatory molecules. Nat. Immunol. 2009;10:281–288. doi: 10.1038/ni.1699. [DOI] [PMC free article] [PubMed] [Google Scholar]
- 5.Medzhitov R, Horng T. Transcriptional control of the inflammatory response. Nat. Rev. Immunol. 2009;9:692–703. doi: 10.1038/nri2634. [DOI] [PubMed] [Google Scholar]
- 6.Smale ST. Selective transcription in response to an inflammatory stimulus. Cell. 2010;140:833–844. doi: 10.1016/j.cell.2010.01.037. [DOI] [PMC free article] [PubMed] [Google Scholar]
- 7.Dunne A, O'Neill LA. The interleukin-1 receptor/Toll-like receptor superfamily: signal transduction during inflammation and host defense. Science's STKE. 2003;2003:re3. doi: 10.1126/stke.2003.171.re3. [DOI] [PubMed] [Google Scholar]
- 8.Persichini T, Maio N, di Patti MC, Rizzo G, Colasanti M, Musci G. Interleukin-1beta induces ceruloplasmin and ferroportin-1 gene expression via MAP kinases and C/EBPbeta, AP-1, and NF-kappaB activation. Neurosci. Lett. 2010;484:133–138. doi: 10.1016/j.neulet.2010.08.034. [DOI] [PubMed] [Google Scholar]
- 9.Hargreaves DC, Horng T, Medzhitov R. Control of inducible gene expression by signal-dependent transcriptional elongation. Cell. 2009;138:129–145. doi: 10.1016/j.cell.2009.05.047. [DOI] [PMC free article] [PubMed] [Google Scholar]
- 10.Shi XM, Chang MP, Wolf AJ, Chang CH, FrazerAbel AA, Wade PA, Burton ZF, Jaehning JA. Cdc73p and Paf1p are found in a novel RNA polymerase II-containing complex distinct from the Srbp-containing holoenzyme. Mol. Cell. Biol. 1997;17:1160–1169. doi: 10.1128/mcb.17.3.1160. [DOI] [PMC free article] [PubMed] [Google Scholar]
- 11.Jaehning JA. The Paf1 complex: platform or player in RNA polymerase II transcription? Biochim. Biophys. Acta. 2010;1799:379–388. doi: 10.1016/j.bbagrm.2010.01.001. [DOI] [PMC free article] [PubMed] [Google Scholar]
- 12.Krogan NJ, Dover J, Wood A, Schneider J, Heidt J, Boateng MA, Dean K, Ryan OW, Golshani A, Johnston M, et al. The Paf1 complex is required for histone H3 methylation by COMPASS and Dot1p: linking transcriptional elongation to histone methylation. Mol. Cell. 2003;11:721–729. doi: 10.1016/s1097-2765(03)00091-1. [DOI] [PubMed] [Google Scholar]
- 13.Krogan NJ, Kim M, Tong A, Golshani A, Cagney G, Canadien V, Richards DP, Beattie BK, Emili A, Boone C, et al. Methylation of histone H3 by Set2 in Saccharomyces cerevisiae is linked to transcriptional elongation by RNA polymerase II. Mol. Cell. Biol. 2003;23:4207–4218. doi: 10.1128/MCB.23.12.4207-4218.2003. [DOI] [PMC free article] [PubMed] [Google Scholar]
- 14.Ng HH, Robert F, Young RA, Struhl K. Targeted recruitment of Set1 histone methylase by elongating Pol II provides a localized mark and memory of recent transcriptional activity. Mol. Cell. 2003;11:709–719. doi: 10.1016/s1097-2765(03)00092-3. [DOI] [PubMed] [Google Scholar]
- 15.Yang YJ, Han JW, Youn HD, Cho EJ. The tumor suppressor, parafibromin, mediates histone H3 K9 methylation for cyclin D1 repression. Nucleic Acids Res. 2010;38:382–390. doi: 10.1093/nar/gkp991. [DOI] [PMC free article] [PubMed] [Google Scholar]
- 16.Crisucci EM, Arndt KM. Paf1 restricts Gcn4 occupancy and antisense transcription at the ARG1 promoter. Mol. Cell. Biol. 2012;32:1150–1163. doi: 10.1128/MCB.06262-11. [DOI] [PMC free article] [PubMed] [Google Scholar]
- 17.Chu Y, Simic R, Warner MH, Arndt KM, Prelich G. Regulation of histone modification and cryptic transcription by the Bur1 and Paf1 complexes. EMBO J. 2007;26:4646–4656. doi: 10.1038/sj.emboj.7601887. [DOI] [PMC free article] [PubMed] [Google Scholar]
- 18.Mosimann C, Hausmann G, Basler K. Parafibromin/Hyrax activates Wnt/Wg target gene transcription by direct association with beta-catenin/Armadillo. Cell. 2006;125:327–341. doi: 10.1016/j.cell.2006.01.053. [DOI] [PubMed] [Google Scholar]
- 19.Moniaux N, Nemos C, Deb S, Zhu B, Dornreiter I, Hollingsworth MA, Batra SK. The human RNA polymerase II-associated factor 1 (hPaf1): a new regulator of cell-cycle progression. PloS One. 2009;4:e7077. doi: 10.1371/journal.pone.0007077. [DOI] [PMC free article] [PubMed] [Google Scholar]
- 20.Tenney K, Gerber M, Ilvarsonn A, Schneider J, Gause M, Dorsett D, Eissenberg JC, Shilatifard A. Drosophila Rtf1 functions in histone methylation, gene expression, and Notch signaling. Proc. Natl Acad. Sci. USA. 2006;103:11970–11974. doi: 10.1073/pnas.0603620103. [DOI] [PMC free article] [PubMed] [Google Scholar]
- 21.Wang P, Bowl MR, Bender S, Peng J, Farber L, Chen J, Ali A, Zhang Z, Alberts AS, Thakker RV, et al. Parafibromin, a component of the human PAF complex, regulates growth factors and is required for embryonic development and survival in adult mice. Mol. Cell. Biol. 2008;28:2930–2940. doi: 10.1128/MCB.00654-07. [DOI] [PMC free article] [PubMed] [Google Scholar]
- 22.Woodard GE, Lin L, Zhang JH, Agarwal SK, Marx SJ, Simonds WF. Parafibromin, product of the hyperparathyroidism-jaw tumor syndrome gene HRPT2, regulates cyclin D1/PRAD1 expression. Oncogene. 2005;24:1272–1276. doi: 10.1038/sj.onc.1208274. [DOI] [PubMed] [Google Scholar]
- 23.Chaudhary K, Deb S, Moniaux N, Ponnusamy MP, Batra SK. Human RNA polymerase II-associated factor complex: dysregulation in cancer. Oncogene. 2007;26:7499–7507. doi: 10.1038/sj.onc.1210582. [DOI] [PubMed] [Google Scholar]
- 24.Marazzi I, Ho JS, Kim J, Manicassamy B, Dewell S, Albrecht RA, Seibert CW, Schaefer U, Jeffrey KL, Prinjha RK, et al. Suppression of the antiviral response by an influenza histone mimic. Nature. 2012;483:428–433. doi: 10.1038/nature10892. [DOI] [PMC free article] [PubMed] [Google Scholar]
- 25.Youn MY, Yoo HS, Kim MJ, Hwang SY, Choi Y, Desiderio SV, Yoo JY. hCTR9, a component of Paf1 complex, participates in the transcription of interleukin 6-responsive genes through regulation of STAT3-DNA interactions. J. Biol. Chem. 2007;282:34727–34734. doi: 10.1074/jbc.M705411200. [DOI] [PubMed] [Google Scholar]
- 26.Shema E, Kim J, Roeder RG, Oren M. RNF20 inhibits TFIIS-facilitated transcriptional elongation to suppress pro-oncogenic gene expression. Mol. Cell. 2011;42:477–488. doi: 10.1016/j.molcel.2011.03.011. [DOI] [PMC free article] [PubMed] [Google Scholar]
- 27.Kong G, Zhang J, Zhang S, Shan C, Ye L, Zhang X. Upregulated microRNA-29a by hepatitis B virus X protein enhances hepatoma cell migration by targeting PTEN in cell culture model. PloS One. 2011;6:e19518. doi: 10.1371/journal.pone.0019518. [DOI] [PMC free article] [PubMed] [Google Scholar]
- 28.Nordick K, Hoffman MG, Betz JL, Jaehning JA. Direct interactions between the Paf1 complex and a cleavage and polyadenylation factor are revealed by dissociation of Paf1 from RNA polymerase II. Eukaryot. Cell. 2008;7:1158–1167. doi: 10.1128/EC.00434-07. [DOI] [PMC free article] [PubMed] [Google Scholar]
- 29.Kim J, Guermah M, McGinty RK, Lee JS, Tang Z, Milne TA, Shilatifard A, Muir TW, Roeder RG. RAD6-Mediated transcription-coupled H2B ubiquitylation directly stimulates H3K4 methylation in human cells. Cell. 2009;137:459–471. doi: 10.1016/j.cell.2009.02.027. [DOI] [PMC free article] [PubMed] [Google Scholar]
- 30.Shilatifard A. Molecular implementation and physiological roles for histone H3 lysine 4 (H3K4) methylation. Curr. Opin. Cell Biol. 2008;20:341–348. doi: 10.1016/j.ceb.2008.03.019. [DOI] [PMC free article] [PubMed] [Google Scholar]
- 31.Wagner EJ, Carpenter PB. Understanding the language of Lys36 methylation at histone H3. Nat. Rev. Mol. Cell Biol. 2012;13:115–126. doi: 10.1038/nrm3274. [DOI] [PMC free article] [PubMed] [Google Scholar]
- 32.Moniaux N, Nemos C, Schmied BM, Chauhan SC, Deb S, Morikane K, Choudhury A, Vanlith M, Sutherlin M, Sikela JM, et al. The human homologue of the RNA polymerase II-associated factor 1 (hPaf1), localized on the 19q13 amplicon, is associated with tumorigenesis. Oncogene. 2006;25:3247–3257. doi: 10.1038/sj.onc.1209353. [DOI] [PubMed] [Google Scholar]
- 33.Kim J, Guermah M, Roeder RG. The human PAF1 complex acts in chromatin transcription elongation both independently and cooperatively with SII/TFIIS. Cell. 2010;140:491–503. doi: 10.1016/j.cell.2009.12.050. [DOI] [PMC free article] [PubMed] [Google Scholar]
- 34.Dermody JL, Buratowski S. Leo1 subunit of the yeast paf1 complex binds RNA and contributes to complex recruitment. J. Biol. Chem. 2010;285:33671–33679. doi: 10.1074/jbc.M110.140764. [DOI] [PMC free article] [PubMed] [Google Scholar]
- 35.Warner MH, Roinick KL, Arndt KM. Rtf1 is a multifunctional component of the Paf1 complex that regulates gene expression by directing cotranscriptional histone modification. Mol. Cell. Biol. 2007;27:6103–6115. doi: 10.1128/MCB.00772-07. [DOI] [PMC free article] [PubMed] [Google Scholar]
- 36.Cheng CY, Hsieh HL, Sun CC, Lin CC, Luo SF, Yang CM. IL-1 beta induces urokinase-plasminogen activator expression and cell migration through PKC alpha, JNK1/2, and NF-kappaB in A549 cells. J. Cell. Physiol. 2009;219:183–193. doi: 10.1002/jcp.21669. [DOI] [PubMed] [Google Scholar]
- 37.Hirata T, Osuga Y, Takamura M, Kodama A, Hirota Y, Koga K, Yoshino O, Harada M, Takemura Y, Yano T, et al. Recruitment of CCR6-expressing Th17 cells by CCL 20 secreted from IL-1 beta-, TNF-alpha-, and IL-17A-stimulated endometriotic stromal cells. Endocrinology. 2010;151:5468–5476. doi: 10.1210/en.2010-0398. [DOI] [PubMed] [Google Scholar]
- 38.Popov Y, Patsenker E, Bauer M, Niedobitek E, Schulze-Krebs A, Schuppan D. Halofuginone induces matrix metalloproteinases in rat hepatic stellate cells via activation of p38 and NFkappaB. J. Biol. Chem. 2006;281:15090–15098. doi: 10.1074/jbc.M600030200. [DOI] [PubMed] [Google Scholar]
- 39.White SR, Fischer BM, Marroquin BA, Stern R. Interleukin-1 beta mediates human airway epithelial cell migration via NF-kappa B. Am. J. Physiol. Lung Cell. Mol. Physiol. 2008;295:L1018–L1027. doi: 10.1152/ajplung.00065.2008. [DOI] [PMC free article] [PubMed] [Google Scholar]
- 40.Crisucci EM, Arndt KM. The Paf1 complex represses ARG1 transcription in Saccharomyces cerevisiae by promoting histone modifications. Eukaryot. Cell. 2011;10:712–723. doi: 10.1128/EC.05013-11. [DOI] [PMC free article] [PubMed] [Google Scholar]
- 41.Gaston K, Jayaraman PS. Transcriptional repression in eukaryotes: repressors and repression mechanisms. Cell. Mol. Life Sci. 2003;60:721–741. doi: 10.1007/s00018-003-2260-3. [DOI] [PMC free article] [PubMed] [Google Scholar]
- 42.Kim KY, Levin DE. Mpk1 MAPK association with the Paf1 complex blocks Sen1-mediated premature transcription termination. Cell. 2011;144:745–756. doi: 10.1016/j.cell.2011.01.034. [DOI] [PMC free article] [PubMed] [Google Scholar]
- 43.Wu J, Xu W. Histone H3R17me2a mark recruits human RNA polymerase-associated factor 1 complex to activate transcription. Proc. Natl Acad. Sci. USA. 2012;109:5675–5680. doi: 10.1073/pnas.1114905109. [DOI] [PMC free article] [PubMed] [Google Scholar]
- 44.Carpten JD, Robbins CM, Villablanca A, Forsberg L, Presciuttini S, Bailey-Wilson J, Simonds WF, Gillanders EM, Kennedy AM, Chen JD, et al. HRPT2, encoding parafibromin, is mutated in hyperparathyroidism-jaw tumor syndrome. Nat. Genet. 2002;32:676–680. doi: 10.1038/ng1048. [DOI] [PubMed] [Google Scholar]
- 45.Zhang J, Dong J, Gu H, Yu S, Zhang X, Gou Y, Xu W, Burd A, Huang L, Miyado K, et al. CD9 is critical for cutaneous wound healing through JNK signaling. J. Invest. Dermatol. 2012;132:226–236. doi: 10.1038/jid.2011.268. [DOI] [PubMed] [Google Scholar]
- 46.Wang W, Chin-Sheng H, Kuo LJ, Wei PL, Lien YC, Lin FY, Liu HH, Ho YS, Wu CH, Chang YJ. NNK enhances cell migration through alpha7-nicotinic acetylcholine receptor accompanied by increased of fibronectin expression in gastric cancer. Ann. Surg. Oncol. 2012;19(Suppl. 3):S580–S588. doi: 10.1245/s10434-011-2064-x. [DOI] [PubMed] [Google Scholar]
- 47.Jones JI, Gockerman A, Busby WH, Jr, Wright G, Clemmons DR. Insulin-like growth factor binding protein 1 stimulates cell migration and binds to the alpha 5 beta 1 integrin by means of its Arg-Gly-Asp sequence. Proc. Natl Acad. Sci. USA. 1993;90:10553–10557. doi: 10.1073/pnas.90.22.10553. [DOI] [PMC free article] [PubMed] [Google Scholar]
- 48.Paiva P, Salamonsen LA, Manuelpillai U, Walker C, Tapia A, Wallace EM, Dimitriadis E. Interleukin-11 promotes migration, but not proliferation, of human trophoblast cells, implying a role in placentation. Endocrinology. 2007;148:5566–5572. doi: 10.1210/en.2007-0517. [DOI] [PubMed] [Google Scholar]
- 49.Alfano D, Votta G, Schulze A, Downward J, Caputi M, Stoppelli MP, Iaccarino I. Modulation of cellular migration and survival by c-Myc through the downregulation of urokinase (uPA) and uPA receptor. Mol. Cell. Biol. 2010;30:1838–1851. doi: 10.1128/MCB.01442-09. [DOI] [PMC free article] [PubMed] [Google Scholar]
- 50.Leaner VD, Chick JF, Donninger H, Linniola I, Mendoza A, Khanna C, Birrer MJ. Inhibition of AP-1 transcriptional activity blocks the migration, invasion, and experimental metastasis of murine osteosarcoma. Am. J. Pathol. 2009;174:265–275. doi: 10.2353/ajpath.2009.071006. [DOI] [PMC free article] [PubMed] [Google Scholar]
Associated Data
This section collects any data citations, data availability statements, or supplementary materials included in this article.