


Abstract
Heterochromatin protein 1a (HP1a) is a chromatin-associated protein important for the formation and maintenance of heterochromatin. In Drosophila, the two histone methyltransferases SETDB1 and Su(var)3-9 mediate H3K9 methylation marks that initiates the establishment and spreading of HP1a-enriched chromatin. Although HP1a is generally regarded as a factor that represses gene transcription, several reports have linked HP1a binding to active genes, and in some cases, it has been shown to stimulate transcriptional activity. To clarify the function of HP1a in transcription regulation and its association with Su(var)3-9, SETDB1 and the chromosome 4-specific protein POF, we conducted genome-wide expression studies and combined the results with available binding data in Drosophila melanogaster. The results suggest that HP1a, SETDB1 and Su(var)3-9 repress genes on chromosome 4, where non-ubiquitously expressed genes are preferentially targeted, and stimulate genes in pericentromeric regions. Further, we showed that on chromosome 4, Su(var)3-9, SETDB1 and HP1a target the same genes. In addition, we found that transposons are repressed by HP1a and Su(var)3-9 and that the binding level and expression effects of HP1a are affected by gene length. Our results indicate that genes have adapted to be properly expressed in their local chromatin environment.
INTRODUCTION
The eukaryotic genome is organized into a DNA- and protein-containing structure known as chromatin. Two major types of chromatin have been defined: euchromatin, which contains actively expressed genes and remains de-condensed throughout the cell cycle, and heterochromatin, which remains condensed and is generally associated with repression and inactive genes (1,2). Recently, a more specific classification of chromatin was introduced (3), in which the ‘classical’ gene-poor, repeat-rich and recombinationally silent heterochromatin (4) best corresponds to ‘GREEN chromatin’. GREEN chromatin is enriched in di- and trimethylation of lysine 9 on histone 3 (H3K9me2 and H3K9me3) and the transcription-repressing heterochromatin protein 1a (HP1a), which binds to H3K9me through its chromodomain (5). In Drosophila melanogaster, the H3K9me2 and H3K9me3 methylation marks are mainly controlled by at least two different histone methyltransferases (HKMTs), i.e. SETDB1 (6–10) and Su(var)3-9 (10–12). The general idea of heterochromatin formation is that two H3K9me-bound HP1a molecules (13–17) interact through their chromo shadow domain, forming a dimer that links two adjacent nucleosome molecules together (18,19) and resulting in methylation of the neighboring nucleosome through the interaction of HKMTs with the chromo shadow domain of the bound HP1a (11). This initiates a spreading mechanism that causes the chromatin to become condensed and inactive (5,13). Recently, it has been proposed that HP1a initially binds strongly to the promoters of active genes independently of H3K9me, forming a nucleation site for further H3K9me-dependent spreading of HP1a along the gene body (10). GREEN chromatin, and consequently the HP1a binding sites, in the D. melanogaster genome are primarily located in the pericentromeric regions and on the 4th chromosome (3). The pericentromeric regions are heterochromatic regions adjacent to the centromeres, and H3K9me2 and me3 in these regions are mainly mediated by Su(var)3-9 (10,11).
The 4th chromosome is associated with several heterochromatic markers (including HP1a) and a high content of repetitive elements and transposable elements, but still the chromosome contains multiple active genes that are interspersed between the repetitive elements, rendering it a gene density and expression output similar to that of euchromatic sites, reviewed by Riddle and colleagues (20,21).
Both SETDB1 and Su(var)3-9 are associated with the 4th chromosome, but it is primarily SETDB1 that is responsible for mediating H3K9 methylation in this region (6,7,9,10). The nature of the 4th chromosome presents a challenging situation for the cell, in which the transposons must be kept in a silent state at the same time as the embedded genes must remain active. One factor that has an important role in maintaining gene expression within this repressive environment is the chromosome 4-specific protein POF (Painting of Fourth), which specifically binds to nascent RNA from actively transcribed genes and increases expression output (22–28). ChIP-chip experiments have shown that HP1a and POF are interdependently associated with the gene body of these active genes on the 4th chromosome (3,10,29–32), and together they exert opposite effects on gene expression, creating a tightly balanced mechanism for gene regulation (7,23).
HP1a binding has also been found to be dispersed at a number of euchromatic sites (33), where it binds to the gene body of active genes (31,34). The cytological region 2L:31 is the most distinct of these euchromatic sites (10,30,32,33,35,36). H3K9 methylation in this region appears to be mediated mainly by SETDB1 (10).
In line with HP1a’s importance in heterochromatin formation and gene repression, an RNAi-mediated knock-down of HP1a has been shown to be associated with increased expression of genes located on the 4th chromosome (23,37). Interestingly, several expression studies have reported contradictory results, indicating that HP1a has an activating function on gene expression; different euchromatic genes have been shown to be down-regulated in HP1a mutants (9,34,35,38) and in RNAi knock-down experiments (39,40). To be properly expressed, genes in the pericentromeric regions have been shown to depend on HP1a and the heterochromatic background, as exemplified by the genes light, rolled, RpL15 and Dbp80 (41–46). Furthermore, detailed mapping studies of HP1 a binding sites in euchromatin have shown its enrichment at developmentally regulated genes and at heat shock-induced chromosomal puffs, which are regions with high gene activity (34).
To clarify the role of H3K9me2, me3, HP1a and POF in gene transcription, we conducted genome-wide expression studies and combined the results with binding data to investigate the targeting and expression effects of HP1a in the three different HP1a binding regions, i.e. chromosome 4, pericentromeric regions and cytological section 2L:31. We here show that HP1a has a repressing function on chromosome 4, where it preferentially targets non-ubiquitously expressed genes (NUEGs), and an activating function in the pericentromeric regions, whereas, on average, region 2L:31 is unaffected. The effects of SETDB1 and Su(var)3-9 are similar to HP1a, and on chromosome 4, Su(var)3-9, SETDB1 and HP1a essentially target the same genes. Furthermore, we found that HP1a binding and function correlates with gene length, with longer genes being more repressed. Within the pericentromeric regions, we observed that genes that are closer to the proximal end of the chromosome are more strongly bound and stimulated by HP1a.
MATERIALS AND METHODS
Fly strains and genetic crosses
Flies were cultivated and crossed at 25°C in vials containing potato mash-yeast-agar. Strain y w; PofD119/CyO was previously generated in our laboratory (23). To generate Su(var)3-9 nulls, we constructed trans-heterozygotes for the two alleles Su(var)3-9evo (10,23,47) and Su(var)3-906 (11,48). The Su(var)2-504, Su(var)2-505 (HP1a), Su(var)3-9evo and Su(var)3-906 strains were obtained from Victor Corces (Johns Hopkins University, Baltimore). Setdb110.1 and the hemagglutinin-tagged SETDB1 encoding strain (Setdb13HA) used for polytene staining were obtained from Carole Seum (University of Geneva) (6). Oregon R was used as the wild-type strain, and three replicates of 200 first-instar larvae from each mutant (six replicates of wild-type) were collected from yeast prepared apple-agar plates ∼48 h after egg laying and then frozen at −80°C.
Immunostaining of polytene chromosomes
Immunostaining of polytene chromosomes was essentially as described previously (22). We used primary antibodies against POF [chicken, 1:100 dilution (24) or rabbit, 1:400 (25)], HP1a (PRB291C, 1:400, Covance) and αHA (MMS 101R, 1:100, Covance, for detection of SETDB1.3HA). Goat anti-rabbit, anti-chicken and anti-mouse conjugated with Alexa-Fluor555 or AlexaFluor488 (1:300, Molecular Probes) were used as secondary antibodies.
Microarray analysis
For microarray analysis, total RNA from Drosophila first-instar mutant larvae and wild-type control larvae was isolated using TRIzol reagent (Invitrogen), followed by purification using RNeasy Mini Kit (Qiagen) according to the manufacturers’ protocols. The labeled cDNA probes were then hybridized to an Affymetrix Drosophila gene chip (version 2), and the intensity values were normalized and summarized using a robust multi-array analysis in R (www.R-project.org) and the Bioconductor package (49). The resulting data are available at http://www.ncbi.nlm.nih.gov/geo/ (accession number: GSE43478).
Calculations and treatment of microarray data sets
We used data for the six wild-type replicates in combination with that for the three re-analyzed wild-type replicates (23) to exclude genes that were unstably detected (standard deviation of 9 wild-type replicates > 1 on a log2 scale). Next, we removed all un-expressed genes, i.e. genes where median expression of the replicates of all mutant data sets and median expression of the wild-type replicates were lower than 6 on a log2 scale. For partially un-expressed genes (i.e. genes where one or more replicate expression values of any of the mutant and/or wild-type conditions were <6), all replicate values <6 were set to 6. Next, the data were scaled by adding an array-specific constant to all the mutant array expression values so that the total genomic expression on all mutant data sets matched that of the wild-type, as previously described (50). The relative expression ratio for each gene was calculated from the median of the three mutant replicates minus the median of the wild-type replicates. The re-analyzed Pof mutant and wild-type data were treated as previously, but (apart from the first step of removing unstably detected genes) these data were analyzed separately from the other mutant and wild-type data. Ubiquitously expressed genes (UEGs) and NUEGs were defined as described previously (28).
Gene binding data and average gene profiles
Calculated average binding values of the exons of all expressed genes and calculated average meta-gene binding profiles of all expressed genes were based on ChIP-chip data for POF and HP1a (10) and Su(var)3-9 data from modENCODE (third-instar larvae nuclei) (51). Gene binding values for all genes and HP1a average profiles were calculated as described previously [(29) and (10), respectively]. HP1a binding values that correlated with gene length and genomic position were calculated based on modENCODE HP1a binding data (51) for genes expressed to levels >6 in salivary gland tissue of the FlyAtlas database (52). Gene expression values were calculated from RNA-seq analysis results of third-instar larval salivary gland tissue (53).
Data handling and statistical analysis
All statistical analyses were performed on log2-scaled data using Statsoft Statistica 10.0 or Excel 2010. The statistical test Wilcoxon matched pairs test was used to measure significant differences between the average expression level (median of three replicates) of all expressed genes in the mutants compared with the average expression level of the wild-type. (i.e. not between the mutant to wild-type expression ratio and 0).
RESULTS
Genome-wide binding of HP1a, POF and SETDB1
To study the binding patterns of SETDB1, Su(var)3-9, HP1a and POF, we performed immunostaining of D. melanogaster polytene chromosomes to investigate a number of different genomic regions with HP1a-enriched ‘GREEN chromatin’ properties, i.e. chromosome 4, pericentromeric regions (regions proximal to the centromere on chromosomes 2L, 2R and 3L) and cytological region 2L:31 (10,30,32,33,35,36). As expected, POF, which has been shown to bind exclusively to chromosome 4 (23,24), shows some overlap with HP1a binding on the 4th chromosome but not in the pericentromeric regions, where only HP1a binds (Figure 1A–C). Interestingly, despite the high specificity for chromosome 4 genes, we occasionally observed POF binding in parts of the 2L:31 region (Figure 1B). In addition to the co-localization of HP1a and POF (Figure 1C), we also observed a clear co-localization between POF and SETDB1 on chromosome 4 (Figure 1D). In contrast to HP1a binding, neither POF nor SETDB1 displayed any binding to the pericentromeric regions or the most distal part of the 4th chromosome (Figure 1C and D). Thus, POF, HP1a and SETDB1 appear to bind to the same locations on chromosome 4. HP1a and SETDB1 have previously been shown to co-localize on the 4th chromosome (6,7,9,10,54). To compare the relative binding levels of the proteins between these regions, we re-analyzed binding data from ChIP-chip experiments for POF (10), HP1a (10) and Su(var)3-9 (51) and calculated the average binding levels on exons of all actively transcribed genes. As expected, POF displayed clear binding only to chromosome 4 (Figure 1E), whereas HP1a was associated with both the 4th chromosome and pericentromeric regions, and more weakly bound to the 2L:31 region (Figure 1F). Interestingly, Su(var)3-9 showed the strongest binding to chromosome 4 compared with the other regions (Figure 1G). Su(var)3-9 has previously been shown to bind to the 4th chromosome to some extent, but in contrast to SETDB1, has a minor effect on methylation patterns at this site (10–12,55). We conclude that HP1a, POF and SETDB1 binding overlap on the 4th chromosome, and in addition, HP1a and Su(var)3-9 bind to the pericentromeric regions and distal end of the 4th chromosome.
Figure 1.

HP1a, SETDB1 and POF binding overlaps on chromosome 4, occasionally POF overlaps with HP1a binding on region 2L:31. (A) HP1a (green) and POF (red) localization on a whole wild-type polytene chromosome. (B) Close-up image of pericentromeric, chromosome 4 and 2L:31 regions. The arrow indicates chromosome 4, arrow head indicates pericentromeric region and asterix indicates cytological region 2L:31. (C) POF and HP1a binding on chromosome 4. (D) POF and HA (for detection of HA-tagged SETDB1) staining in red and green, respectively, on chromosome 4 in a SETDB1-3HA third-instar larva. The arrow indicates chromosome 4 and arrow head indicates pericentromeric region. DNA is stained with DAPI (blue). (E–G) Mean exon binding value (log2 scale) of POF (E), HP1a (F) and Su(var)3-9 (G) for all active genes within chromosome 4, pericentromeric regions, 2L:31 region and control region (whole chromosome 3R) (n =50, 68, 56 and 1753, respectively). Dashed lines represent binding levels in the control region (chromosome 3R) and error bars indicates the 95% confidence interval.
HP1 inhibits gene expression on the 4th chromosome and induces gene expression in pericentromeric regions
To study the effects on regulation of gene transcription, we prepared total RNA from first-instar larvae of trans-heterozygous HP1a04/HP1a05, trans-heterozygous Su(var)3-9evo/Su(var)3-906 and homozygous Setdb110.1/ Setdb110.1 mutants and trans-heterozygous HP1a04 PofD119/HP1a05 PofD119 double-mutants. The HP1a Pof double-mutant was included to study the effects on chromosome 4 expression in a case where both components (HP1a and POF) of the proposed chromosome 4 balancing system were lost (29). Total RNA was prepared from three replicates of first-instar larvae of each mutant and from six replicates of wild-type. The RNA was converted to cDNA and hybridized to an Affymetrix expression array.
The wild-type replicates were used to eliminate genes that were unstably expressed under wild-type conditions due to biological and/or technical reasons. All genes with a wild-type standard deviation >1 (log2 scale) (in total 531 genes) and all genes with non- or sub-detectable expression, i.e. with a median expression level <6 in all mutant data sets and the wild-type data set [as previously described (28,50)], were excluded from further analysis. We next calculated the expression ratios between the median values of three mutant replicates against the median values of the six wild-type replicates for each gene in the different mutant data sets. In addition to the newly generated data, we re-analyzed expression data from homozygous PofD119/ PofD119 mutant first-instar larvae and from the corresponding wild-type first-instar larvae (three replicates each) (23). Notably, in contrast to the HP1a Pof mutant (and the other mutants analyzed in this study), the Pof mutant had no maternal contribution of the POF protein. The Pof mutant and wild-type were treated in the same way as described previously, and expression ratios were calculated for all genes.
To analyze the role of the different proteins in gene expression regulation within chromosome 4, region 2L:31 and the pericentromeric regions, we calculated the average expression ratios for the mutants versus wild-type within each region. In line with previous reports (22,23,28), removing POF resulted in a significant reduction of chromosome 4 gene expression (−0.3 on the log2 scale or 81% of wild-type expression) (Figure 2A), indicating that POF exerts a stimulating effect on the 4th chromosome. The HP1a mutant displayed an increased expression level of chromosome 4 genes (0.16 on the log2 scale or 112% of wild-type expression), which is in line with previous results (23). In the case of the HP1a Pof double-mutant, where both components of the chromosome 4 expression balancing system were absent, no significant change was observed. The Setdb1 and Su(var)3-9 mutants both displayed increased chromosome 4 expression levels (0.07 and 0.1 on the log2 scale, respectively), but the effects were less pronounced than in the HP1a mutant (Figure 2A).
Figure 2.

HP1 inhibits gene expression on the 4th chromosome and induces gene expression in pericentromeric regions. The mean expression ratio (log2 scale) detected by Affymetrix expression arrays in Pof, HP1a, HP1a Pof, Setdb1 and Su(var)3-9 mutants versus wild-type in (A) chromosome 4, (B) pericentromeric regions, (C) cytological region 2L:31 and (D) control (all active genes, except within the three tested regions). Squares indicate the mean value and whiskers indicate the 95% confidence interval. Dashed lines indicate no change in expression ratio. Wilcoxon matched pairs test was used to estimate the significant difference between the average absolute mutant expression level and average absolute wild-type expression level. ** indicates significant at P < 0.01 and * indicates significant at P < 0.05. (Sample sizes for the Pof mutant were nchr4 = 69, npericentromeric = 79, n2L:31 = 71 and ncontrol = 9131, and for the other mutants, nchr4 = 77, npericentromeric = 82, n2L:31 = 72 and ncontrol = 9356).
Interestingly, in the pericentromeric regions, HP1a displayed an opposite trend to that on the 4th chromosome; the expression level was reduced in the HP1a mutant, indicating a stimulatory function of HP1a on gene expression. A lack of Su(var)3-9, the protein mediating H3K9me in this region, also caused reduced gene expression, but the effect was less pronounced compared with the HP1a mutant. As expected, the Setdb1 mutant did not show any effect on gene expression in the pericentromeric regions (Figure 2B). In region 2L:31, the Su(var)3-9 mutant displayed a reduction in the average expression ratio by ∼−0.15 on the log2 scale (Figure 2C). Surprisingly, the Pof mutant had a weak, but significant, up-regulating effect in both the pericentromeric regions (Figure 2B) and the 2L:31 region (Figure 2C).
We conclude that the effect of HP1a on gene expression depends on the genomic region; on average, HP1a had a repressing effect on chromosome 4 active genes, a stimulating effect on pericentromeric active genes and a slightly stimulating effect on active genes in region 2L:31. In general, the 2L:31 region responded in an opposite manner to the 4th chromosome. Furthermore, we observed that SETDB1 and Su(var)3-9 always affected gene expression in the same direction.
SETDB1 and Su(var)3-9 display extensive overlapping functions at both genome-wide and chromosome 4 levels
We were surprised by the comparable directional effects of SETDB1 and Su(var)3-9 on gene regulation, as they are known to control H3K9 methylation mainly in different regions. Therefore, we wanted to identify individual genes that are co-regulated by HP1a, SETDB1 and/or Su(var)3-9 (i.e. genes that are differentially affected in expression level in more than one mutant) on both a genome-wide and regional level. Genes were defined as differentially expressed if all the replicates of a particular mutant exhibited expression values higher or lower than all the wild-type replicates and if the median expression ratio between the mutant and wild-type was higher or lower than ±0.2 on the log2 scale, respectively. To reduce the possibility of false-positives caused by normal variation in the wild-type samples, the six wild-type replicates were first divided into two sets of three replicates so that different wild-type sets could be used when comparing the two mutant conditions.
The numbers of differentially expressed genes that overlapped in the different mutants are shown as Venn diagrams in Figure 3A and B. In line with the results in Figure 2, the overlap between HP1a, Setdb1 and Su(var)3-9 on a whole-genome level was substantial for both down-regulated (i.e. stimulated by encoded proteins in wild-type) and up-regulated (i.e. inhibited by encoded proteins in wild-type) genes (Figure 3A), indicating that SETDB1 and Su(var)3-9 mainly affect the same genes, although the Su(var)3-9 mutant had more down-regulated genes than the Setdb1 mutant. It is noteworthy that on a whole-genome level, the overlap was greatest for down-regulated genes (i.e. stimulated by encoded proteins in the wild-type), whereas on chromosome 4 (where HP1a, SETDB1 and Su(var)3-9 are known to have a repressing effect on gene expression), the overlap was greatest for up-regulated genes (i.e. inhibited by encoded proteins in the wild-type). In addition, almost all the up-regulated genes on chromosome 4 showed a strong overlap between the Su(var)3-9, Setdb1 and HP1a mutants, indicating they all target and repress the same set of genes (Figure 3B).
Figure 3.

SETDB1 and Su(var)3-9 display extensive overlapping functions at both genome-wide and chromosome-4 levels. Differentially up- or down-regulated genes from each mutant are compared in a Venn diagram to identify genes that are co-regulated by HP1a, SETDB1 and Su(var)3-9. Genes were defined as differentially up- or down-regulated if none of the three mutant replicates overlapped with any of the three wild-type replicates and if the ratio between mutant and wild-type median values was greater than 0.2 (log2 scale). (A–C) Differentially down-regulated genes (left diagram) or up-regulated genes (right diagram) in the whole genome (A), on chromosome 4 (B) and transposons (C). (D–H) Mean expression ratio (log2 scale) for transposons (n = 32 for Pof mutant and n = 40 for the other mutants) compared with the rest of the genome (n = 9318 for Pof mutant and n = 9547 for the other mutants) in HP1a (D), HP1a Pof (E), Su(var)3-9 (F), Setdb1 (G) and Pof (H) mutants compared with the median of six wild-type replicates (three wild-type replicates for the Pof mutant). Whiskers indicate the 95% confidence interval.
HP1a and Su(var)3-9 repress transposon-derived transcripts
HP1a and Su(var)3-9 have been suggested to inhibit expression of transposons (56). Therefore, we investigated the expression of transposons in HP1a, Su(var)3-9 and Setdb1 mutants. The majority of the differentially expressed transposons (transposons and retrotransposons as defined by Affymetrix Drosophila gene chip, version 2) were up-regulated in the HP1a and Su(var)3-9 mutants, whereas the Setdb1 mutant affected fewer transposons (Figure 3C). To obtain a more general view of how transposons are regulated, we determined the average expression ratio for all expressed transposons within the whole genome. We found that HP1a (Figure 3D), HP1a Pof (Figure 3E) and Su(var)3-9 (Figure 3F) mutants all exhibited significantly increased transposon expression levels (0.6–0.7 on the log2 scale), whereas Setdb1 and Pof mutants had no effect on transposon expression (Figure 3G and H). We concluded that HP1a and Su(var)3-9 repress transposon-derived RNA expression.
HP1a preferentially represses NUEGs on chromosome 4 and stimulates expression of UEGs in pericentromeric regions
To test if the opposite gene expression effects could be connected with different gene types, we examined UEGs and NUEGs, as defined in a previous study in which POF was found to preferentially target NUEGs on chromosome 4 (28). The average expression ratio for each mutant was calculated for UEGs and NUEGs on chromosome 4, in the pericentromeric regions and in cytological region 2L:31 (Figure 4A–C). As observed previously (28), we found that POF on chromosome 4 mainly targets and stimulates expression of NUEGs (Figure 4A). Furthermore, we observed that the repressing effects of HP1a on chromosome 4 was also stronger for the NUEGs, as expected, as POF and HP1a are known to bind to essentially the same genes on chromosome 4. However, the difference in expression ratio between the NUEGs and UEGs was not significant.
Figure 4.

HP1a preferentially inhibits NUEGs on chromosome 4 and stimulates expression of UEGs in pericentromeric regions. The mean expression ratio (log2 scale) of NUEG (gray boxes) and UEG (black boxes) genes in Pof, HP1a, HP1a Pof, Setdb1 and Su(var)3-9 mutants in, (A) chromosome 4 (NUEGs: n = 37, UEGs: n = 32 for Pof mutant and NUEGs: n = 45, UEGs: n = 32 for the other mutants), (B) in pericentromeric regions (NUEGs: n = 27, UEGs: n = 52 for Pof mutant and NUEGs: n = 30, UEGs: n = 52 for the other mutants) and (C) in cytological region 2L:31 (NUEGs: n = 19, UEGs: n = 52 for Pof mutant and NUEGs: n = 20, UEGs: n = 52 for the other mutants). Squares indicate the mean value and whiskers indicate the 95% confidence interval. Dashed lines indicate no change in expression ratio. (D–G) Average meta-gene profiles of HP1a binding in NUEG (gray lines) and UEG (black lines) genes on chromosome 4 (D), pericentromeric regions (E), cytological region 2L:31 (F) and chromosome 3R as an HP1a-unbound control region (G). The profiles were compiled based on all active genes in the four regions in a wild-type background and each profile was generated on eight enrichment values on the x-axis. The first point of the curve is an average of the intergenic region upstream of the designated promoter of each gene. The promoter was defined as the 500-bp region upstream of the TSS. The gene body was divided into five bins, and the average enrichment in introns is the last point on the curve. The y-axis shows enrichment on a log2 scale.
A similar trend was observed for HP1a Pof, SETDB1 and Su(var)3-9 mutants (Figure 4A). Notably, although the effects were small for the pericentromeric regions (Figure 4B), an opposite trend was observed, i.e. UEGs were more affected than the NUEGs in all mutants (even Pof affected expression in the opposite direction as the other mutants) (Figure 4B). The same trend was not observed in the 2L:31 region (Figure 4C).
We therefore conclude that POF and HP1a preferentially target NUEGs on chromosome 4, where POF stimulates and HP1a inhibits gene expression, whereas in the pericentromeric regions, HP1a stimulates gene expression with a slight preference for UEGs.
Next, we investigated whether the opposite gene expression effects of HP1a on NUEGs and UEGs could be connected with HP1a binding preferences. Therefore, we re-analyzed HP1a binding data from (10) and made the interesting observation that HP1a on chromosome 4 binds stronger to the promoter than to the gene body in UEGs compared with NUEGs. In the pericentromeric regions, we measured stronger promoter binding than gene body binding for both NUEGs and UEGs, although the difference was more pronounced for UEGs.
HP1a inhibits gene expression in long genes and stimulates expression in short genes
We have previously shown that the degree of buffering of gene expression in segmental monosomies correlates to gene length (50) and hypothesized that the repressing role of HP1a is connected with HP1a binding in the gene body (10). Therefore, we surmised that the gene length might correlate to the repressing effect of HP1a. Hence, we plotted the gene length versus expression ratios in HP1a – wild-type and found a clear positive correlation; the longer the gene, the more up-regulated it was in the HP1a mutant, whereas the shortest genes (∼2 kb and shorter) were repressed in the HP1a mutant (Figure 5A). This correlation was not observed for the other mutants (data not shown). However, HP1a binding levels (average binding value of exons of expressed genes) from a HP1a ChIP experiment on salivary glands did not correlate with gene length, implying that the HP1a binding density per length unit was the same for short and long genes (Figure 5B). Furthermore, the correlation seen between HP1a expression ratio and gene length was not associated with any correlation between gene length and wild-type expression levels (Figure 5C). The deviating behavior of the shortest gene length bin (<0.5 kb) may be because a large proportion of this group consists of probe sets that are undefined by Affymetrix (Supplementary Figure S1A), and are thus likely to be non-coding transcripts or repetitive elements. The low wild-type expression of this bin (Figure 5C) also indicates that they are situated within repressed chromatin. When looking at all gene lengths, the undefined probe sets were significantly up-regulated in the HP1a mutant (Supplementary Figure S1B), indicating that HP1a is likely to be involved in repressing these repetitive and/or non-coding elements. Notably, the fact that region 2L:31, despite having HP1a binding (Figure 1), did not show the same effects as observed for chromosome 4 and the pericentromeric regions could potentially be explained by this gene length effect, as the average gene length in region 2L:31 was significantly shorter than in the other regions (Figure 5D). However, as shown in Figure 1, the binding levels of HP1a were lower in region 2L:31 genes compared with the 4th chromosome and pericentromeric region genes.
Figure 5.

HP1a inhibits gene expression of long genes and stimulates expression of short genes. (A) Mean plot of expression ratio in an HP1a mutant versus wild-type plotted against bins of gene length (defined as length between transcriptional start and stop sites in kb, sample number is from lowest to highest bins; 473, 1255, 1321, 1189, 897, 662, 930, 592, 425, 565, 348 and 1405, respectively). (B) Mean plot of average HP1a binding values of all genes plotted against bins of gene length. (C) Mean plot of wild-type expression value plotted against bins of gene length. (D) Average gene length (of the active genes that are included in this study) in the different HP1a binding regions: chromosome 4 (n = 78), pericentromeric regions (n = 88), cytological region 2L:31 (n = 72) and in the remaining euchromatic genome (n = 9824). All y-axis values are on a log2 scale and whiskers indicate the 95% confidence interval.
We conclude that the effects on the expression ratio in HP1a mutants are dependent on gene length, i.e. long genes are repressed by HP1a, whereas short genes appear to be stimulated, and HP1a binds with the same density per length unit irrespective of the size of the gene. As expected, the shortest gene length bin, over-represented by transcripts from repetitive elements and non-coding RNAs, was repressed by HP1a.
Distance of genes from the centromere within pericentromeric regions affects the level of HP1a regulation
We found that different gene types (UEGs and NUEGs) and different gene lengths affected the level of HP1a binding and regulation. Next, we investigated whether the position of genes in relation to centromeric heterochromatin was connected with HP1a function. To study this, we plotted the expression ratio in HP1a mutants against the position of genes within the regions of interest and found that in the pericentromeric regions of chromosome 2L and chromosome 3L, the effect of HP1a on gene expression correlated positively with the distance between the transcriptional start site of the gene and the heterochromatic centromere region (proximal end of chromosome arm according to sequence release 5.43) (Figure 6A). This correlation was not observed for pericentromeric genes on chromosome 2R (result not shown), and chromosome 3R was excluded because it has no defined HP1a-bound pericentromeric region (30). To test whether the binding of HP1a also correlates with distance from centromere, HP1a binding levels of individual active genes were plotted against position of transcriptional start site within the 2L and 3L pericentromeric regions. The results showed a significant negative correlation between binding and distance from the centromere (Figure 6B).
Figure 6.
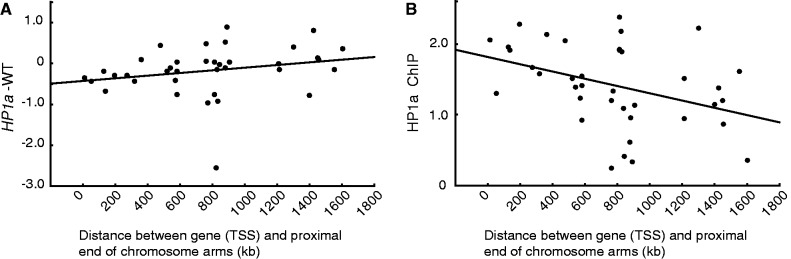
Distance of genes from the centromere within pericentromeric regions affects the level of HP1a regulation. (A) Correlation plot between the expression ratios in the HP1a mutant versus wild-type and the distance between transcriptional start site (TSS) and centromere (the end coordinates of the gene arms as defined by FlyBase genome release 5.0) within the pericentromeric regions of chromosome 2L and 3L. (B) HP1a binding levels correlated to the distance between TSS and centromere. For both these plots, genes defined as unbound by HP1a were removed. Both y-axis values are on a log2 scale. The Spearman correlation coefficient was significant for (A) (rs = 0.406, P = 0.013) and (B) (rs = −0.454, P = 0.004).
We conclude that for genes within the 2L and 3L pericentromeric regions, HP1a binding increases in strength with increasing proximity of the genes to the heterochromatic centromere. Further, because HP1a has an activating function in the pericentromeric regions, these proximal genes are likely to be more transcriptionally stimulated than the distal ones.
DISCUSSION
Chromosome 4 is bound by HP1a, POF, SETDB1 and Su(var)3-9
Heterochromatin protein 1 is a protein that has been well-studied in many model organisms, including Schizosaccharomyces pombe, mouse and D. melanogaster. Although D. melanogaster HP1a is best known for its role in heterochromatin formation and silencing, several reports have linked HP1a to regulation of transcriptional activity of heterochromatic and some euchromatic genes (5,57). We asked if these conflicting results could partly be explained by a region-specific function of HP1a and the proteins involved in HP1a binding, i.e. SETDB1, Su(var)3-9 and POF (9,10,23). Based on polytene chromosome staining, it was clear that POF, HP1a and SETDB1 overlapped on chromosome 4 but not on the pericentromeric section or on the most distal part of the tip, which was only bound by HP1a. These POF and SETDB1 unbound regions also correspond to regions that are independent of SETDB1 for maintaining a proper H3K9me2 and me3 pattern (10). In line with previous studies (3,51), we found that Su(var)3-9 binds to chromosome 4 when considering expressed genes, and more interestingly, this binding to active genes is, on average, stronger than the binding of Su(var)3-9 to active genes in the pericentromeric regions, although loss of Su(var)3-9 had minor effects on the methylation pattern of chromosome 4. The putative function of Su(var)3-9 on chromosome 4 therefore remains elusive.
In addition to the persistent binding of POF to chromosome 4, it is interesting to note the presence of occasional binding to region 2L:31. It is known that POF binds to HP1a binding sites where HP1a binding is dependent on SETDB1, and as we have previously shown that binding of HP1a in region 2L:31 is dependent on SETDB1 (10), this could partially explain the sporadic binding of POF in this region. Region 2L:31 displayed similar properties to other euchromatic regions that are unbound by SETDB1 and HP1a (35). Thus, the reason for the targeting of this particular region remains to be explained.
HP1a has opposite functions on chromosome 4 and in pericentromeric regions
HP1a has long been known for its repressive function. It was initially identified as a dominant suppressor of position-effect variegation and was named Su(var)205 (2,58–61), and we have previously reported that HP1a represses gene expression on chromosome 4 (23). However, several studies have reported an activating function of HP1a (9,34,35,38–40). Our current study suggests that these conflicting reports can at least be partly explained by our observation that HP1a has different functions in different regions; chromosome 4 genes are, on average, repressed, whereas pericentromeric genes are stimulated. We therefore believe that it is important to look at different groups of genes when studying the effects of HP1a. Otherwise, these opposing effects may cancel each other out on a genome-wide level.
Nevertheless, the conflicting results cannot be fully explained by our findings. For example, Schwaiger et al. (40) also studied chromosome 4 effects and found that transcription was reduced in an RNAi-mediated HP1a knock-down, in contrast to our results. Therefore, technical differences between experiments should also be considered; in our study, we cannot exclude the possibility of a maternal contribution of HP1a, as we studied mutants in first-instar larvae from heterozygous mothers, and it is thus likely that we have a reduction in HP1a levels rather than complete removal. It has been shown that maternal HP1a contributes to ∼20% of the HP1a protein found in heterozygous mutant first-instar larvae (44). Like others, we have previously shown that the average level of gene expression of chromosome 4 is comparable with, or even higher than, that of genes on other chromosomes (10,62). At least to some extent, this is a consequence of POF-mediated stimulation of gene expression output, which counteracts the repressing nature of the 4th chromosome (22,23,28). We hypothesize that due to POF and other factors, genes on the 4th chromosome have evolved to be functional in this repressive GREEN-chromatin environment. A decrease in HP1a is mainly expected to cause a reduction of the low affinity binding of HP1a in the gene body, and consequently a de-repression of gene expression. However, prolonged loss or very strong depletion of HP1a will most probably have dramatic effects on the overall structure of chromosome 4 chromatin, and thus lead to a dysfunctional chromatin structure with decreased gene expression. This implies that the genes have adapted to be properly expressed in the local chromatin environment.
As we have previously shown, POF is involved in stimulating expression of active genes on chromosome 4. The observed effects in the Pof mutant on genes in the pericentromeric regions and region 2L:31 are most likely explained by indirect effects when HP1a is being redistributed from chromosome 4 to other binding sites, as binding of HP1a to chromosome 4 is dependent on the presence of POF (9,10,23). The increased transcriptional output of chromosome 4 genes in the Setdb1 mutant is likely due to loss of the repressive methylation marks, which in turn will reduce HP1a binding (6,7,9,10). Although we know that HP1a binding to promoters is independent of methylation marks, it is possible that HP1a binding remains in promoters, where it exerts an activating function.
The increased chromosome 4 expression observed in the Su(var)3-9 mutant is surprising but could be explained by indirect effects; we speculate that when Su(var)3-9 is lost from the pericentromeric regions, SETDB1 is redirected from chromosome 4 to sustain normal H3K9 methylation in the pericentromeric regions, thus decreasing HP1a binding to chromosome 4. This could explain why both the Setdb1 and the Su(var)3-9 mutants give such similar up-regulating effects on chromosome 4 expression. An alternative explanation for this effect is that the observed binding of Su(var)3-9 to chromosome 4 has a yet-unknown repressing function independent of the HKMT function of Su(var)3-9.
The HP1a Pof double-mutant displayed weak non-significant up-regulation of chromosome 4, with marginally larger error bars than for the HP1a mutant, which supports the suggested balancing mechanism of chromosome 4, where HP1a and POF fine-tune the transcriptional output; in the absence of both components, the overall expression will not change but individual genes will start losing proper transcriptional control.
Functions of SETDB1 and Su(var)3-9 are less complementary than previously suggested
Although previous studies have indicated that SETDB1 and Su(var)3-9 have separate main targets, our data show that the majority of genes that are up- or down-regulated in Su(var)3-9 mutants are correspondingly up- or down-regulated in Setdb1 mutants. These results suggest that a redundancy exists between these two proteins, in which both proteins, to some extent, have the ability to be redirected to other locations when needed, as we know that Su(var)3-9 has a chromosome 4 binding capacity. Alternatively, the HP1a system might affect a number of genetic networks so that even if different regions are affected by Su(var)3-9 and Setdb1, the same genetic networks may be indirectly affected. Because Su(var)3-9 affects larger regions than Setdb1, it is likely that more HP1a will be released and redirected to other regions in the Su(var)3-9 mutant than in a Setdb1 mutant, thus causing repression of genes normally unbound by HP1a. This would explain why more genes are down-regulated in the Su(var)3-9 mutant compared with the Setdb1 mutant.
Transposon-derived transcripts are repressed by HP1a and Su(var)3-9
Our results provide strong support for the suggested model in which transposons are repressed by HP1 proteins, as shown for HP1a (63), the HP1 homolog Rhino (64,65) and also Su(var)3-9 (56). In contrast, neither SETDB1 nor POF had any effects on transposon expression. Because SETDB1 is known to have a role in repression of chromosome 4, one could speculate that SETDB1 has a greater influence on repression of transposons located specifically on chromosome 4 than in other parts of the genome. However, due to the repetitive nature of the transposons and the methods used here, it was not possible to distinguish effects for transposons in specific regions.
HP1a mainly affects different gene types on chromosome 4 compared with pericentromeric regions
The observation that chromosome 4 displays a stronger effect on NUEGs, both in terms of down-regulation in the Pof mutant and up-regulation in the HP1a mutant, is supported by previous findings on chromosome 4 (28). One potential explanation for this is that NUEGs have evolved to respond to a regulatory mechanism, whereas UEGs are more robust in expression. Although weak, it is noteworthy that the effect of the HP1a mutant in the pericentromeric regions (decreased gene expression) was slightly stronger for UEGs than NUEGs; this is in line with the relatively strong binding peak found in promoters compared with the gene body in pericentromeric UEGs, as it has been proposed that HP1a in the promoter has a stimulating effect and HP1a in the gene body of chromosome 4 genes has an inhibiting effect (10,66). Note that the number of NUEGs exceeds the number of UEGs on a whole-genome level and on chromosome 4, whereas in pericentromeric regions, the UEGs are over-represented.
In summary, our data support a model in which HP1a binding to promoters in general has a positive function for transcriptional output, whereas HP1a binding in gene bodies has a negative function. If binding in the gene body is relatively large compared with binding to the promoter, the negative function will dominate. In contrast, if the binding to the promoter is stronger than the gene body, the stimulating effect will be larger, albeit not dominating. A reduction in HP1a levels will initially affect the low-affinity gene binding and sequentially, the loss of HP1a will also affect the promoter binding.
HP1a effects depend on gene length
We showed that the average binding level of HP1a is constant irrespective of gene length (the HP1a binding per length unit is constant), implying that longer genes have more HP1a molecules bound in total. This finding, in combination with the suggestion that the repressive effect of HP1a is mainly observed in the gene body, could explain the greater de-repression of longer genes. Stronger binding of HP1a to long genes has also been suggested by de Wit et al. (67). In addition, some chromatin marks mostly associated with active chromatin have been shown to bind differently to different gene lengths (51), suggesting that gene length affects the level of association with chromatin marks. Furthermore, there are indications that HP1 proteins are involved with transcription machinery; the mammalian HP1 isoform gamma and H3K9me3 regulate transcriptional activation by associating with the RNA polymerase II (RNP2) (68), and HP1 can interact with and guide the recruitment of the histone chaperone complex FACT to active genes, which facilitates RNP2 transcription elongation. This, along with our findings, suggests a mechanism in which HP1a is involved in transcriptional elongation. We speculate that HP1a slows down the progression of the RNP2 through the length of the gene body. HP1a binding mechanisms could also be connected with RNA interactions, as HP1a has been shown to directly interact with RNA transcripts and heterogeneous nuclear ribonucleoproteins (38), and HP1a association to centric regions in Drosophila and mice is sensitive to RNase treatment (34,69).
Interestingly, we discovered that a group of non-annotated short genes (<0.5 kb) were repressed by HP1a, even though the HP1a binding levels appeared to be low (which might be explained by technical aspects in determining the binding levels). The lack of annotation and lower wild-type expression level suggest that this group consists of many short genes encoding ncRNAs.
Position of genes within pericentromeric regions affects level of HP1a binding and effect
In the pericentromeric regions of the genome, we observed an interesting connection between the binding and stimulating effects of HP1a and the position of the gene; the closer the gene is located to the centromeric chromatin, the more strongly HP1a binds and stimulates it.
In conclusion, we found that HP1a has opposite functions in different genomic regions, repressing expression on chromosome 4 and stimulating expression in pericentromeric regions. Furthermore, the targets of Su(var)3-9 and SETDB1 are considerably more redundant than previously reported, and the overlap between HP1a, Su(var)3-9 and SETDB1 on chromosome 4 genes is extensive. It is however important to note that the different effects caused by HP1a, SETDB1, Su(var)3-9 and POF could all be interrelated to create a balanced genome. Therefore, it is hard to distinguish the separate effects caused by the different proteins.
ACCESSION NUMBERS
The microarray data reported in this article have been deposited at http://www.ncbi.nlm.nih.gov/geo/ (accession: GSE43478).
SUPPLEMENTARY DATA
Supplementary Data are available at NAR Online: Supplementary Figure 1.
FUNDING
Åke Wibergs Foundation (to P.S.); Swedish Research Council and Swedish Cancer Foundation (to J.L.). Funding for open access charge: Swedish Research Council (to J.L.).
Conflict of interest statement. None declared.
Supplementary Material
ACKNOWLEDGEMENTS
The authors thank Carole Seum and Victor Corces for fly lines, Karin Ekström for fly pushing, Philge Philip for computational support and programming and members of the Larsson group for comments on the manuscript.
REFERENCES
- 1.Grewal SI, Elgin SC. Heterochromatin: new possibilities for the inheritance of structure. Curr. Opin. Genet. Dev. 2002;12:178–187. doi: 10.1016/s0959-437x(02)00284-8. [DOI] [PubMed] [Google Scholar]
- 2.Eissenberg JC, Reuter G. Cellular mechanism for targeting heterochromatin formation in Drosophila. Int. Rev. Cell Mol. Biol. 2009;273:1–47. doi: 10.1016/S1937-6448(08)01801-7. [DOI] [PubMed] [Google Scholar]
- 3.Filion GJ, van Bemmel JG, Braunschweig U, Talhout W, Kind J, Ward LD, Brugman W, de Castro IJ, Kerkhoven RM, Bussemaker HJ, et al. Systematic protein location mapping reveals five principal chromatin types in Drosophila cells. Cell. 2010;143:212–224. doi: 10.1016/j.cell.2010.09.009. [DOI] [PMC free article] [PubMed] [Google Scholar]
- 4.Richards EJ, Elgin SC. Epigenetic codes for heterochromatin formation and silencing: rounding up the usual suspects. Cell. 2002;108:489–500. doi: 10.1016/s0092-8674(02)00644-x. [DOI] [PubMed] [Google Scholar]
- 5.Vermaak D, Malik HS. Multiple roles for heterochromatin protein 1 genes in Drosophila. Annu. Rev. Genet. 2009;43:467–492. doi: 10.1146/annurev-genet-102108-134802. [DOI] [PubMed] [Google Scholar]
- 6.Seum C, Reo E, Peng H, Rauscher FJ, Spierer P, Bontron S. Drosophila SETDB1 is required for chromosome 4 silencing. PLoS Genet. 2007;3:e76. doi: 10.1371/journal.pgen.0030076. [DOI] [PMC free article] [PubMed] [Google Scholar]
- 7.Tzeng TY, Lee CH, Chan LW, Shen CK. Epigenetic regulation of the Drosophila chromosome 4 by the histone H3K9 methyltransferase dSETDB1. Proc. Natl Acad. Sci. USA. 2007;104:12691–12696. doi: 10.1073/pnas.0705534104. [DOI] [PMC free article] [PubMed] [Google Scholar]
- 8.Clough E, Moon W, Wang S, Smith K, Hazelrigg T. Histone methylation is required for oogenesis in Drosophila. Development. 2007;134:157–165. doi: 10.1242/dev.02698. [DOI] [PubMed] [Google Scholar]
- 9.Riddle NC, Jung YL, Gu T, Alekseyenko AA, Asker D, Gui H, Kharchenko PV, Minoda A, Plachetka A, Schwartz YB, et al. Enrichment of HP1a on Drosophila chromosome 4 genes creates an alternate chromatin structure critical for regulation in this heterochromatic domain. PLoS Genet. 2012;8:e1002954. doi: 10.1371/journal.pgen.1002954. [DOI] [PMC free article] [PubMed] [Google Scholar]
- 10.Figueiredo MLA, Philip P, Stenberg P, Larsson J. HP1a recruitment to promoters is independent of H3K9 methylation in Drosophila melanogaster. PLoS Genet. 2012;8:e1003061. doi: 10.1371/journal.pgen.1003061. [DOI] [PMC free article] [PubMed] [Google Scholar]
- 11.Schotta G, Ebert A, Krauss V, Fischer A, Hoffmann J, Rea S, Jenuwein T, Dorn R, Reuter G. Central role of Drosophila SU(VAR)3-9 in histone H3-K9 methylation and heterochromatic gene silencing. EMBO J. 2002;21:1121–1131. doi: 10.1093/emboj/21.5.1121. [DOI] [PMC free article] [PubMed] [Google Scholar]
- 12.Ebert A, Schotta G, Lein S, Kubicek S, Krauss V, Jenuwein T, Reuter G. Su(var) genes regulate the balance between euchromatin and heterochromatin in Drosophila. Genes Dev. 2004;18:2973–2983. doi: 10.1101/gad.323004. [DOI] [PMC free article] [PubMed] [Google Scholar]
- 13.Bannister AJ, Zegerman P, Partridge JF, Miska EA, Thomas JO, Allshire RC, Kouzarides T. Selective recognition of methylated lysine 9 on histone H3 by the HP1 chromo domain. Nature. 2001;410:120–124. doi: 10.1038/35065138. [DOI] [PubMed] [Google Scholar]
- 14.Jacobs SA, Taverna SD, Zhang Y, Briggs SD, Li J, Eissenberg JC, Allis CD, Khorasanizadeh S. Specificity of the HP1 chromo domain for the methylated N-terminus of histone H3. EMBO J. 2001;20:5232–5241. doi: 10.1093/emboj/20.18.5232. [DOI] [PMC free article] [PubMed] [Google Scholar]
- 15.Jacobs SA, Khorasanizadeh S. Structure of HP1 chromodomain bound to a lysine 9-methylated histone H3 tail. Science. 2002;295:2080–2083. doi: 10.1126/science.1069473. [DOI] [PubMed] [Google Scholar]
- 16.Nakayama J, Rice JC, Strahl BD, Allis CD, Grewal SI. Role of histone H3 lysine 9 methylation in epigenetic control of heterochromatin assembly. Science. 2001;292:110–113. doi: 10.1126/science.1060118. [DOI] [PubMed] [Google Scholar]
- 17.Lachner M, O'Carroll D, Rea S, Mechtler K, Jenuwein T. Methylation of histone H3 lysine 9 creates a binding site for HP1 proteins. Nature. 2001;410:116–120. doi: 10.1038/35065132. [DOI] [PubMed] [Google Scholar]
- 18.Aasland R, Stewart AF. The chromo shadow domain, a second chromo domain in heterochromatin-binding protein 1, HP1. Nucleic Acids Res. 1995;23:3168–3173. doi: 10.1093/nar/23.16.3168. [DOI] [PMC free article] [PubMed] [Google Scholar]
- 19.Cowieson NP, Partridge JF, Allshire RC, McLaughlin PJ. Dimerisation of a chromo shadow domain and distinctions from the chromodomain as revealed by structural analysis. Curr. Biol. 2000;10:517–525. doi: 10.1016/s0960-9822(00)00467-x. [DOI] [PubMed] [Google Scholar]
- 20.Riddle NC, Elgin SC. The dot chromosome of Drosophila: insights into chromatin states and their change over evolutionary time. Chromosome Res. 2006;14:405–416. doi: 10.1007/s10577-006-1061-6. [DOI] [PubMed] [Google Scholar]
- 21.Riddle NC, Shaffer CD, Elgin SC. A lot about a little dot - lessons learned from Drosophila melanogaster chromosome 4. Biochem. Cell Biol. 2009;87:229–241. doi: 10.1139/o08-119. [DOI] [PMC free article] [PubMed] [Google Scholar]
- 22.Johansson AM, Stenberg P, Allgardsson A, Larsson J. POF regulates the expression of genes on the fourth chromosome in Drosophila melanogaster by binding to nascent RNA. Mol. Cell Biol. 2012;32:2121–2134. doi: 10.1128/MCB.06622-11. [DOI] [PMC free article] [PubMed] [Google Scholar]
- 23.Johansson AM, Stenberg P, Bernhardsson C, Larsson J. Painting of fourth and chromosome-wide regulation of the 4th chromosome in Drosophila melanogaster. EMBO J. 2007;26:2307–2316. doi: 10.1038/sj.emboj.7601604. [DOI] [PMC free article] [PubMed] [Google Scholar]
- 24.Larsson J, Chen JD, Rasheva V, Rasmuson Lestander A, Pirrotta V. Painting of fourth, a chromosome-specific protein in Drosophila. Proc. Natl Acad. Sci. USA. 2001;98:6273–6278. doi: 10.1073/pnas.111581298. [DOI] [PMC free article] [PubMed] [Google Scholar]
- 25.Larsson J, Svensson MJ, Stenberg P, Mäkitalo M. Painting of fourth in genus Drosophila suggests autosome-specific gene regulation. Proc. Natl Acad. Sci. USA. 2004;101:9728–9733. doi: 10.1073/pnas.0400978101. [DOI] [PMC free article] [PubMed] [Google Scholar]
- 26.Larsson J, Meller VH. Dosage compensation, the origin and the afterlife of sex chromosomes. Chromosome Res. 2006;14:417–431. doi: 10.1007/s10577-006-1064-3. [DOI] [PubMed] [Google Scholar]
- 27.Stenberg P, Larsson J. Buffering and the evolution of chromosome-wide gene regulation. Chromosoma. 2011;120:213–225. doi: 10.1007/s00412-011-0319-8. [DOI] [PMC free article] [PubMed] [Google Scholar]
- 28.Stenberg P, Lundberg LE, Johansson AM, Rydén P, Svensson MJ, Larsson J. Buffering of segmental and chromosomal aneuploidies in Drosophila melanogaster. PLoS Genet. 2009;5:e100302. doi: 10.1371/journal.pgen.1000465. [DOI] [PMC free article] [PubMed] [Google Scholar]
- 29.Johansson AM, Stenberg P, Pettersson F, Larsson J. POF and HP1 bind expressed exons, suggesting a balancing mechanism for gene regulation. PLoS Genet. 2007;3:e209. doi: 10.1371/journal.pgen.0030209. [DOI] [PMC free article] [PubMed] [Google Scholar]
- 30.Riddle NC, Minoda A, Kharchenko PV, Alekseyenko AA, Schwartz YB, Tolstorukov MY, Gorchakov AA, Jaffe JD, Kennedy C, Linder-Basso D, et al. Plasticity in patterns of histone modifications and chromosomal proteins in Drosophila heterochromatin. Genome Res. 2011;21:147–163. doi: 10.1101/gr.110098.110. [DOI] [PMC free article] [PubMed] [Google Scholar]
- 31.de Wit E, Greil F, van Steensel B. High-resolution mapping reveals links of HP1 with active and inactive chromatin components. PLoS Genet. 2007;3:e38. doi: 10.1371/journal.pgen.0030038. [DOI] [PMC free article] [PubMed] [Google Scholar]
- 32.Yin H, Sweeney S, Raha D, Snyder M, Lin H. A high-resolution whole-genome map of key chromatin modifications in the adult Drosophila melanogaster. PLoS Genet. 2011;7:e1002380. doi: 10.1371/journal.pgen.1002380. [DOI] [PMC free article] [PubMed] [Google Scholar]
- 33.Fanti L, Berloco M, Piacentini L, Pimpinelli S. Chromosomal distribution of heterochromatin protein 1 (HP1) in Drosophila: a cytological map of euchromatic HP1 binding sites. Genetica. 2003;117:135–147. doi: 10.1023/a:1022971407290. [DOI] [PubMed] [Google Scholar]
- 34.Piacentini L, Fanti L, Berloco M, Perrini B, Pimpinelli S. Heterochromatin protein 1 (HP1) is associated with induced gene expression in Drosophila euchromatin. J. Cell Biol. 2003;161:707–714. doi: 10.1083/jcb.200303012. [DOI] [PMC free article] [PubMed] [Google Scholar]
- 35.Cryderman DE, Grade SK, Li Y, Fanti L, Pimpinelli S, Wallrath LL. Role of Drosophila HP1 in euchromatic gene expression. Dev. Dyn. 2005;232:767–774. doi: 10.1002/dvdy.20310. [DOI] [PubMed] [Google Scholar]
- 36.James TC, Eissenberg JC, Craig C, Dietrich V, Hobson A, Elgin SC. Distribution patterns of HP1, a heterochromatin-associated nonhistone chromosomal protein of Drosophila. Eur. J. Cell Biol. 1989;50:170–180. [PubMed] [Google Scholar]
- 37.Liu LP, Ni JQ, Shi YD, Oakeley EJ, Sun FL. Sex-specific role of Drosophila melanogaster HP1 in regulating chromatin structure and gene transcription. Nat. Genet. 2005;37:1361–1366. doi: 10.1038/ng1662. [DOI] [PubMed] [Google Scholar]
- 38.Piacentini L, Fanti L, Negri R, Del Vescovo V, Fatica A, Altieri F, Pimpinelli S. Heterochromatin protein 1 (HP1a) positively regulates euchromatic gene expression through RNA transcript association and interaction with hnRNPs in Drosophila. PLoS Genet. 2009;5:e1000670. doi: 10.1371/journal.pgen.1000670. [DOI] [PMC free article] [PubMed] [Google Scholar]
- 39.De Lucia F, Ni JQ, Vaillant C, Sun FL. HP1 modulates the transcription of cell-cycle regulators in Drosophila melanogaster. Nucleic Acids Res. 2005;33:2852–2858. doi: 10.1093/nar/gki584. [DOI] [PMC free article] [PubMed] [Google Scholar]
- 40.Schwaiger M, Kohler H, Oakeley EJ, Stadler MB, Schübeler D. Heterochromatin protein 1 (HP1) modulates replication timing of the Drosophila genome. Genome Res. 2010;20:771–780. doi: 10.1101/gr.101790.109. [DOI] [PMC free article] [PubMed] [Google Scholar]
- 41.Hearn MG, Hedrick A, Grigliatti TA, Wakimoto BT. The effect of modifiers of position-effect variegation on the variegation of heterochromatic genes of Drosophila melanogaster. Genetics. 1991;128:785–797. doi: 10.1093/genetics/128.4.785. [DOI] [PMC free article] [PubMed] [Google Scholar]
- 42.Wakimoto BT, Hearn MG. The effects of chromosome rearrangements on the expression of heterochromatic genes in chromosome 2L of Drosophila melanogaster. Genetics. 1990;125:141–154. doi: 10.1093/genetics/125.1.141. [DOI] [PMC free article] [PubMed] [Google Scholar]
- 43.Clegg NJ, Honda BM, Whitehead IP, Grigliatti TA, Wakimoto B, Brock HW, Lloyd VK, Sinclair DA. Suppressors of position-effect variegation in Drosophila melanogaster affect expression of the heterochromatic gene light in the absence of a chromosome rearrangement. Genome. 1998;41:495–503. [PubMed] [Google Scholar]
- 44.Lu BY, Emtage PC, Duyf BJ, Hilliker AJ, Eissenberg JC. Heterochromatin protein 1 is required for the normal expression of two heterochromatin genes in Drosophila. Genetics. 2000;155:699–708. doi: 10.1093/genetics/155.2.699. [DOI] [PMC free article] [PubMed] [Google Scholar]
- 45.Schulze SR, Sinclair DA, Fitzpatrick KA, Honda BM. A genetic and molecular characterization of two proximal heterochromatic genes on chromosome 3 of Drosophila melanogaster. Genetics. 2005;169:2165–2177. doi: 10.1534/genetics.103.023341. [DOI] [PMC free article] [PubMed] [Google Scholar]
- 46.Yasuhara JC, Wakimoto BT. Oxymoron no more: the expanding world of heterochromatic genes. Trends Genet. 2006;22:330–338. doi: 10.1016/j.tig.2006.04.008. [DOI] [PubMed] [Google Scholar]
- 47.Swaminathan J, Baxter EM, Corces VG. The role of histone H2Av variant replacement and histone H4 acetylation in the establishment of Drosophila heterochromatin. Genes Dev. 2005;19:65–76. doi: 10.1101/gad.1259105. [DOI] [PMC free article] [PubMed] [Google Scholar]
- 48.Tschiersch B, Hofmann A, Krauss V, Dorn R, Korge G, Reuter G. The protein encoded by the Drosophila position-effect variegation suppressor gene Su(var)3-9 combines domains of antagonistic regulators of homeotic gene complexes. EMBO J. 1994;13:3822–3831. doi: 10.1002/j.1460-2075.1994.tb06693.x. [DOI] [PMC free article] [PubMed] [Google Scholar]
- 49.Gentleman RC, Carey VJ, Bates DM, Bolstad B, Dettling M, Dudoit S, Ellis B, Gautier L, Ge Y, Gentry J, et al. Bioconductor: open software development for computational biology and bioinformatics. Genome Biol. 2004;5:R80. doi: 10.1186/gb-2004-5-10-r80. [DOI] [PMC free article] [PubMed] [Google Scholar]
- 50.Lundberg LE, Figueiredo ML, Stenberg P, Larsson J. Buffering and proteolysis are induced by segmental monosomy in Drosophila melanogaster. Nucleic Acids Res. 2012;40:5926–5937. doi: 10.1093/nar/gks245. [DOI] [PMC free article] [PubMed] [Google Scholar]
- 51.Kharchenko PV, Alekseyenko AA, Schwartz YB, Minoda A, Riddle NC, Ernst J, Sabo PJ, Larschan E, Gorchakov AA, Gu T, et al. Comprehensive analysis of the chromatin landscape in Drosophila melanogaster. Nature. 2011;471:480–485. doi: 10.1038/nature09725. [DOI] [PMC free article] [PubMed] [Google Scholar]
- 52.Chintapalli VR, Wang J, Dow JA. Using FlyAtlas to identify better Drosophila melanogaster models of human disease. Nat. Genet. 2007;39:715–720. doi: 10.1038/ng2049. [DOI] [PubMed] [Google Scholar]
- 53.Graveley BR, Brooks AN, Carlson JW, Duff MO, Landolin JM, Yang L, Artieri CG, van Baren MJ, Boley N, Booth BW, et al. The developmental transcriptome of Drosophila melanogaster. Nature. 2011;471:473–479. doi: 10.1038/nature09715. [DOI] [PMC free article] [PubMed] [Google Scholar]
- 54.Brower-Toland B, Riddle NC, Jiang H, Huisinga KL, Elgin SC. Multiple SET methyltransferases are required to maintain normal heterochromatin domains in the genome of Drosophila melanogaster. Genetics. 2009;181:1303–1319. doi: 10.1534/genetics.108.100271. [DOI] [PMC free article] [PubMed] [Google Scholar]
- 55.Czermin B, Melfi R, McCabe D, Seitz V, Imhof A, Pirrotta V. Drosophila enhancer of Zeste/ESC complexes have a histone H3 methyltransferase activity that marks chromosomal Polycomb sites. Cell. 2002;111:185–196. doi: 10.1016/s0092-8674(02)00975-3. [DOI] [PubMed] [Google Scholar]
- 56.Greil F, van der Kraan I, Delrow J, Smothers JF, de Wit E, Bussemaker HJ, van Driel R, Henikoff S, van Steensel B. Distinct HP1 and Su(var)3-9 complexes bind to sets of developmentally coexpressed genes depending on chromosomal location. Genes Dev. 2003;17:2825–2838. doi: 10.1101/gad.281503. [DOI] [PMC free article] [PubMed] [Google Scholar]
- 57.Kwon SH, Workman JL. The changing faces of HP1: from heterochromatin formation and gene silencing to euchromatic gene expression: HP1 acts as a positive regulator of transcription. Bioessays. 2011;33:280–289. doi: 10.1002/bies.201000138. [DOI] [PubMed] [Google Scholar]
- 58.Eissenberg JC, James TC, Foster-Hartnett DM, Hartnett T, Ngan V, Elgin SC. Mutation in a heterochromatin-specific chromosomal protein is associated with suppression of position-effect variegation in Drosophila melanogaster. Proc. Natl Acad. Sci. USA. 1990;87:9923–9927. doi: 10.1073/pnas.87.24.9923. [DOI] [PMC free article] [PubMed] [Google Scholar]
- 59.Eissenberg JC, Morris GD, Reuter G, Hartnett T. The heterochromatin-associated protein HP1 is an essential protein in Drosophila with dosage-dependent effects on position effect variegation. Genetics. 1992;131:345–352. doi: 10.1093/genetics/131.2.345. [DOI] [PMC free article] [PubMed] [Google Scholar]
- 60.Eissenberg JC, Hartnett T. A heat shock-activated cDNA rescues the recessive lethality of mutations in the heterochromatin-associated protein HP1 of Drosophila melanogaster. Mol. Gen. Genet. 1993;240:333–338. doi: 10.1007/BF00280383. [DOI] [PubMed] [Google Scholar]
- 61.Sinclair D, Mottus R, Grigliatti T. Genes which suppress position-effect variegation in Drosophila melanogaster are clustered. Mol. Gen. Genet. 1983;191:326–333. [Google Scholar]
- 62.Haddrill PR, Waldron FM, Charlesworth B. Elevated levels of expression associated with regions of the Drosophila genome that lack crossing over. Biol. Lett. 2008;4:758–761. doi: 10.1098/rsbl.2008.0376. [DOI] [PMC free article] [PubMed] [Google Scholar]
- 63.Fanti L, Dorer DR, Berloco M, Henikoff S, Pimpinelli S. Heterochromatin protein 1 binds transgene arrays. Chromosoma. 1998;107:286–292. doi: 10.1007/s004120050310. [DOI] [PubMed] [Google Scholar]
- 64.Klattenhoff C, Xi H, Li C, Lee S, Xu J, Khurana JS, Zhang F, Schultz N, Koppetsch BS, Nowosielska A, et al. The Drosophila HP1 homolog Rhino is required for transposon silencing and piRNA production by dual-strand clusters. Cell. 2009;138:1137–1149. doi: 10.1016/j.cell.2009.07.014. [DOI] [PMC free article] [PubMed] [Google Scholar]
- 65.Halic M, Moazed D. Transposon silencing by piRNAs. Cell. 2009;138:1058–1060. doi: 10.1016/j.cell.2009.08.030. [DOI] [PMC free article] [PubMed] [Google Scholar]
- 66.Cryderman DE, Vitalini MW, Wallrath LL. Heterochromatin protein 1a is required for an open chromatin structure. Transcription. 2011;2:95–99. doi: 10.4161/trns.2.2.14687. [DOI] [PMC free article] [PubMed] [Google Scholar]
- 67.de Wit E, Greil F, van Steensel B. Genome-wide HP1 binding in Drosophila: developmental plasticity and genomic targeting signals. Genome Res. 2005;15:1265–1273. doi: 10.1101/gr.3198905. [DOI] [PMC free article] [PubMed] [Google Scholar]
- 68.Vakoc CR, Mandat SA, Olenchock BA, Blobel GA. Histone H3 lysine 9 methylation and HP1γ are associated with transcription elongation through mammalian chromatin. Mol. Cell. 2005;19:381–391. doi: 10.1016/j.molcel.2005.06.011. [DOI] [PubMed] [Google Scholar]
- 69.Maison C, Bailly D, Peters AH, Quivy JP, Roche D, Taddei A, Lachner M, Jenuwein T, Almouzni G. Higher-order structure in pericentric heterochromatin involves a distinct pattern of histone modification and an RNA component. Nat. Genet. 2002;30:329–334. doi: 10.1038/ng843. [DOI] [PubMed] [Google Scholar]
Associated Data
This section collects any data citations, data availability statements, or supplementary materials included in this article.