

Abstract
Background and Purpose
Adult rat dorsal root ganglion (DRG) neurons normally express transcripts for five isoforms of the α-subunit of voltage-gated sodium channels: NaV1.1, 1.6, 1.7, 1.8 and 1.9. Tetrodotoxin (TTX) readily blocks all but NaV1.8 and 1.9, and pharmacological agents that discriminate among the TTX-sensitive NaV1-isoforms are scarce. Recently, we used the activity profile of a panel of μ-conotoxins in blocking cloned rodent NaV1-isoforms expressed in Xenopus laevis oocytes to conclude that action potentials of A- and C-fibres in rat sciatic nerve were, respectively, mediated primarily by NaV1.6 and NaV1.7.
Experimental Approach
We used three μ-conotoxins, μ-TIIIA, μ-PIIIA and μ-SmIIIA, applied individually and in combinations, to pharmacologically differentiate the TTX-sensitive INa of voltage-clamped neurons acutely dissociated from adult rat DRG. We examined only small and large neurons whose respective INa were >50% and >80% TTX-sensitive.
Key Results
In both small and large neurons, the ability of the toxins to block TTX-sensitive INa was μ-TIIIA < μ-PIIIA < μ-SmIIIA, with the latter blocking ≳90%. Comparison of the toxin-susceptibility profiles of the neuronal INa with recently acquired profiles of rat NaV1-isoforms, co-expressed with various NaVβ-subunits in X. laevis oocytes, were consistent: NaV1.1, 1.6 and 1.7 could account for all of the TTX-sensitive INa, with NaV1.1 < NaV1.6 < NaV1.7 for small neurons and NaV1.7 < NaV1.1 < NaV1.6 for large neurons.
Conclusions and Implications
Combinations of μ-conotoxins can be used to determine the probable NaV1-isoforms underlying the INa in DRG neurons. Preliminary experiments with sympathetic neurons suggest that this approach is extendable to other neurons.
Keywords: μ-conotoxin PIIIA, μ-conotoxin SmIIIA, μ-conotoxin TIIIA, dorsal root ganglion, superior cervical ganglion, tetrodotoxin, voltage-gated sodium channel, whole-cell patch clamp
Introduction
Voltage-gated sodium channels (VGSCs) mediate action potentials in excitable tissues. VGSCs comprise a main, pore- and voltage sensor-bearing α-subunit, which alone can form a functional channel, and one or more accessory β-subunits, which modulate the expression and function of the α-subunit (Catterall et al., 2007). There are nine isoforms of α-subunits, NaV1.1 through to NaV1.9, encoded in the mammalian genome (Goldin et al., 2000). Two, NaV1.4 and 1.5, are largely expressed in skeletal and cardiac muscle, respectively, and the remaining seven are largely expressed in neurons. With the exception of NaV1.8 and 1.9, which are found almost exclusively in primary somatosensory neurons, all neuronal NaV1-isoforms are very sensitive to tetrodotoxin (TTX), the classic pore blocker of VGSCs (Catterall et al., 2005). It is of interest to obtain additional ligands that target VGSCs for a least two reasons. (i) Ligands that discriminate among the NaV1-isoforms can be used to characterize the functional roles of specific channel isoforms in a neuron or neuronal circuit, and (ii) VGSCs are potential targets for ligands that can be developed into therapeutic drugs to treat a variety of neurological disorders ranging from epilepsy to pain (Momin and Wood, 2008; Catterall, 2010; Dib-Hajj et al., 2010).
Studies on mRNA-transcript abundance show that NaV1.1, 1.6, 1.7, 1.8 and 1.9 are the major NaV1-isoforms normally expressed in adult rat dorsal root ganglion (DRG) neurons (Black et al., 1996; Rush et al., 2007; Fukuoka et al., 2008) while NaV1.3 is expressed only during early development but can be induced in adults in various pain models (Waxman et al., 1994; Dib-Hajj et al., 1999; Black et al., 2004). In broad terms, the relative transcript abundances in adult rat DRG are as follows: NaV1.1 is expressed to a limited extent in large neurons, NaV1.6 is expressed in all sizes of neurons, NaV1.7 is highly expressed in small neurons but also expressed in some large neurons, NaV1.8 is expressed in small and medium neurons, while NaV1.9 is expressed exclusively in small neurons (Dib-Hajj et al., 2010). Thus, a given DRG neuron can express more than one NaV1-isoform, and channel expression can be dynamic. This raises the issue of identifying the functional contributions of the different NaV1-isoforms in a given DRG neuron. In the present study, we used μ-conotoxins to examine this matter.
Cone snail venom contains at least four different families of peptidic toxins that target VGSCs. Three of these, δ-, ι-, μO-conotoxins act as gating modifiers (Terlau and Olivera, 2004; Fiedler et al., 2008; Lewis et al., 2012) whereas the fourth, the μ-conotoxins, act by blocking the pore of VGSCs, much like TTX but with greater NaV1-isoform selectivity (Zhang et al., 2007; 2009; 2010). Recently, we characterized the ability of a panel of 11 μ-conotoxins to block cloned NaV1.1 through to 1.8 (all from rat except NaV1.6, which was from mouse) expressed in Xenopus laevis oocytes. (None of the μ-conotoxins blocked NaV1.8.) We then tested members of the panel for their ability to block A- and C-compound action potentials (A- and C-CAPs, respectively) in rat sciatic nerve (Wilson et al., 2011). The blocking profile of the μ-conotoxins led us to conclude that the major NaV1-isoforms responsible for propagating action potentials in A- and C-fibres are, respectively, NaV1.6 and NaV1.7. Also, a contributor to C-CAPs was either or both NaV1.8 or 1.9, insofar as TTX (1–10 μM) did not obliterate C-CAPs, although it significantly attenuated their amplitudes and reduced their conduction velocities (Wilson et al., 2011).
However, susceptibility of A- and C-CAPs to VGSC antagonists provides only an indirect and qualitative indication of the identities of the underlying channels. A- and C-CAPs are meditated by fast- and slow- conducting axons of neurons with, respectively, large and small cell somas in DRG (Harper and Lawson, 1985). In the present study, we voltage clamped the soma of large and small neurons of acutely dissociated rat DRG preparations and examined the effects of three μ-conotoxins, μ-TIIIA (Lewis et al., 2007), μ-PIIIA (Shon et al., 1998) and μ-SmIIIA (West et al., 2002), which are a subset of the μ-conotoxin panel mentioned above, on the TTX-sensitive sodium current (INa) of these neurons. These μ-conotoxins were selected because they were collectively best able, at a saturating or near-saturating concentration of 10 μM, to discriminate among rat NaV1.1, 1.2, 1.6 and 1.7 exogenously expressed in X. laevis oocytes without or with NaVβ-subunit co-expression (Zhang et al., 2012). To determine the probable molecular identities of the VGSCs underlying the INa in DRG neurons, we compared the μ-conotoxin-susceptibility profiles of INa in DRG neurons with those of channels expressed in oocytes.
We also examined the effects of these toxins on adult rat superior cervical ganglion (SCG) neurons; these sympathetic cells normally express transcripts for NaV1.3, 1.6 and 1.7 (Rush et al., 2006). The effects of the aforementioned three μ-conopeptides on NaV1.3 expressed in X. laevis oocytes are known, but only in the absence of any NaVβ-subunit co-expression (Wilson et al., 2011); however, by assuming that NaVβ-subunit co-expression does not markedly affect the affinity of the three μ-conotoxins for NaV1.3, the experimental results could be reconciled with the NaV1-isoform transcripts expressed by SCG neurons.
Methods
Dissociation of DRG and SCG neurons
Use of animals in this study followed protocols approved by the University of Utah's Institutional Animal Care and Use Committee that conform to the National Institutes of Health Guide for the Care and Use of Laboratory Animals. DRG and SCG neurons of adult Sprague Dawley rats of either sex were dissociated and used as described previously for DRG neurons (Zhang et al., 2006). Briefly, rats were killed by exposure to CO2 gas and ganglia were excised and treated with collagenase followed by trypsin. Cells were mechanically dissociated by trituration, washed and suspended in L15 medium supplemented with 14 mM glucose, 1 mM CaCl2 and 10% FBS supplemented with penicillin/streptomycin. Dissociated DRG and SCG neurons were kept in suspension at 4°C for up to 3 days (Blair and Bean, 2002). All studies involving animals are reported in accordance with ARRIVE guidelines for reporting experiments involving animals (Kilkenny et al., 2010; McGrath et al., 2010).
Whole-cell patch-clamp recordings
Voltage-clamp recordings were performed with a MultiClamp 700A amplifier (Axon Instruments, Union City, CA, USA) at room temperature in a bath with a total volume of 100 μL, essentially as previously described (Zhang et al., 2006). The extracellular solution contained 140 mM NaCl, 3 mM KCl, 1 mM MgCl2, 1 mM CaCl2, 0.1 mM CdCl2, 20 mM HEPES, pH 7.3. Recording pipettes had resistances of <2 MΩ and contained 140 mM CsF, 10 mM NaCl, 1 mM EGTA, 10 HEPES, pH 7.3; and series resistance compensation was >80%. After achieving whole-cell clamp conditions, recordings were not initiated until the holding current had settled, which required >10 min; the contribution of NaV1.9, relative to that of NaV1.8, to the TTX- resistant current of DRG neurons is minimized by such a settling period (Choi et al., 2006). The membrane potential was held at −80 mV, and VGSCs channels were activated by a 50 ms test pulse to 0 mV, applied every 20 s. Current signals were low-pass filtered at 3 kHz, digitized at a sampling frequency of 10 kHz, and leak-subtracted by a P/6 protocol using in-house software written in LabVIEW (National Instruments, Austin, Texas, USA). The 0-mV test pulse was chosen because the activation I-V curves of TTX-sensitive INa and TTX-resistant INa peaked near −5 mV and 0 mV, respectively (not illustrated), close to values reported by others (Elliott and Elliott, 1993). Furthermore, when TTX-resistant point mutants of mouse NaV1.6 and human NaV1.7 were expressed in DRG neurons of NaV1.8-null mice, which allowed the channels to be identified by their resistance to TTX, the TTX-resistant sodium currents peaked near 0 and −10 mV respectively (Herzog et al., 2003). The peaks of the I-V curves for all of the aforementioned currents varied by ≤5% over a 10-mV span; thus, we used a 0-mV test pulse as a convenient compromise that we presumed would activate all of the NaV1-isoforms in DRG neurons essentially to the same extent. SCG neurons displayed I-V curves that peaked at 0 mV (not illustrated); thus, the 0-mV test pulse protocol described above was also used for SCG neurons, which have only TTX-sensitive sodium currents whose I-V curve peaks at 0 mV (Liu et al., 2012).
Toxins and their application
μ-Conotoxins were synthesized as previously described [(Wilson et al., 2011) and references therein]. TTX was obtained from Alomone Labs (Jerusalem, Israel). All toxins were dissolved in extracellular solution and applied to the neurons studied by simple bath exchange by manually applying, with a pipette, toxin solution (150 μL) at one end of the boat-shaped chamber (volume, 100 μL) while simultaneously withdrawing solution at the other end of the chamber over a time span of <20 s. (The patch electrode was used to lift the cell from the underlying substrate and position the cell near the upstream part of the chamber to ensure that the cell was fully exposed to the introduced toxin solution.) Toxin exposures were conducted in a static bath to conserve toxin, while washout of toxin was done by continuous perfusion with extracellular solution (at a rate of 0.6 mL·min−1), essentially as in previous experiments (Zhang et al., 2006; 2007). Although the method of toxin application precluded accurate measurement of the rate of onset of block, the continuous and relatively rapid (4-bath volumes·min−1) perfusion during toxin washout is expected to provide a reliable assessment of the reversibility of the toxins.
The level of TTX-resistant INa of each DRG cell was determined by perfusion with 1 μM TTX following tests with μ-conotoxins [none of which blocked TTX-resistant INa (Wilson et al., 2011)].
Estimation of the relative contributions of NaV1.1, 1.6 and 1.7 to the overall TTX-sensitive INa of individual DRG neurons from the levels of block produced by μ-TIIIA, μ-PIIIA and μ-SmIIIA
We recently examined μ-TIIIA, μ-PIIIA and μ-SmIIIA on rat NaV1.1, 1.6 and 1.7 expressed in X. laevis oocytes with and without co-expression with NaVβ-subunits (Zhang et al., 2012). From the reported Kd or IC50 values, the expected levels of block at a toxin concentration of 10 μM were calculated (see Table 2). The co-expression of NaVβ-subunits affected the percentage block, with co-expression of either β1 or β3 increasing it and co-expression of either β2 or β4 decreasing it, but in no case was the change greater than 10%. To simplify the calculations below, we used the percentage block values of NaV1-isoforms obtained without any NaVβ-subunit co-expression (see Table 2) and values <5% were set to zero. Three types of sequential toxin-application protocols were used: application of μ-TIIIA followed by μ-PIIIA (Type 1 test), or μ-PIIIA followed by μ-SmIIIA (Type 2 test), or μ-TIIIA followed by μ-PIIIA then by μ-SmIIIA (Type 3 test), and the contributions of NaV1.1, 1.6 and 1.7 to the TTX-sensitive INa were estimated, as described below.
Table 2.
Percentage block based on oocyte data of INa of NaV1.1, 1.6 or 1.7 with and without NaVβ-subunit co-expression, produced by 10 μM μ-SmIIA, μ-PIIIA or μ-TIIIAa
| μ-SmIIIA | μ-PIIIA | μ-TIIIA | ||||
|---|---|---|---|---|---|---|
| Kd (μM) | % Block at 10 μM | Kd (μM) | % Block at 10 μM | Kd/IC50b (μM) | % Block at 10 μM | |
| NaV1.1 | 0.0038 | 100 | 0.053 | 99 | 0.90b | 92 |
| +β1 | 0.0024 | 100 | 0.014 | 100 | 0.71b | 93 |
| +β2 | 0.07 | 99 | 0.14 | 99 | 1.7b | 85 |
| +β3 | 0.0023 | 100 | 0.017 | 100 | 0.48b | 95 |
| +β4 | 0.3 | 97 | 0.37 | 96 | 1.66b | 86 |
| NaV1.6 | 0.069 | 99 | 0.081 | 99 | >200 | <5 |
| +β1 | 0.046 | 100 | 0.005 | 100 | >200 | <5 |
| +β2 | 0.75 | 93 | 0.243 | 98 | >200 | <5 |
| +β3 | 0.059 | 99 | 0.009 | 100 | >200 | <5 |
| +β4 | 0.403 | 96 | 0.951 | 91 | >200 | <5 |
| NaV1.7 | 0.26 | 97 | 570 | <2 | >570 | <2 |
| +β1 | 0.13 | 99 | 570 | <2 | >570 | <2 |
| +β2 | 1.5 | 87 | 570 | <2 | >570 | <2 |
| +β3 | 0.11 | 99 | 570 | <2 | >570 | <2 |
| +β4 | 1.17 | 90 | 570 | <2 | >570 | <2 |
| +β1+β2 | 0.38 | 96 | 570 | <2 | >570 | <2 |
| +β1+β4 | 0.55 | 95 | 570 | <2 | >570 | <2 |
| +β3+β2 | 0.2 | 98 | 570 | <2 | >570 | <2 |
| +β3+β4 | 0.35 | 97 | 570 | <2 | >570 | <2 |
The abbreviations ‘fe1.1T’, ‘fe1.6T’ and ‘fe1.7T’ are the fractional efficacies of μ-TIIIA in blocking NaV1.1, 1.6 and 1.7, respectively. The same abbreviations but with the suffixes ‘P’ or ‘Sm’ (replacing ‘T’) are the corresponding fe values for μ-PIIIA and μ-SmIIIA respectively. Values of fe are as follows (cf. Table 2): for μ-TIIIA, fe1.1T = 0.92, fe1.6T <0.05 ≍ 0.0 and fe1.7T < 0.02 ≍ 0.0; for μ-PIIIA, fe1.1P = 0.99, fe1.6P = 0.99 and fe1.7P < 0.02 ≍ 0.0; and for μ-SmIIIA, fe1.1Sm = 1.00, fe1.6Sm = 0.99 and fe1.7Sm = 0.97.
The percentage of INa blocked by each of μ-TIIIA, μ-PIIIA and μ-SmIIIA is represented by %T, %P and %Sm respectively. The fraction of overall current blocked by a given μ-conotoxin is the linear sum of the percentage of each NaV1-isoform present multiplied by the fractional efficacy of that μ-conotoxin in blocking that isoform, that is:
(The third, or last, equation is listed for formality and not used.) Given these equations, %NaV1.1, %NaV1.6 and %NaV1.7 were determined as follows.
Rearranging the first equation yields,
| (1) |
Rearranging the second equation yields,
Substituting %NaV1.1 of Eqn. 1 and noting that the block of NaV1.1 by μ-TIIIA is readily reversible (Zhang et al., 2012) yields,
| (2) |
Since %NaV1.1 + %NaV1.6 + %NaV1.7 = 100%,
Substituting %NaV1.1 and %NaV1.6 from Eqns. 1 and 2,
| (3) |
When μ-TIIIA was not used (i.e. Type 2 tests), since fe1.1P = fe1.6P = 0.99,
| (4) |
Thus, the values of %NaV1.1, %NaV1.6 and %NaV1.7 were obtained from Eqns. 1, 2 and 3, respectively, in Type 1 and Type 3 tests. Values of %NaV1.7 were obtained in Type 2 tests from Eqn. 4.
(It might be noted that since the coefficients of the variables in Eqns. 1 through 4 are very close to either 1.0 or 0.0, the percentages of the different NaV1-isoforms can be simply approximated as follows: %NaV1.1 ≍ %T, %NaV1.6 ≍ %P − %T and %NaV1.7 ≍ 100% − %P.)
Because of the relative slowness of the block of the INa of DRG neurons by (10 μM) μ-SmIIIA, steady-state block was not always achieved before the cell was lost or other tests initiated. In such cases, the time course of block was fit to a single-exponential function and the calculated plateau was used as an estimate of steady-state block.
Estimation of the relative contribution of NaV1.3 to the overall INa of individual SCG neurons from the levels of block produced by μ-TIIIA, μ-PIIIA and μ-SmIIIA
These three μ-conotoxins have been tested on NaV1.3 expressed in X. laevis oocytes without co-expression of any NaVβ-subunits, where it was observed that the Kd for the block by μ-SmIIIA was 0.035 ± 0.014 μM and IC50s for the block by μ-PIIIA and μ-TIIIA were 3.2 ± 0.81 and 7.9 ± 1.9 μM respectively (Wilson et al., 2011). If it is assumed that co-expression with NaVβ-subunits does not affect the block by these toxins, then it can be calculated (by use of these Kd and IC50 values together with the equation in footnote of Table 2) that VGSCs with NaV1.3 as the α-subunit will be blocked by 100, 76 and 56% upon exposure to 10 μM μ-SmIIIA, μ-PIIIA and μ-TIIIA respectively. These percentage block values were used in the Discussion to calculate the fraction of INa in SCG neurons attributable to NaV1.3.
Data analysis
Curve fittings were done with homemade software written in LabVIEW (National Instruments). Averaged data are expressed as means with minimum and maximum observed (or calculated) values.
Results
In general, large DRG neurons have mostly TTX-sensitive INa whereas small neurons have mostly TTX-resistant INa. To more accurately measure TTX-sensitive INa of small neurons, we chose to use only small DRG neurons in which the majority of INa was TTX-sensitive – this was facilitated by visually selecting the smallest of the small DRG neurons. In total, we examined the INa of 32 small and 41 large DRG neurons by whole-cell voltage clamping as described in Methods, and the results from all of these cells are presented in Supporting Information Table S1. Cell size was quantified by electrical capacitance (Figure 1A and Supporting Information Table S1). If the cells are assumed to be spherical with a specific membrane capacitance of 1 μF·cm−2 (Hille, 2001), the calculated average diameter was 20 μm (range, 13–24 μm) for small cells and 40 μm (range, 33–54 μm) for large cells. These values are consistent with the diameters visually estimated with an eyepiece micrometer; the large cells appeared more or less spherical, while most of the small cells had an ellipsoidal appearance. A total of 21 SCG neurons were examined, and results from these cells are presented in Supporting Information Table S2; these sympathetic neurons were largely spherical, with some having stubby bumps, presumably vestigial dendrites.
Figure 1.
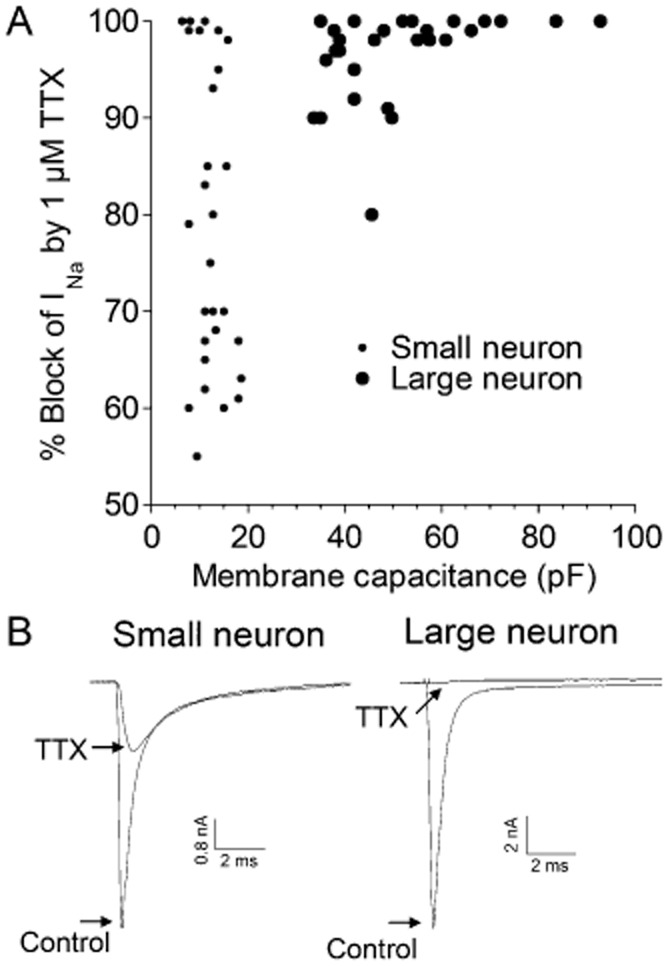
TTX-sensitivities of INa and membrane capacitances of small versus large DRG neurons. Acutely dissociated DRG neurons were whole-cell patch clamped as described in Methods, and INa was obtained by stepping the potential to 0 mV from a holding potential of −80 mV. Responses in the presence of TTX (1 μM) are those when steady-state block was achieved. (A) Percentages of peak INa blocked by TTX as a function of membrane capacitance, a reflection of cell size. Small neurons, identified as such by visual inspection under the microscope, had lower membrane capacitances than large neurons (note their mutually exclusive distributions) and broader range of TTX-sensitivitities than large neurons. (B) Examples of current traces obtained in the absence and presence of 1 μM TTX. Note, the TTX-resistant INa inactivates more slowly than the TTX-sensitive INa. Traces are from small cell 505a and large cell 309A/L1 in Supporting Information Table S1. In subsequent figures, the TTX-resistant peak INa was subtracted from total peak INa to obtain the ‘TTX-sensitive INa.’
TTX-sensitivities of large versus small DRG neurons
The percentage of INa blocked by 1 μM TTX for small cells ranged from 55 to 100% (average, 79%) and that for large cells ranged from 80 to 100% (average, 96%); the distribution of TTX-sensitivities as a function of cell size, as measured by membrane capacitance, is shown in Figure 1A. Sample recordings of INa from each of the two size classes in the absence and presence of TTX are shown in Figure 1B.
Sensitivities of large versus small DRG neurons to μ-conotoxins μ-TIIIA, μ-PIIIA and μ-SmIIIA, each applied individually to separate cells
The sodium currents of voltage-clamped neurons were challenged by μ-TIIIA, μ-PIIIA or μ-SmIIIA, with each μ-conotoxin applied at a concentration of 10 μM, as described in Methods (Figure 2). Of the small neurons, eight were tested with μ-TIIIA (which produced an average block of 6%, range 0–12%), seven with μ-PIIIA (which produced an average block of 27%, range 11–45%) and two with μ-SmIIIA (which produced an average block of 98%, range 98–99%). Of the large neurons, seven were tested with μ-TIIIA (which produced an average block of 30%, range 12–48%), eight with μ-PIIIA (which produced an average block of 78%, range 60–90%) and three with μ-SmIIIA (which produced an average block of 95%, range 94–96%). Thus, for TTX-sensitive INa of both small and large neurons, the order of level of block produced was μ-TIIIA < μ-PIIIA < μ-SmIIIA.
Figure 2.
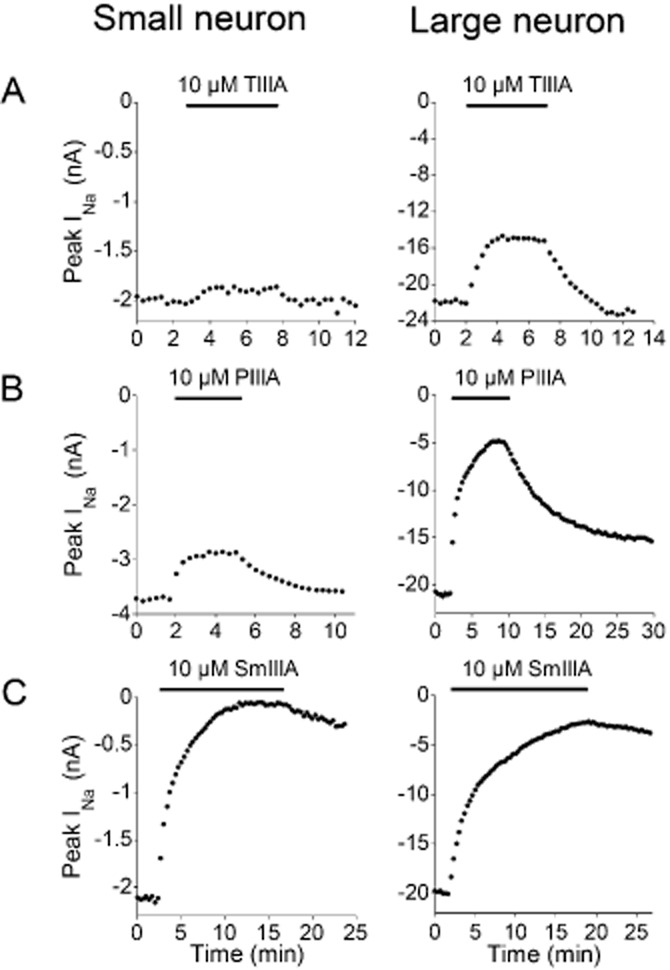
Time course of block of TTX-sensitive INa of small versus large neuron by μ-TIIIA, μ-PIIIA or μ-SmIIIA, each tested individually at a concentration of 10 μM. Recordings of INa were obtained as in Figure 1. The plots are peaks of TTX-sensitive INa obtained every 20 s before, during and after exposure to the indicated μ-conotoxin, denoted by bar at top of each plot. Each plot is an example from a different cell. (A) Block by μ-TIIIA was much less for small than large neuron, and this block was rapidly reversible for both sizes. (B) Similarly, block by μ-PIIIA was greater for large than small neuron. (C) Nearly complete block of TTX-sensitive INa was achieved with μ-SmIIIA for both small and large neurons. Data are from small neurons 504b, 621c and 621f and large neurons 622A, 504B and 428A in Supporting Information Table S1.
Figure 2A shows that the block by μ-TIIIA for both sized cells was readily reversible; this reversibility was observed in all the cells tested. The recovery from block followed single-exponential time courses with average τoff values of 0.7 ± 0.12 min (mean ± SEM, n = 4) for small cells and 1.1 ± 0.2 min (n = 5) for large cells. Thus, the block by μ-TIIIA was invariably rapidly reversible.
To be able to make more quantitative comparisons of the functional expression of the NaV1-isoforms, trials of a given cell to successive exposures to different μ-conotoxins were performed, as described below.
Sensitivities of large versus small DRG neurons to successive applications of μ-TIIIA, μ-PIIIA or μ-SmIIIA
The INa of voltage-clamped DRG neurons were also challenged by serial applications of at least two μ-conotoxins. Three sorts of serial-exposure tests were employed as detailed in Methods. An example of a trial with sequential application of all three μ-conotoxins (i.e. a Type 3 test) is presented in Figure 3. The results from Type 3, as well as those from Type 1 and Type 2 tests, are summarized in Figure 4. The general observations here are consistent with results from exposures to individual toxins described above. The INa of small neurons were minimally (7%) blocked by μ-TIIIA, somewhat more by μ- PIIIA (23%) and largely (94%) blocked by μ- SmIIIA; on the other hand, the INa of large neurons was blocked significantly by μ-TIIIA (30%) and μ-PIIIA (71%), with additional block provided by μ-SmIIIA (96%) (Figure 4A). As will be explained in the Discussion, we attribute the INa blocked by TIIIA to be due to NaV1.1, the additional INa block by PIIIA to be due to NaV1.6 and the remaining INa (which is blocked by SmIIIA) to be due to NaV1.7 (see Figure 6).
Figure 3.
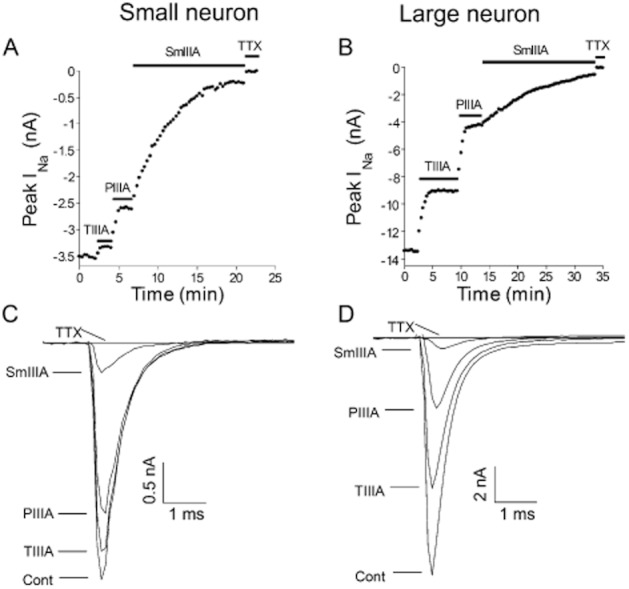
Cumulative block of TTX-sensitive INa of small versus large DRG neuron during sequential applications of μ-TIIIA, μ-PIIIA and μ-SmIIIA. Recordings of INa were obtained as in Figure 2 except the three toxins were successively applied to a given neuron (Type 3 test). (A and B) Examples of time courses of block of TTX-sensitive INa from small (A) and large (B) neurons; horizontal bar represents time during which the indicated μ-conotoxin was present. Note, block by TTX (1 μM) is 100%, reflecting that only the TTX-sensitive INa is presented in these plots. (C and D) Examples of INa traces obtained during each of the four steady-state phases in panel A (control, and during exposure to each of μ-TIIIA, μ-PIIIA and μ-SmIIIA). Data are from cells 614b/S4 and 309A/L1 in Supporting Information Table S1.
Figure 4.

Pharmacological analysis of TTX-sensitive INa of large compared to small DRG neurons by μ-TIIIA, μ-PIIIA or μ-SmIIIA. Recordings of INa were obtained as in Figures 2 and 3. (A) Average percentage block of TTX-sensitive INa by μ-TIIIA, μ-PIIIA or μ-SmIIIA. ‘Error bars’ associated with each μ-conotoxin denote the minimum and maximum % block values, which are also evident in (B). (Cell numbers, or n-values, were as follows: μ-TIIIA, 15 small and 24 large neurons; μ-PIIIA, 22 small and 30 large neurons; μ-SmIIIA, 16 small and 18 large neurons). (B) Distributions of cells with TTX-sensitive INa blocked by μ-TIIIA or μ-PIIIA in (A). μ-TIIIA had little or no effect on six of the small cells (≤5% block of INa). All large cells had some μ-TIIIA-susceptible INa, with two outliers (not included in panel A), which had an INa that was blocked by 70%. All large and small cells had μ-PIIIA-susceptible INa, but with mutually exclusive distributions of percentage INa blocked. Data are from cells listed in Supporting Information Table S1.
Figure 6.
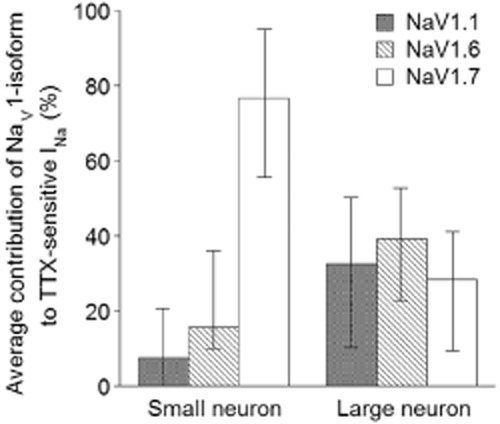
Breakdown of the contributions of NaV1.1, 1.6, and 1.7 to the TTX-sensitive INa in rat DRG neurons. Percentages of TTX-sensitive INa of small and large DRG neurons contributed by NaV1.1, 1.6 or 1.7 were calculated from μ-conotoxin-susceptibilities using Eqns. 1 through to 4 in Methods with information from Figure 4A and provided in Supporting Information Table S1. Expression levels of NaV1.1 and 1.6 were calculated from data obtained from six small and 17 large neurons involving experiments where μ-TIIIA and μ-PIIIA were successively applied (Type 1 and 3 tests), while expression levels of NaV1.7 were calculated from data obtained from 14 small and 13 large neurons involving experiments where μ-PIIIA and μ-SmIIIA were successively applied (Type 2 and 3 tests). Average percentage values are presented, with ‘error bars’ representing minimum and maximum observed values.
The distribution of the block by μ-TIIIA and μ-PIIIA of INa of individual cells are illustrated in Figure 4B. μ-TIIIA had no effect on the INa of some small cells but blocked the INa of all large cells at least to some degree. Remarkably, for two large cells, μ-TIIIA blocked 70% of the INa. μ-PIIIA had an effect on all small and large cells, with a greater effect on large, than on small, cells – so much so that the distributions did not overlap.
Sensitivity of SCG neurons to μ-TIIIA, μ-PIIIA and μ-SmIIIA applied individually or sequentially
A total of 21 sympathetic neurons were examined in experiments that paralleled those involving DRG neurons described above. When applied individually, the rank order of block of the peak INa of SCG neurons by 10 μM of each toxin was (average % block, range of % block): μ-TIIIA (11.0%, 5%–25%) < μ-PIIIA (31.0%, 22%–45%) < μ-SmIIIA (95.8%, 94%–97%), where μ-TIIIA, μ-PIIIA and μ-SmIIIA were tested on 12, 4 and 5 neurons respectively (see Supporting Information Table S2). Just as with DRG neurons, the block of SCG neurons by μ-TIIIA and μ-PIIIA was readily reversible whereas the block by SmIIIA was only slowly reversible – sample time courses of block and washout are illustrated in Supporting Information Figure S1.
SCG neurons were also tested by successive exposures to μ-TIIIA first, then μ-PIIIA, followed by μ-SmIIIA (each at 10 μM). An example of the resulting time course of block is shown in Figure 5A, and the current traces acquired during steady-state block with each toxin are shown in Figure 5B. The block of peak INa in these cases were (average % block, range of % block): μ-TIIIA (12.1%, 6%–25%), μ-PIIIA (33.6%, 11%–46%) and μ-SmIIIA (96.3%, 95%–99%), for eight neurons (see Supporting Information Table S2 for raw data). These % block values were close to the respective values without prior exposure to any μ-conotoxin (see preceding paragraph), and the results from SCG neurons exposed individually or sequentially to the three μ-conotoxins were combined and are illustrated in Figure 5C (see also Supporting Information Table S2).
Figure 5.
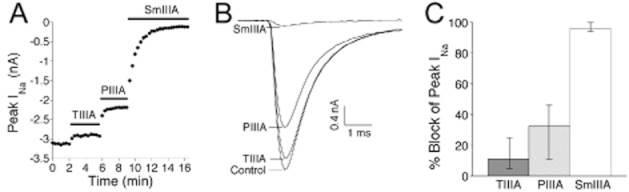
Susceptibility of INa of SCG neurons to μ-TIIIA, μ-PIIIA and μ-SmIIIA, each at 10 μM. Acutely dissociated SCG neurons were voltage-clamped as described in Methods. The experimental protocol used here essentially mimicked that of Figure 3 for DRG neurons. (A) Example of time course of block of INa of an SCG neuron during sequential application of the three μ-conotoxins; horizontal bars represent time during which indicated μ-conotoxins were present. (B) Example of INa traces obtained during each of the four steady-state phases in panel A (control, and during exposure to each of μ-TIIIA, μ-PIIIA and μ-SmIIIA). Data are from cell 1204a in Supporting Information Table S2. (C) Average percentage block of TTX-sensitive INa by μ-TIIIA, μ-PIIIA or μ-SmIIIA. ‘Error bars’ associated with each μ-conotoxin denote the minimum and maximum percentage block values. Cell numbers, or n-values, were as follows: μ-TIIIA, 12 neurons; μ-PIIIA, 12 neurons; μ-SmIIIA, 13 neurons. Data are from cells listed in Supporting Information Table S2.
Discussion and conclusions
TTX-resistant INa in small versus large DRG neurons
It has long been known that in rat DRG, small neurons express TTX-resistant INa at a higher level than do large neurons and that the TTX-resistant INa inactivates more slowly than TTX-sensitive INa (Caffrey et al., 1992; Ogata and Tatebayashi, 1992; Roy and Narahashi, 1992). Our results (Figure 1) are consistent with these reports. To be able to more accurately measure the block of TTX-sensitive INa in these experiments, we tested only small neurons in which most (i.e. >50%) of the total INa was TTX-sensitive – on visual inspection these turned out to be among the very smallest neurons.
Identification of the NaV1-isoforms corresponding to the INa of DRG neurons that are blocked by μ-TIIIA, μ-PIIIA and μ-SmIIIA
The μ-conotoxins pharmacologically differentiated the TTX-sensitive INa of rat DRG neurons into three fractions. To translate the pharmacological profiles of the INa into the molecular species of VGSCs, we employed our recently acquired μ-conotoxin-susceptibility profiles of rat NaV1-isoforms co-expressed with NaVβ-subunits in X. laevis oocytes (Zhang et al., 2012). Table 2 shows the expected block of NaV1.1, 1.6 and 1.7, expressed in oocytes, by the three μ-conotoxins at a concentration of 10 μM. This concentration is sufficiently removed from the Kd and IC50 values (regardless of NaVβ-subunit co-expression) that an almost all-or-none block is expected of each toxin-channel combination. Equations 1 through to 4 in Methods take into account the almost factor to provide more accurate estimates of the percentages of the channels involved.
Thus, the information in Table 2 was used to translate the results in Table 1 to produce Table 3, which shows the predicted levels of NaV1.1, 1.6, 1.7 and 1.8 in several small and large neurons. Likewise, the data in Figure 4A was translated to produce Figure 6, which shows the average percentage contributions of NaV1.1, 1.6 and 1.7 to the TTX-sensitive INa from many small and large neurons.
Table 1.
Pharmacological fractionation of the TTX-sensitive INa of five small and nine large neurons from rat DRG by successive exposures to 10 μM each of μ-TIIIA, μ-PIIIA and lastly μ-SmIIIA (Type 3 tests)
| % Blockd of INa by | |||||
|---|---|---|---|---|---|
| Cella | Capacitanceb (pF) | TTX-s INac (%) | μ-TIIIA | μ-PIIIA | μ-SmIIIA |
| S1 | 12.8 | 93 | 19 | 40 | 97 |
| S2 | 15.7 | 85 | 0 | 10 | 93 |
| S3 | 10 | 99 | 18 | 30 | 90 |
| S4 | 18.6 | 63 | 13 | 28 | 95 |
| S5 | 12.3 | 75 | 0 | 10 | 88 |
| Ave. | 13.88 | 83 | 10 | 24 | 93 |
| L1 | 37.8 | 99 | 37 | 70 | 97 |
| L2 | 83.7 | 100 | 17 | 58 | 95 |
| L3 | 92.8 | 100 | 30 | 72 | 96 |
| L4 | 57 | 99 | 23 | 70 | 94 |
| L5 | 49.8 | 90 | 35 | 88 | 97 |
| L6 | 66 | 99 | 45 | 85 | 95 |
| L7 | 39 | 98 | 40 | 65 | 95 |
| L8 | 57.5 | 98 | 38 | 77 | 99 |
| L9 | 69 | 100 | 37 | 70 | 97 |
| Ave. | 61.4 | 98 | 34 | 73 | 96 |
Prefix ‘S’ or ‘L’ indicates small or large neuron (cells corresponding to these are identified in Supporting Information Table S1).
Electrical capacitance of cell.
Percentage of total INa that was TTX-sensitive.
Percentage of TTX-sensitive INa blocked by 10 μM of the indicated μ-conotoxin in Type 3 tests (see Methods).
Table 3.
Predicted contributions of NaV1-isoforms to TTX-sensitive INa (left) and total INa (right) of small and large DRG neurons
| TTX-sensitive INa | Total INa | ||||||
|---|---|---|---|---|---|---|---|
| % Contributionb by: | % Contributionc by: | ||||||
| Cella | NaV1.1 | NaV1.6 | NaV1.7 | NaV1.1 | NaV1.6 | NaV1.7 | NaV1.8 |
| S1 | 21 | 20 | 59 | 19 | 19 | 55 | 7 |
| S2 | 0 | 10 | 90 | 0 | 9 | 76 | 15 |
| S3 | 19 | 11 | 70 | 19 | 11 | 69 | 1 |
| S4 | 14 | 14 | 72 | 9 | 9 | 45 | 37 |
| S5 | 0 | 10 | 90 | 0 | 8 | 67 | 25 |
| L1 | 40 | 31 | 29 | 39 | 31 | 29 | 1 |
| L2 | 19 | 40 | 41 | 19 | 40 | 41 | 0 |
| L3 | 33 | 40 | 27 | 33 | 40 | 27 | 0 |
| L4 | 25 | 46 | 29 | 25 | 45 | 29 | 1 |
| L5 | 38 | 51 | 11 | 34 | 46 | 10 | 10 |
| L6 | 49 | 37 | 14 | 48 | 37 | 14 | 1 |
| L7 | 44 | 22 | 34 | 43 | 22 | 33 | 2 |
| L8 | 41 | 37 | 22 | 40 | 36 | 22 | 2 |
| L9 | 40 | 31 | 29 | 40 | 31 | 29 | 0 |
Numbering of small (S) and large (L) neurons of Table 1 is retained.
Contribution of the indicated NaV1-isoform to the TTX-sensitive INa of the cell, calculated from data in Tables 1 and 2 with Eqns. 1, 2, 3 & 4 in Methods.
Percentage block data for each cell in the left half of this table were normalized to obtain the relative contributions of the NaV1-isoforms to the total INa of each cell, with TTX-resistant INa attributed to the TTX-resistant isoform NaV1.8 (Methods).
The results, taken as whole, provide the following overall picture: NaV1.1, 1.6 and 1.7 are functionally expressed by all large and most small neurons. NaV1.7 predominates in small neurons, but the levels of all three NaV1-isoforms are rather similar in large neurons. The results from individual cells show that the relative levels of a given NaV1-isoform can vary over a large range. This is particularly evident in small cells for NaV1.1 and NaV1.8, where two of five cells expressed no detectable levels of NaV1.1 (i.e. μ-TIIIA produced no block) and the levels of NaV1.8 ranged from essentially 0 to 37% (Tables 1 and 3). It is well known (e.g. Elliott and Elliott, 1993) that the relative contribution of TTX-resistant channels of small cells can vary over a wide range just as we found (Figure 1A); in view of this precedent, our observed variation in relative levels of the different TTX-sensitive NaV1-isoforms is not unexpected.
Possible involvement of NaV1.2 or 1.3 in DRG neurons
μ-TIIIA also potently blocks NaV1.2 expressed in oocytes; however, the recovery from block of NaV1.2 (τoff = 37–100 min) was more than an order of magnitude slower than that of NaV1.1 (τoff = 1–2 min) (the range of τoff values encompass the variation due to co-expression of NaVβ1-β4) (Zhang et al., 2012). Thus, the uniformly rapid reversibility of the block of INa in DRG by μ-TIIIA (e.g. Figure 2A) is consistent with the block of NaV1.1, but not that of NaV1.2. By this criterion, NaV1.2 does not appear to be functionally expressed in any of the DRG neurons we examined.
NaV1.3 was not considered in our assessment because, as noted in the Introduction, its transcript is not present in DRG of normal animals. A μ-conotoxin is not available yet that has sufficient specificity towards NaV1.3 to evaluate its contribution in experiments such as those reported above.
Identification of the NaV1-isoforms corresponding to the INa of SCG neurons that are blocked by μ-TIIIA, μ-PIIIA and μ-SmIIIA
A limitation of our approach is that the conversion of μ-conotoxin susceptibility into NaV1-isoform identity depends critically on the assumption that the quantitative μ-conotoxin pharmacology of VGSCs exogenously expressed in X. laevis oocytes can be applied to endogenous channels in DRG neurons. This assumption remains to be validated. In an attempt to at least partially address this matter, we tested the three μ-conotoxins on SCG neurons, which express transcripts for NaV1.3, 1.6 and 1.7 (Rush et al., 2006). In other words, SCG neurons express NaV1.3 unlike DRG neurons, which express NaV1.1. Based on oocyte data, 10 μM μ-TIIIA is anticipated to block only 56% of NaV1.3 (see penultimate paragraph in Methods) in comparison to ≥85% block of NaV1.1 (Table 2). Use of μ-TIIIA at a concentration near its IC50 value for NaV1.3 may be expected to yield more variable results than when used at saturating or near-saturating concentrations; however, at the latter concentrations μ-TIIIA would start to block NaV1.6, and as a compromise we tested SCG neurons with 10 μM μ-TIIIA (the same concentrations as used on DRG neurons).
Exposure of SCG neurons to 10 μM μ-TIIIA alone blocked an average of 11% of the INa (n = 12 neurons (see Figure 5C and Supporting Information Table S2). Since 10 μM μ-TIIIA negligibly blocks NaV1.6 and 1.7 expressed in oocytes (by <5%, Table 2), this suggests that 11%/0.56, or 19.6%, of the overall INa in SCG neurons involved NaV1.3. (For the value of 0.56 in the divisor, see penultimate paragraph of Methods).
Exposure of SCG neurons to 10 μM μ-PIIIA blocked an average of 32.8% of the INa (n = 12 neurons, Figure 5C and Supporting Information Table S2). Assuming 19.6% of the overall INa is due to NaV1.3 (see preceding paragraph), of which μ-PIIIA might be expected to block 76% (see penultimate paragraph of Methods), we surmise that 19%•0.76, or 14.4%, of the INa blocked by μ-PIIIA could be attributed to NaV1.3. This leaves 32.8% minus 14.4%, or 18.4%, of the overall INa to be likely to be due to NaV1.6, assuming NaV1.6 to be largely blocked by μ-PIIIA (Table 2).
The remaining INa, 100% minus 18.4% (due to NaV1.6) minus 19.6% (due to NaV1.3), which equals 62%, was presumably due to NaV1.7. Exposure to 10 μM μ-SmIIIA blocked an average of 96.1% of the INa (n = 13 neurons, Figure 5C and Supporting Information Table S2). This high, but incomplete, block by 10 μM SmIIIA is consistent with its behaviour in the oocyte expression system, where 10 μM μ-SmIIIA blocked NaV1.3 by 100% (see penultimate paragraph of Methods), NaV1.6 by 93 to 100% and NaV1.7 by 87 to 99% (Table 2). Thus, we propose that the percentage contributions to the overall INa of SCG neurons are approximately as follows: 20% by NaV1.3, 20% by NaV1.6 and 60% by NaV1.7. Essentially, the same percentage contributed by each NaV1-isoform was found by confining the data to only the eight SCG neurons that had been sequentially exposed to μ-TIIIA, μ-PIIIA and μ-SmIIIA (Supporting Information Table S3).
Our overall conclusions regarding SCG neurons (albeit preliminary because we have yet to ascertain the effects of NaVβ-subunit co-expression on the activities of the μ-conotoxins against NaV1.3) are consistent with our conclusions regarding DRG neurons.
It should be noted that the VGSC kinetics of SCG neurons were slower than that for both large and small DRG neurons (compare Figure 5B with Figure 3C and D). This difference in gating kinetics was also observed with neurons isolated from DRG and SCG from the same animal and tested essentially at the same time (not illustrated). NaVβ-subunits and other factors can affect channel gating (for recent reviews see Dib-Hajj and Waxman, 2010; Brackenbury and Isom, 2011; Chahine and O'Leary, 2011), and these might differ between SCG and DRG neurons, a possibility that awaits further examination.
Other limitations of the results
Another limitation of our results is that they inform us of the NaV1-isoforms only in the plasma membrane of cell soma and not of axons and their termini. There is good electrophysiological evidence in primary sensory neurons for non-homogeneous distribution of TTX-resistant channels between soma and axon (Villière and McLachlan, 1996), and even between axon and its peripheral termini (Brock et al., 1998; Strassman and Raymond, 1999).
A third limitation of our findings is that the reason(s) underlying the large variation in apparent relative expression levels of the various NaV1-isoforms within a DRG cell-size class (Tables 1 and 3) have not been determined. It is possible that the observed heterogeneity is a consequence of the trauma the neurons experienced during dissociation. However, we suggest that the neurons may be inherently heterogeneous in the expression of the different molecular species of VGSCs because the neurons within each size class we examined belonged to different subclasses. Now that we have established the feasibility of pharmacologically fractionating the INa of DRG neurons, further work with DRG neurons belonging to more stringently defined subclasses is called for. For example, restricting the analyses to DRG neurons associated with either specific cell markers (Snape et al., 2010), identified peripheral targets (Light et al., 2008), specific sensory modalities (Teichert et al., 2012), or a combination of these restrictions.
Variability in the levels of functional expression of the various NaV1-isoforms was also apparent with SCG neurons (Figure 5 and Supporting Information Table S2). This variability may reflect experimental error, insofar as μ-TIIIA and μ-PIIIA were used at a concentration near their IC50s for NaV1.3; that is, near the steep part of their dose-response curves.
The observed results with DRG neurons in relation to other studies
In general, our results agree well with those of other types of studies. Adult DRG express messages for NaV1.1, 1.6, 1.7, 1.8 and 1.9 (Rush et al., 2007), and the major transcripts (in 1-week old rats) of small DRG neurons were NaV1.7, 1.8 and 1.9, whereas those for large neurons were NaV1.1, 1.6 and 1.7 (Ho and O'Leary, 2011). Expression of NaV1.2 transcripts by DRG neurons has been reported (Black et al., 1996; Ho and O'Leary, 2011); however, the functional expression of NaV1.2 in the small and large neurons we examined appeared to be ruled out as mentioned above.
Immunohistochemistry has revealed that NaV1.6 is present at nodes of Ranvier of all the peripheral myelinated axons, both motor and sensory, examined (Caldwell et al., 2000). This is consistent with our previous results regarding the μ-conotoxin susceptibility of A-CAPs in rat sciatic nerve (Wilson et al., 2011) as well as our present results that NaV1.6 is associated with INa of large DRG neurons, insofar as large somas have axons with fast conduction velocities indicative of myelinated fibres (Harper and Lawson, 1985). Of interest in this regard is the observation that the INa of most of the 26 large neurons tested with μ-TIIIA were susceptible to the peptide, including two neurons where the major fraction (70%) of the INa was blocked by μ-TIIIA (Figure 4B), indicating that NaV1.1 can be the dominant channel is some large cells. As shown in Table 3, all nine large neurons examined had significant levels (≍20%) of functional expression of NaV1.1. This raises the question of whether and where might NaV1.1 be in axons of large neurons.
Results from an immunohistochemical study demonstrated that both NaV1.1 and NaV1.6 are present at nodes of Ranvier of mouse CNS axons; in contrast, NaV1.6, but not NaV1.1, was observed in nodes of axons of dorsal and ventral roots (Duflocq et al., 2008). This study also showed that motoneurons express NaV1.1 non-uniformly in their initial axon segments, with a higher density located proximally than distally, and the converse pattern of expression was observed for NaV1.6. The initial segment of DRG neurons is not where action potentials are (normally) initiated (see Amir and Devor, 2003), so similar variations in NaV1.1 and 1.6 densities as that of motoneurons might not necessarily be expected. NaV1.1 immunolabelling (unlike that of NaV1.6, 1.7, 1.8 and 1.9) was absent at peripheral free nerve endings in adult rat skin (Persson et al., 2010). Whether NaV1.1 is located at central axon terminals of DRG neurons remains, as far as we are aware, to be determined.
Table 3 and Figure 6 suggest that NaV1.7 can be functionally expressed by all DRG neurons, both large and small. Our previous results with C-CAPs of rat sciatic nerve indicated that NaV1.7 was the major isoform responsible for propagation of action potentials in unmyelinated axons, but the methods used were too coarse to determine its possible contribution to A-CAPs, which are mediated by myelinated axons (Wilson et al., 2011).
Our results provide a strong incentive to examine the specific roles and locations of the non-dominant NaV1-isoforms in the processes of both small and large DRG neurons. It would be interesting in future studies to quantify the functional contributions of specific NaV1-isoforms in intermediate-sized DRG neurons as well. Recent efforts in various laboratories to identify the molecular determinants for NaV1-isoform specificity as well as obtain μ-conotoxins with improved selectivity have produced encouraging results (Leipold et al., 2011; McArthur et al., 2011; Van Der Haegen et al., 2011) and bode well for future work in pharmacologically fractionating sodium currents with μ-conotoxins.
Conclusion
μ-Conotoxins provide evidence for the functional expression of three TTX-sensitive NaV1-isoforms in both small and large DRG neurons as well as in SCG neurons. To our knowledge, this is the first attempt to quantitatively assess the relative contributions of specific NaV1-isoforms to the TTX-sensitive INa of individual neurons in any preparation.
Acknowledgments
We thank Dr. Jozsef Gulyas and William Low for peptide synthesis and characterization.
This work was supported by the National Institutes of Health grant GM 48677 to G.B., B.M.O., J.E.R. and D.Y.
Glossary
- CAP
compound action potential
- DRG
dorsal root ganglion
- INa
sodium current
- μ-PIIIA
μ-conotoxin PIIIA from Conus pururascens
- μ-SmIIIA
μ-conotoxin SmIIIA from Conus stercusmuscarum
- μ-TIIIA
μ-conotoxin TIIIA from Conus tulipa
- NaV1
α-subunit of voltage-gated sodium channel
- NaVβ
β-subunit of voltage-gated sodium channel
- SCG
superior cervical ganglion
- TTX
tetrodotoxin
- VGSC
voltage-gated sodium channel
Conflict of interest
B.M.O. is a co-founder of Cognetix, Inc. and G.B. is a co-founder of NeuroAdjuvants, Inc.
Supporting information
Additional Supporting Information may be found in the online version of this article at the publisher's web-site:
Figure S1 Time course of block of INa of SCG neurons by μ-TIIIA, μ-PIIIA or μ-SmIIIA, each tested individually at a concentration of 10 μM. Recordings of INa were acquired as described in Methods. These experiments parallel those illustrated in Figure 2 for DRG neurons. Plotted are peaks of INa obtained every 20 s before, during, and after exposure to indicated μ-conotoxin, denoted by bar at top of each plot. Each plot is an example from a different cell. Nearly complete block of INa was achieved by μ-SmIIIA, whose reversibility was much slower than those of the other two μ-conotoxins. Data are from neurons 1203c, 1204d and 2104b in Supporting Information Table S2.
Table S1 Properties of 32 small neurons (left eight columns) and 41 large neurons (right eight columns), including their toxin sensitivities. All DRG neurons used in this study are represented.
Table S2 Properties of 21 SCG neurons tested for their μ-conotoxin sensitivities. All SCG neurons used in this study are represented.
Table S3 Predicted contributions of NaV1-isoforms to INa of SCG neuronsa.
References
- Amir R, Devor M. Electrical excitability of the soma of sensory neurons is required for spike invasion of the soma, but not for through-conduction. Biophys J. 2003;84:2181–2191. doi: 10.1016/S0006-3495(03)75024-3. [DOI] [PMC free article] [PubMed] [Google Scholar]
- Black JA, Dib-Hajj S, McNabola K, Jeste S, Rizzo MA, Kocsis JD, et al. Spinal sensory neurons express multiple sodium channel alpha-subunit mRNAs. Brain Res Mol Brain Res. 1996;43:117–131. doi: 10.1016/s0169-328x(96)00163-5. [DOI] [PubMed] [Google Scholar]
- Black JA, Liu S, Tanaka M, Cummins TR, Waxman SG. Changes in the expression of tetrodotoxin-sensitive sodium channels within dorsal root ganglia neurons in inflammatory pain. Pain. 2004;108:237–247. doi: 10.1016/j.pain.2003.12.035. [DOI] [PubMed] [Google Scholar]
- Blair NT, Bean BP. Roles of tetrodotoxin (TTX)-sensitive Na+ current, TTX-resistant Na+ current, and Ca2+ current in the action potentials of nociceptive sensory neurons. J Neurosci. 2002;22:10277–10290. doi: 10.1523/JNEUROSCI.22-23-10277.2002. [DOI] [PMC free article] [PubMed] [Google Scholar]
- Brackenbury WJ, Isom LL. Na channel β subunits: overachievers of the ion channel family. Front Pharmacol. 2011;2:53. doi: 10.3389/fphar.2011.00053. [DOI] [PMC free article] [PubMed] [Google Scholar]
- Brock JA, McLachlan E, Belmonte C. Tetrodotoxin-resistant impulses in single nociceptor nerve terminals in guinea-pig cornea. J Physiol (Lond) 1998;512(Pt 1):211–217. doi: 10.1111/j.1469-7793.1998.211bf.x. [DOI] [PMC free article] [PubMed] [Google Scholar]
- Caffrey JM, Eng DL, Black JA, Waxman SG, Kocsis JD. Three types of sodium channels in adult rat dorsal root ganglion neurons. Brain Res. 1992;592:283–297. doi: 10.1016/0006-8993(92)91687-a. [DOI] [PubMed] [Google Scholar]
- Caldwell JH, Schaller KL, Lasher RS, Peles E, Levinson SR. Sodium channel Na(v)1.6 is localized at nodes of ranvier, dendrites, and synapses. Proc Natl Acad Sci U S A. 2000;97:5616–5620. doi: 10.1073/pnas.090034797. [DOI] [PMC free article] [PubMed] [Google Scholar]
- Catterall WA. Ion channel voltage sensors: structure, function, and pathophysiology. Neuron. 2010;67:915–928. doi: 10.1016/j.neuron.2010.08.021. [DOI] [PMC free article] [PubMed] [Google Scholar]
- Catterall WA, Goldin AL, Waxman SG. International Union of Pharmacology. XLVII. Nomenclature and structure-function relationships of voltage-gated sodium channels. Pharmacol Rev. 2005;57:397–409. doi: 10.1124/pr.57.4.4. [DOI] [PubMed] [Google Scholar]
- Catterall WA, Cestele S, Yarov-Yarovoy V, Yu FH, Konoki K, Scheuer T. Voltage-gated ion channels and gating modifier toxins. Toxicon. 2007;49:124–141. doi: 10.1016/j.toxicon.2006.09.022. [DOI] [PubMed] [Google Scholar]
- Chahine M, O'Leary ME. Regulatory role of voltage-gated Na channel β subunits in sensory neurons. Front Pharmacol. 2011;2:70. doi: 10.3389/fphar.2011.00070. [DOI] [PMC free article] [PubMed] [Google Scholar]
- Choi JS, Hudmon A, Waxman SG, Dib-Hajj SD. Calmodulin regulates current density and frequency-dependent inhibition of sodium channel Nav1.8 in DRG neurons. J Neurophysiol. 2006;96:97–108. doi: 10.1152/jn.00854.2005. [DOI] [PubMed] [Google Scholar]
- Dib-Hajj SD, Waxman SG. Isoform-specific and pan-channel partners regulate trafficking and plasma membrane stability; and alter sodium channel gating properties. Neurosci Lett. 2010;486:84–91. doi: 10.1016/j.neulet.2010.08.077. [DOI] [PubMed] [Google Scholar]
- Dib-Hajj SD, Fjell J, Cummins TR, Zheng Z, Fried K, LaMotte R, et al. Plasticity of sodium channel expression in DRG neurons in the chronic constriction injury model of neuropathic pain. Pain. 1999;83:591–600. doi: 10.1016/S0304-3959(99)00169-4. [DOI] [PubMed] [Google Scholar]
- Dib-Hajj SD, Cummins TR, Black JA, Waxman SG. Sodium channels in normal and pathological pain. Annu Rev Neurosci. 2010;33:325–347. doi: 10.1146/annurev-neuro-060909-153234. [DOI] [PubMed] [Google Scholar]
- Duflocq A, Le Bras B, Bullier E, Couraud F, Davenne M. Nav1.1 is predominantly expressed in nodes of Ranvier and axon initial segments. Mol Cell Neurosci. 2008;39:180–192. doi: 10.1016/j.mcn.2008.06.008. [DOI] [PubMed] [Google Scholar]
- Elliott AA, Elliott JR. Characterization of TTX-sensitive and TTX-resistant sodium currents in small cells from adult rat dorsal root ganglia. J Physiol (Lond) 1993;463:39–56. doi: 10.1113/jphysiol.1993.sp019583. [DOI] [PMC free article] [PubMed] [Google Scholar]
- Fiedler B, Zhang MM, Buczek O, Azam L, Bulaj G, Norton RS, et al. Specificity, affinity and efficacy of iota-conotoxin RXIA, an agonist of voltage-gated sodium channels Na(V)1.2, 1.6 and 1.7. Biochem Pharmacol. 2008;75:2334–2344. doi: 10.1016/j.bcp.2008.03.019. [DOI] [PMC free article] [PubMed] [Google Scholar]
- Fukuoka T, Kobayashi K, Yamanaka H, Obata K, Dai Y, Noguchi K. Comparative study of the distribution of the alpha-subunits of voltage-gated sodium channels in normal and axotomized rat dorsal root ganglion neurons. J Comp Neurol. 2008;510:188–206. doi: 10.1002/cne.21786. [DOI] [PubMed] [Google Scholar]
- Goldin AL, Barchi RL, Caldwell JH, Hofmann F, Howe JR, Hunter JC, et al. Nomenclature of voltage-gated sodium channels. Neuron. 2000;28:365–368. doi: 10.1016/s0896-6273(00)00116-1. [DOI] [PubMed] [Google Scholar]
- Harper AA, Lawson SN. Conduction velocity is related to morphological cell type in rat dorsal root ganglion neurones. J Physiol. 1985;359:31–46. doi: 10.1113/jphysiol.1985.sp015573. [DOI] [PMC free article] [PubMed] [Google Scholar]
- Herzog RI, Cummins TR, Ghassemi F, Dib-Hajj SD, Waxman SG. Distinct repriming and closed-state inactivation kinetics of Nav1.6 and Nav1.7 sodium channels in mouse spinal sensory neurons. J Physiol (Lond) 2003;551(Pt 3):741–750. doi: 10.1113/jphysiol.2003.047357. [DOI] [PMC free article] [PubMed] [Google Scholar]
- Hille B. Ion Channels of Excitable Membranes. 3rd edn. Sunderland, MA: Sinauer Associates; 2001. [Google Scholar]
- Ho C, O'Leary ME. Single-cell analysis of sodium channel expression in dorsal root ganglion neurons. Mol Cell Neurosci. 2011;46:159–166. doi: 10.1016/j.mcn.2010.08.017. [DOI] [PMC free article] [PubMed] [Google Scholar]
- Kilkenny C, Browne W, Cuthill IC, Emerson M, Altman DG. NC3Rs Reporting Guidelines Working Group. Br J Pharmacol. 2010;160:1577–1579. doi: 10.1111/j.1476-5381.2010.00872.x. [DOI] [PMC free article] [PubMed] [Google Scholar]
- Leipold E, Markgraf R, Miloslavina A, Kijas M, Schirmeyer J, Imhof D, et al. Molecular determinants for the subtype specificity of μ-conotoxin SIIIA targeting neuronal voltage-gated sodium channels. Neuropharmacology. 2011;61:105–111. doi: 10.1016/j.neuropharm.2011.03.008. [DOI] [PubMed] [Google Scholar]
- Lewis RJ, Schroeder CI, Ekberg J, Nielsen KJ, Loughnan M, Thomas L, et al. Isolation and structure-activity of mu-conotoxin TIIIA, a potent inhibitor of tetrodotoxin-sensitive voltage-gated sodium channels. Mol Pharmacol. 2007;71:676–685. doi: 10.1124/mol.106.028225. [DOI] [PubMed] [Google Scholar]
- Lewis RJ, Dutertre S, Vetter I, Christie MJ. Conus venom peptide pharmacology. Pharmacol Rev. 2012;64:259–298. doi: 10.1124/pr.111.005322. [DOI] [PubMed] [Google Scholar]
- Light AR, Hughen RW, Zhang J, Rainier J, Liu Z, Lee J. Dorsal root ganglion neurons innervating skeletal muscle respond to physiological combinations of protons, ATP, and lactate mediated by ASIC, P2X, and TRPV1. J Neurophysiol. 2008;100:1184–1201. doi: 10.1152/jn.01344.2007. [DOI] [PMC free article] [PubMed] [Google Scholar]
- Liu P, Jo S, Bean BP. Modulation of neuronal sodium channels by the sea anemone peptide BDS-I. J Neurophysiol. 2012;107:3155–3167. doi: 10.1152/jn.00785.2011. [DOI] [PMC free article] [PubMed] [Google Scholar]
- McArthur JR, Singh G, McMaster D, Winkfein R, Tieleman DP, French RJ. Interactions of key charged residues contributing to selective block of neuronal sodium channels by μ-conotoxin KIIIA. Mol Pharmacol. 2011;80:573–584. doi: 10.1124/mol.111.073460. [DOI] [PubMed] [Google Scholar]
- McGrath J, Drummond G, McLachlan E, Kilkenny C, Wainwright C. Guidelines for reporting experiments involving animals: the ARRIVE guidelines. Br J Pharmacol. 2010;160:1573–1576. doi: 10.1111/j.1476-5381.2010.00873.x. [DOI] [PMC free article] [PubMed] [Google Scholar]
- Momin A, Wood JN. Sensory neuron voltage-gated sodium channels as analgesic drug targets. Curr Opin Neurobiol. 2008;18:383–388. doi: 10.1016/j.conb.2008.08.017. [DOI] [PubMed] [Google Scholar]
- Ogata N, Tatebayashi H. Ontogenic development of the TTX-sensitive and TTX-insensitive Na+ channels in neurons of the rat dorsal root ganglia. Brain Res Dev Brain Res. 1992;65:93–100. doi: 10.1016/0165-3806(92)90012-l. [DOI] [PubMed] [Google Scholar]
- Persson A-K, Black JA, Gasser A, Cheng X, Fischer TZ, Waxman SG. Sodium-calcium exchanger and multiple sodium channel isoforms in intra-epidermal nerve terminals. Mol Pain. 2010;6:84. doi: 10.1186/1744-8069-6-84. [DOI] [PMC free article] [PubMed] [Google Scholar]
- Roy ML, Narahashi T. Differential properties of tetrodotoxin-sensitive and tetrodotoxin-resistant sodium channels in rat dorsal root ganglion neurons. J Neurosci. 1992;12:2104–2111. doi: 10.1523/JNEUROSCI.12-06-02104.1992. [DOI] [PMC free article] [PubMed] [Google Scholar]
- Rush AM, Dib-Hajj SD, Liu S, Cummins TR, Black JA, Waxman SG. A single sodium channel mutation produces hyper- or hypoexcitability in different types of neurons. Proc Natl Acad Sci U S A. 2006;103:8245–8250. doi: 10.1073/pnas.0602813103. [DOI] [PMC free article] [PubMed] [Google Scholar]
- Rush AM, Cummins TR, Waxman SG. Multiple sodium channels and their roles in electrogenesis within dorsal root ganglion neurons. J Physiol. 2007;579(Pt 1):1–14. doi: 10.1113/jphysiol.2006.121483. [DOI] [PMC free article] [PubMed] [Google Scholar]
- Shon KJ, Olivera BM, Watkins M, Jacobsen RB, Gray WR, Floresca CZ, et al. mu-Conotoxin PIIIA, a new peptide for discriminating among tetrodotoxin-sensitive Na channel subtypes. J Neurosci. 1998;18:4473–4481. doi: 10.1523/JNEUROSCI.18-12-04473.1998. [DOI] [PMC free article] [PubMed] [Google Scholar]
- Snape A, Pittaway JF, Baker MD. Excitability parameters and sensitivity to anemone toxin ATX-II in rat small diameter primary sensory neurones discriminated by Griffonia simplicifolia isolectin IB4. J Physiol. 2010;588(Pt 1):125–137. doi: 10.1113/jphysiol.2009.181107. [DOI] [PMC free article] [PubMed] [Google Scholar]
- Strassman AM, Raymond SA. Electrophysiological evidence for tetrodotoxin-resistant sodium channels in slowly conducting dural sensory fibers. J Neurophysiol. 1999;81:413–424. doi: 10.1152/jn.1999.81.2.413. [DOI] [PubMed] [Google Scholar]
- Teichert RW, Raghuraman S, Memon T, Cox JL, Foulkes T, Rivier JE, et al. Characterization of two neuronal subclasses through constellation pharmacology. Proc Natl Acad Sci U S A. 2012;109:12758–12763. doi: 10.1073/pnas.1209759109. [DOI] [PMC free article] [PubMed] [Google Scholar]
- Terlau H, Olivera BM. Conus venoms: a rich source of novel ion channel-targeted peptides. Physiol Rev. 2004;84:41–68. doi: 10.1152/physrev.00020.2003. [DOI] [PubMed] [Google Scholar]
- Van Der Haegen A, Peigneur S, Tytgat J. Importance of position 8 in mu-conotoxin KIIIA for voltage-gated sodium channel selectivity. FEBS J. 2011;278:3408–3418. doi: 10.1111/j.1742-4658.2011.08264.x. [DOI] [PubMed] [Google Scholar]
- Villière V, McLachlan EM. Electrophysiological properties of neurons in intact rat dorsal root ganglia classified by conduction velocity and action potential duration. J Neurophysiol. 1996;76:1924–1941. doi: 10.1152/jn.1996.76.3.1924. [DOI] [PubMed] [Google Scholar]
- Waxman SG, Kocsis JD, Black JA. Type III sodium channel mRNA is expressed in embryonic but not adult spinal sensory neurons, and is reexpressed following axotomy. J Neurophysiol. 1994;72:466–470. doi: 10.1152/jn.1994.72.1.466. [DOI] [PMC free article] [PubMed] [Google Scholar]
- West PJ, Bulaj G, Garrett JE, Olivera BM, Yoshikami D. Mu-conotoxin SmIIIA, a potent inhibitor of tetrodotoxin-resistant sodium channels in amphibian sympathetic and sensory neurons. Biochemistry. 2002;41:15388–15393. doi: 10.1021/bi0265628. [DOI] [PubMed] [Google Scholar]
- Wilson MJ, Yoshikami D, Azam L, Gajewiak J, Olivera BM, Bulaj G, et al. μ-Conotoxins that differentially block sodium channels NaV1.1 through 1.8 identify those responsible for action potentials in sciatic nerve. Proc Natl Acad Sci U S A. 2011;108:10302–10307. doi: 10.1073/pnas.1107027108. [DOI] [PMC free article] [PubMed] [Google Scholar]
- Zhang MM, Fiedler B, Green BR, Catlin P, Watkins M, Garrett JE, et al. Structural and functional diversities among mu-conotoxins targeting TTX-resistant sodium channels. Biochemistry. 2006;45:3723–3732. doi: 10.1021/bi052162j. [DOI] [PubMed] [Google Scholar]
- Zhang MM, Green BR, Catlin P, Fiedler B, Azam L, Chadwick A, et al. Structure/function characterization of micro-conotoxin KIIIA, an analgesic, nearly irreversible blocker of mammalian neuronal sodium channels. J Biol Chem. 2007;282:30699–30706. doi: 10.1074/jbc.M704616200. [DOI] [PubMed] [Google Scholar]
- Zhang MM, McArthur JR, Azam L, Bulaj G, Olivera BM, French RJ, et al. Synergistic and antagonistic interactions between tetrodotoxin and mu-conotoxin in blocking voltage-gated sodium channels. Channels (Austin) 2009;3:32–38. doi: 10.4161/chan.3.1.7500. [DOI] [PMC free article] [PubMed] [Google Scholar]
- Zhang MM, Gruszczynski P, Walewska A, Bulaj G, Olivera BM, Yoshikami D. Cooccupancy of the outer vestibule of voltage-gated sodium channels by micro-conotoxin KIIIA and saxitoxin or tetrodotoxin. J Neurophysiol. 2010;104:88–97. doi: 10.1152/jn.00145.2010. [DOI] [PMC free article] [PubMed] [Google Scholar]
- Zhang MM, Wilson MJ, Azam L, Gajewiak J, Rivier JE, Bulaj G, et al. Co-expression of NaVβ subunits alters the kinetics of inhibition of voltage-gated sodium channels by pore-blocking μ-conotoxins. Br J Pharmacol. 2012;168:1597–1610. doi: 10.1111/bph.12051. [DOI] [PMC free article] [PubMed] [Google Scholar]
Associated Data
This section collects any data citations, data availability statements, or supplementary materials included in this article.