

Abstract
Background and Purpose
Oestrogen receptor alpha (ERα) binds to different ligand which can function as complete/partial oestrogen-agonist or antagonist. This depends on the chemical structure of the ligands which modulates the transcriptional activity of the oestrogen-responsive genes by altering the conformation of the liganded-ERα complex. This study determined the molecular mechanism of oestrogen-agonistic/antagonistic action of structurally similar ligands, bisphenol (BP) and bisphenol A (BPA) on cell proliferation and apoptosis of ERα + ve breast cancer cells.
Experimental Approach
DNA was measured to assess the proliferation and apoptosis of breast cancer cells. RT-PCR and ChIP assays were performed to quantify the transcripts of TFF1 gene and recruitment of ERα and SRC3 at the promoter of TFF1 gene respectively. Molecular docking was used to delineate the binding modes of BP and BPA with the ERα. PCR-based arrays were used to study the regulation of the apoptotic genes.
Key Results
BP and BPA induced the proliferation of breast cancer cells; however, unlike BPA, BP failed to induce apoptosis. BPA consistently acted as an agonist in our studies but BP exhibited mixed agonistic/antagonistic properties. Molecular docking revealed agonistic and antagonistic mode of binding for BPA and BP respectively. BPA treatment resembled E2 treatment in terms of PCR-based regulation of apoptotic genes whereas BP was similar to 4OHT treatment.
Conclusions and Implications
The chemical structure of ERα ligand determines the agonistic or antagonistic biological responses by the virtue of their binding mode, conformation of the liganded-ERα complex and the context of the cellular function.
Keywords: oestrogen, oestrogen receptor, breast cancer, apoptosis, triphenylethylenes, antioestrogens, bisphenol and bisphenol A
Introduction
Oestrogen receptor alpha (ERα) mediates its action in cells and tissues by binding to its cognate ligands and function as a ‘ligand-activated’ transcription factor (Jordan and O'Malley, 2007). Apart from its natural ligands, many different compounds can bind to ERα and thus can function as its ligand (Sengupta and Jordan, 2008). However, depending upon the chemical structures of these ligands, they can either function as a complete/partial oestrogen- agonist or antagonist. Broadly, the oestrogenic compounds can be classified as class I and class II depending upon their planar or non-planar chemical structures respectively (Jordan et al., 2001). Different ligands bind to the same core of the ligand binding domain (LBD) of ERα protein but can evoke distinct three-dimensional conformation of the liganded-ERα complex which can either interact with the coactivators or the corepressors (collectively known as coregulators) at the promoters of oestrogen-responsive genes (Jordan and O'Malley, 2007). Consequently, this complex modulates the transcriptional activity of the various oestrogen-responsive genes and eventually determines the outcome of the ERα-dependent physiological responses of a particular cell or tissue type. The molecular basis of this differential recruitment of the coregulators has been attributed to the ability of the liganded-ERα to reorient the helix 12 (H12) of the LBD in such a manner that the complex can interact with the coactivators at the structural interface formed by H3, H4 and H5 helices; when ERα is bound to an agonist [17β-oestradiol (E2) or diethylstilbestrol (DES)] (Brzozowski et al., 1997; Shiau et al., 1998), but this interaction is completely blocked when the ERα is bound to antagonists, such as 4-hydroxy-tamoxifen (4OHT) (Brzozowski et al., 1997) or raloxifene (RAL) (Shiau et al., 1998). Interestingly, when ERα is liganded with an antagonist, such as 4OHT, an active metabolite of tamoxifen, which is extensively used in treatment and prevention of breast cancers (Jordan, 1993), it can now interact with the corepressors and can inhibit the transcriptional activity from the oestrogen-responsive genes (Metivier et al., 2002; Shang and Brown, 2002; Liu and Bagchi, 2004). Besides the interaction of coregulators with the liganded ERα, the levels of coactiavtors and corepressors in a given cell can also determine the physiological responses to different ligands of ERα (Shang and Brown, 2002).
Earlier studies from our laboratory have identified that the amino acid aspartate at 351 (which is in the H3) of the ERα LBD is critically important for maintaining the integrity of antioestrogenic activity of keoxifene (RAL) and 4OHT (Levenson et al., 1997; 1998). Earlier, the mutation of ERα encoding amino acid 351 which substituted the aspartate to tyrosine amino acid was detected in one of the xenograft tumours stimulated by tamoxifen in the athymic mice (Wolf and Jordan, 1994). Further investigations have revealed that changing the amino acid aspartate 351 of the ERα to glycine (D351G) abolishes the oestrogenic effect of 4OHT but does not affect oestradiol action on TGFα gene activation in the ER negative breast cancer cells stably transfected with either wild type ERα or D351G mutated ERα (MacGregor Schafer et al., 2000). Using these models, oestrogens were classified as either type I, which have the planar structures or type II, which have the angular or non-planar structures (Jordan et al., 2001; Bentrem et al., 2003). A recent confirmatory study evaluated the ability of several type I and II liganded ERα to associate with the specific peptide motif ‘LXXLL’ which coactivators use to interact with the ERα (Bourgoin-Voillard et al., 2010).
A previous study (Maximov et al., 2011) from our laboratory indicated that the conformation of the ERα complex can govern the oestrogen-induced apoptosis in the MCF7 : 5C breast cancer cells. The present study dissects the ERα mediated effect of two structurally similar oestrogenic ligands, namely, bisphenol (BP) and bisphenol A (BPA) (Figure 1), on two critical physiological responses, that is growth and apoptosis in the breast cancer cells. BP is structurally related to 4OHT with E2-like agonistic properties, whereas BPA has been characterized as an endocrine disruptor with weak oestrogenic properties. Using various investigative tools, this study underscore the fact that minor difference in the shape of the ERα-liganded complex has profound modulation on oestrogen-induced apoptosis but not on oestrogen-induced replication of breast cancer cells.
Figure 1.
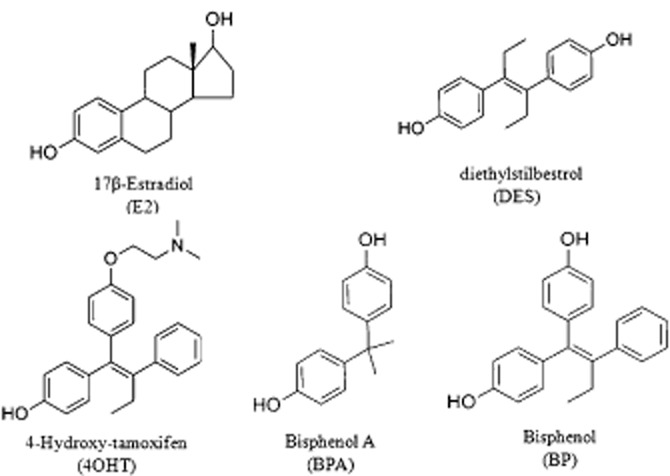
Chemical structures of 17β-oestradiol (E2), Diethylstilbestrol (DES), 4-Hydroxy tamoxifen (4OHT), Bisphenol (BP) and Bisphenol A (BPA).
Materials and methods
Cell culture and reagents
Cell culture media were purchased from Invitrogen Inc. (Grand Island, NY, USA) and fetal calf serum (FCS) was obtained from HyClone Laboratories (Logan, UT, USA). Compounds E2, 4OHT and BPA were obtained from Sigma-Aldrich (St. Louis, MO, USA). BP was synthesized and the details of the synthesis have been reported previously (Maximov et al., 2010). The ER positive breast cancer cells MCF-7 : WS8 (hereafter mentioned as MCF7) and oestrogen-deprived MCF7 : 5C were derived from MCF7 cells obtained from the Dr. Dean Edwards, San Antonio, TX, USA as reported previously (Jiang et al., 1992). MCF7 cells were maintained in RPMI media supplemented with 10% FCS, 6 ng·mL−1 bovine insulin and penicillin and streptomycin. MCF7 : 5C cells were maintained in phenol red-free RPMI media containing 10% charcoal dextran treated FCS, 6 ng·mL−1 bovine insulin and penicillin and streptomycin. Three to four days prior to harvesting the MCF7, cells were cultivated in phenol red-free media containing 10% charcoal dextran treated FCS. The cells were treated with indicated compounds (with media changes every 48 h) for the specified time and were subsequently harvested for growth assay. MDA-MB-231 cells stably transfected with wild type ERα (MC2) or D351G ERα (JM6) were grown in minimal essential medium without phenol red in the presence of 5% charcoal dextran treated calf serum, glutamine, bovine insulin, penicillin, streptomycin, nonessential amino acids and 500 μg·mL−1 G418 as described previously (MacGregor Schafer et al., 2000). All the experiments were repeated at least three times, in triplicate to confirm the results.
Cell growth assay
The cell growth was monitored by measuring the total DNA content per well in 24 well plates. Fifteen thousand cells were plated per well and treatment with indicated concentrations of compounds was started after 24 h, in triplicate. Media containing the specific treatments were changed every 48 h. On day 6 (144 h post treatment), the cells were harvested and total DNA was assessed using a fluorescent DNA quantitation kit (Cat # 170–2480; Bio-Rad, Hercules, CA, USA) according to manufacturer's instructions. Briefly, the cells were harvested using hypotonic buffer solution and were subsequently sonicated. The DNA content was estimated using a fluorescent dye (Hoechst 33258) provided in the kit.
RNA isolation and real-time PCR (RT-PCR)
Total RNA was isolated using TRIzol reagent (Invitrogen, Carlsbad, CA, USA) and RNAeasy kit according to the manufacturer's instructions. RT-PCR was performed as previously described (Sengupta et al., 2010). Briefly, high capacity cDNA reverse transcription kits (Applied Biosystems, Foster City, CA, USA) was used to generate cDNA was using 1 ug of total RNA in a total volume of 20 uL. The cDNA was subsequently diluted to 500 uL and RT-PCR was performed using ABI Prism 7900 HT Sequence Detection System (Applied Biosystems). In each well, 20 uL reaction volume included 10 uL SYBR green PCR master mix (Applied Biosystems), 125 nM each of forward and reverse primers and 5 uL of diluted cDNA. The change in expression of transcripts was determined as described previously and used the ribosomal protein 36B4 mRNA as the internal control (Sengupta et al., 2010).
Chromatin-immunoprecipitation (ChIP) assay
ChIP assay was performed as described previously (Maximov et al., 2011). Briefly, cells were treated with indicated compounds for 45 min and cross-linked using 1.25% paraformaldehyde for 15 min and subsequently stopped cross-linking with 2 M glycine. Cells were collected, followed by nuclei isolation by centrifugation. Isolated nuclei were resuspended in SDS-lysis buffer followed by sonication and centrifugation at 14 000× g for 20 min at 4°C. The supernatant were diluted 1 : 10 with ChIP dilution buffer. Normal rabbit IgG and Magna ChIP protein A magnetic bead (Upstate Cell Signaling Solutions, Temecula CA, USA) were used to immunoclear the supernatant followed by immunoprecipitation with antibodies against ERα (1:1 mixture of cat# sc-543 and sc-7207; Santa Cruz Biotechnology Inc., Dallas, TX, USA) and steroid receptor coactivator-3 (SRC3) (cat# 13066; Santa Cruz Biotechnology, Inc.). Immunocomplexes were pulled down using protein A magnetic beads and a magnet. The beads bound to immunocomplexes were washed using different buffers as described previously (Maximov et al., 2011). Precipitates were finally extracted twice using freshly made 1% SDS and 0.1 M NaHCO3 followed by de-crosslinking. The DNA fragments were purified using Qiaquick PCR purification kit (Qiagen, Valencia, CA, USA). RT-PCR was performed using 2 μL isolated DNA, using primers specific for PS2 promoter (Maximov et al., 2011). The data are presented as percent input of starting chromatin input after subtracting the percent input pull down of the negative control (normal rabbit IgG).
Molecular modelling
A commonly used method to evaluate the docking method efficiency is to dock the cocrystallized ligand to its native experimental structure. The expected outcome would be a docking solution, pose, which recapitulates the binding mode of the ligand in the binding site of the experimental structure. For this reason, 3D-conformations of E2, DES and 4OHT were generated, optimized with MMFF94 force field and then subjected to preparation for docking using the LigPrep utility. The same protocol was followed for BPA and BP. Protein Preparation Workflow (Schrödinger, LLC, New York, NY, 2011) was employed to prepare the proteins for molecular docking. The residues well known to be important for biological activity D351 and E353 were kept charged in all three receptors, the free rotation of hydroxyl group for T347 was allowed and H524 residue was protonated at the epsilon nitrogen atom in the complexes 1GWR and 3ERT based on the available literature data. In the case of 3ERD complex, two structures were prepared for docking runs having H524 protonated at epsilon (3ERD_ε) and delta (3ERD_δ) nitrogen.
The best docking poses were selected based on the composite score, Emodel, which accounts not only for the binding affinity but also for the energetic terms, such as ligand strain energy and interaction energy. When E2, DES and 4OHT were docked to their native structures the top ranked docking solutions have a ligand RMSD of 0.353 for E2, 0.416 for DES docked to 3ERD_ε and 0.372 when docked to 3ERD_δ and 0.629 for 4OHT.
Real time profiler assay for apoptosis
RT-PCR profiler assay kits for apoptosis was used from a commercial vendor which uses 384 well plates to profile the expression of 370 apoptosis related human genes (Qiagen; SABiosciences Corp, Fredrick, MD, USA; Cat#330231 PAHS-3012E). All the procedures were followed as per the manufacturer's instructions. Briefly, MCF7 : 5C cells were treated with E2 (10−9 M) for 24, 48 and 72 h or with indicated compounds (in triplicate) for 48 h and total RNA was isolated using the method mentioned earlier. Two micrograms of total RNA was reverse transcribed and RT-PCR was performed using ABI 7900HT. The fold change was calculated by ΔΔCt method and volcano plots were generated using the web based tool, RT2 profile PCR array data analysis version 3.5 (Qiagen; SABiosciences Corp.).
Statistics
Statistical significance of our data was assessed using the Student's t-test wherever relevant. A P-value of <0.05 was considered as statistically significant.
Results
Differential effect of BP and BPA in inducing apoptosis in MCF7 : 5C cells but not growth in MCF7 cells
BP (Figure 1) a triphenylethylene (TPE) is a known partial oestrogenic ligand which can induce growth of the ERα positive breast cancer cells (Maximov et al., 2010) and can also partially initiate prolactin synthesis from primary culture of cells from immature rat pituitary glands (Jordan and Lieberman, 1984). Another compound with similar chemical structure, BPA (Figure 1) is also a well-characterized but weak oestrogenic ligand (Routledge et al., 2000). Here, we evaluated the ability of these two oestrogenic compounds to induce growth and apoptosis in MCF7 and MCF7 : 5C cells, respectively as both these responses are dependent on oestrogen-agonistic action. As expected, BP as well as BPA was able to induce the concentration dependent growth in the MCF7 cells (Figure 2A). BPA was less potent compared to BP as maximal growth was achieved by BP at 10−9 M concentration as compared to 10−6 M for BPA. By comparison, E2 induced maximal growth at 10−11 M concentration in the MCF7 cells. In the case of MCF7 : 5C cells, which undergo apoptosis with E2 treatment (Lewis et al., 2005; Ariazi et al., 2011), a marked contrast was observed between BP and BPA in the induction of apoptosis. BPA was able to induce apoptosis to the same extent as E2 in these cells at a higher (10−6 M) concentration (Figure 2B) as compared to E2 which achieved maximal effect at 10−10 M. However, BP failed to induce apoptosis even at 10−5 M concentration (Figure 2B). We further investigated that if BP was actually binding to the ERα in the MCF7 : 5C cells by treating these cells with BP in combination with 10−9 M of E2. BP was able to block the effect of E2 in the MCF7 : 5C cells (Figure 2C and Supporting Information Figure S3) in a concentration dependent manner indicating that the effect of BP was through the ERα, thus inhibiting the E2 action. On the other hand, BPA was not able to block the effect E2 action (Figure 2C). In addition, we also show that the oestrogenic effect of BPA (10−6 M) in inducing apoptosis in MCFF7 : 5C cells was completely blocked by BP (10−6 M) as well as 10−6 M of 4OHT (Figure 2D).
Figure 2.

Differential effect of bisphenol (BP) and bisphenol A (BPA) on growth and apoptosis of ERα positive breast cancer cells. (A) Dose-dependent effects of BP, BPA and (oestradiol) E2 on growth of MCF7 cells treated for 6 days as indicated. The black bar denotes the level of DNA in vehicle treated cells over a 6-day period. The growth is measured as amount of DNA present in each well. (*P < 0.05 vs. vehicle treatment) (B) Dose-dependent effect of BP, BPA and E2 on apoptosis of MCF7 : 5C cells treated for 6 days as indicated. The black bar denotes the level of DNA in vehicle treated cells over a 6-day period. The growth is measured as amount of DNA present in each well. (*P < 0.05 vs. vehicle treatment) (C) Dose dependent effect of BP and BPA on E2 (1 nM)-induced apoptosis in MCF7 : 5C cells, treated over a six day period. The growth is measured as amount of DNA present in each well. (*P < 0.05 vs. 1 nM E2 treatment) (D) Effect of BP (10−6 M) and 4OHT (10−6 M) on BPA (10−6 M) induced apoptosis in MCF7 : 5C cells over 6-day period. (*P < 0.05 vs. vehicle treatment; #P < 0.05 vs. BPA treatment) The data are presented as percent of growth considering the vehicle treated cells as 100 percent. Each value is average of at least three replicates ±SD.
Regulation of oestrogen-responsive gene trefoil factor 1(TFF1 or PS2) by BP and BPA
We next investigated the transcriptional regulation of a well-characterized oestrogen-regulated gene, TFF1 (PS2) (Metivier et al., 2003) by BP and BPA and compared it with E2 and 4OHT. MCF7 cells were treated for 4 h with the 0.1% ethanol (veh), E2 (10−9 M), 4OHT (10−6 M), BP (10−6 M and 10−5 M) or BPA (10−6 M and 10−5 M) and the transcripts levels of PS2 gene were measured using RT-PCR. Two different concentrations (10−6 M and 10−5 M) were used for BP and BPA, because BPA is a weak oestrogen and we wanted to evaluate the concentration dependent regulation of these compounds. As expected, PS2 mRNA was up-regulated around fivefold by E2 (10−9 M) compared to vehicle treatment and 4OHT (10−6 M) which completely failed to induce the levels of PS2 mRNA (Figure 3A). On the other hand, BP treatment at 10−6 M concentration moderately (∼2 fold) up-regulated the PS2 mRNA levels and higher concentration (10−5 M) of BP failed to further increase the levels of PS2 (Figure 3A). Conversely, cells treated with BPA exhibited concentration dependent increase in up-regulation of the PS2 mRNA and the magnitude of up-regulation with high concentration (10−5 M) of BP was equivalent to the E2-mediated up-regulation of PS2 mRNA (Figure 3A).
Figure 3.
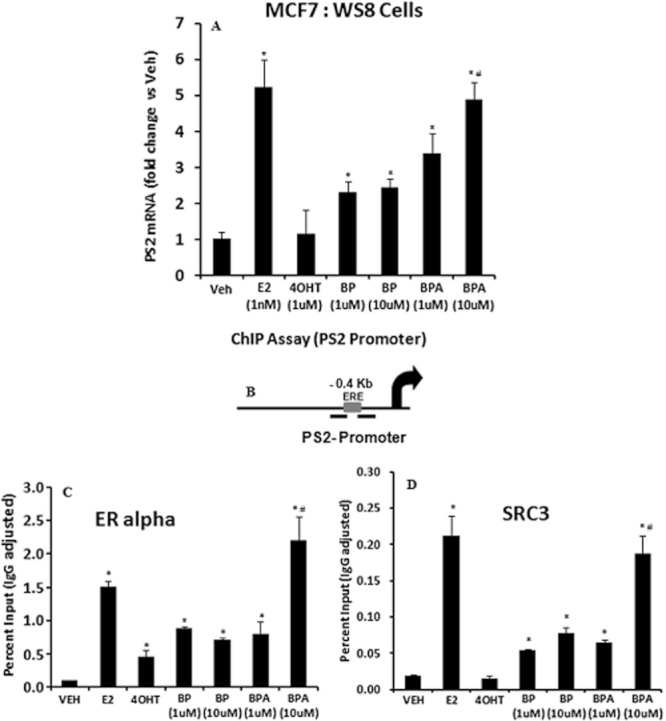
Regulation of PS2 (TFF1) gene by bisphenol (BP), bisphenol A (BPA) compared with 17β-oestradiol (E2) and 4-hydroxy-tamoxifen (4OHT) and recruitment of oestrogen receptor alpha (ER alpha) and steroid receptor coactivator-3 (SRC3) at the oestrogen-responsive element (ERE) of proximal promoter of PS2 gene followed by 45 min treatments of bisphenol (BP), bisphenol A (BPA) compared with 17β-oestradiol (E2) and 4-hydroxy-tamoxifen (4OHT) in MCF7 cells. (A) MCF7 cells were treated with indicated treatments for 4 h and harvested for total RNA. Total RNA was reverse transcribed and assessed for PS2 gene expression levels using RT-PCR. 36B4 gene was used as an internal control. All values are represented in terms of fold difference versus vehicle treatment. (*P < 0.05 vs. vehicle treatment; #P < 0.05 vs. 1 μM BPA and 10 μM BP treatment) (B) Schematic representation of the PS2 proximal promoter containing an ERE (grey box) and the black bars represent the primers used for RT-PCR. (C) Recruitment of ERα at the PS2 proximal promoter, by ChIP assay after 45 min of indicated treatment. (*P < 0.05 vs. vehicle treatment; #P < 0.05 vs. 1 μM BPA and 10 μM BP treatment) (D) Recruitment of SRC3 at the PS2 proximal promoter, by ChIP assay after 45 min of indicated treatment. All the values are representated as percent input of the starting chromatin material and after subtracting the IgG control for each sample. (*P < 0.05 vs. vehicle treatment; #P < 0.05 vs. 1 μM BPA and 10 μM BP treatment.)
Recruitment of ERα and SRC3 at the promoter of TFF1 gene after treatment with BP and BPA
To understand the differences in the molecular mechanism of the transcriptional activation of PS2 gene in vivo by BP and BPA in comparison to E2 and 4OHT treatment, we performed ChIP assay to evaluate the recruitment of ERα and SRC3 at the promoter region of TFF1 (PS2) gene (Figure 3B) which has a well-characterized functional oestrogen-responsive element (ERE) (Metivier et al., 2002). MCF7 cells were treated with either 0.1% ethanol (veh), E2 (10−9 M), 4OHT (10−6 M), BP (10−6 M or 10−5 M) or BPA (10−6 M or 10−5 M) for 45 min and thereafter harvested for ChIP assay. The results (Figure 3C) reveal that both concentrations of BPA (10−6 M and 10−5 M) recruited ERα to the PS2 promoter with ERE in a concentration-dependent manner which was equivalent to results obtained with E2 treatment. In contrast, BP did not show a concentration-related effect and the levels of ERα plateaued at 50% of either E2 or BPA (Figure 3C). Recruitment of the coactivator, SRC3 (AIB1), which plays a key role in transcriptional activation of several oestrogen-regulated genes, including PS2 gene (Shao et al., 2004; Labhart et al., 2005), followed the similar pattern as the ERα (Figure 3D). BPA treatment at both the concentrations (10−6 M or 10−5 M) recruited SRC3 in a concentration-dependent manner to become equivalent to levels observed with E2 treatment whereas BP treatment (both concentration) plateaued at 50% of E2 or BPA recruitment levels (Figure 3D). As expected, 4OHT treatment did not recruit SRC3 and was comparable to vehicle treatment. The ChIP data correlates very well with the observed pattern of transcriptional activation of PS2 gene (Figure 3A) under same treatment conditions.
Differential induction of transforming growth factor alpha (TGFα) gene by BP and BPA in MDA : MB-231 cells stably transfected with wild-type (wt) ERα or D351G mutant ERα
Previous studies from our laboratory have established an in vitro system to evaluate and differentiate the conformation of liganded ERα induced by planar and non-planar ligands (Jordan et al., 2001). Activation of TGFα gene in MDA : MB 231 cells stably transfected with wt ERα (MC2 cells) or mutant ERα (JM6 cells, D351G; which has the aspartate substituted with glycine at amino acid 351), is used as a marker to distinguish the ERα interactions between planar and non-planar oestrogen ligands (Jordan et al., 2001). We treated the MC2 and JM6 cells with increasing concentrations of BP and BPA and measured the TGFα induction in these cells. E2 was used as a positive control. In MC2 cells, (wt ERα), all the tested ligands induced TGFα transcripts level to similar levels (Figure 4A). Induction of TGFα by BPA was observed at higher concentrations whereas BP and E2 had similar effects (Figure 4A). On the other hand, in JM6 cells (mutant; D351G ERα), BP failed to induce TGFα transcription even at higher concentrations (Figure 4B), whereas E2 and BPA treatment induced TGFα (Figure 4B), although the maximal induction with BPA was observed at higher concentration (10−5 M) which was less than 50% of E2 treatment. We further confirmed that E2-induced TGFα stimulation in JM6 cells was completely blocked by BP and 4OHT in a dose-dependent manner; whereas co-treatment of BPA in presence of E2 failed to inhibit it (Figure 4C).
Figure 4.
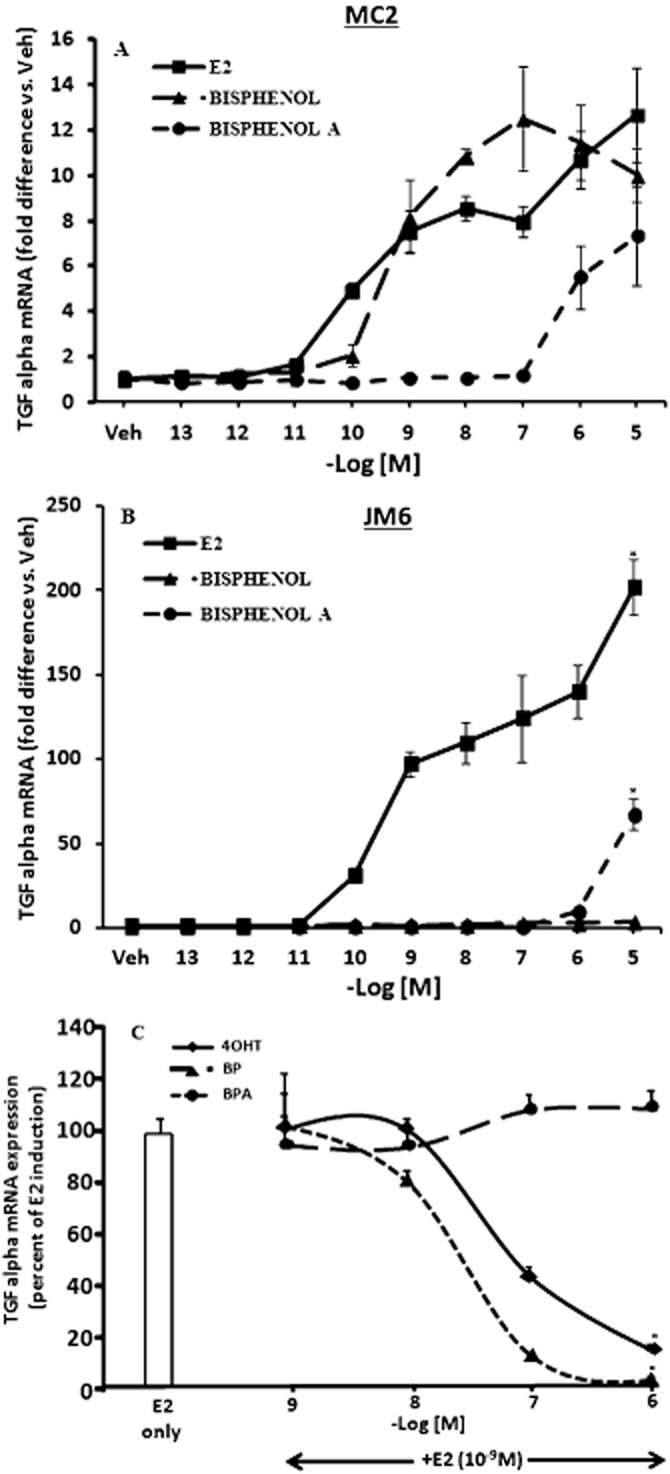
Induction of TGFα mRNA by 17β-oestradiol (E2), bisphenol (BP) and bisphenol A (BPA) in MDA : MB 231 cells stably transfected with wild type ERα (MC2 cells) or D351G mutant ERα (JM6 cells). (A) MC2 cells were treated with (E2), (BP) or BPA at indicated concentration for 48 h and cells were harvested for total RNA. Total RNA was reverse transcribed and real time PCR (RT-PCR) was performed to assess the expression of TGFα using 36B4 as an internal control. The values are presented as fold difference versus vehicle treated cells. (B) JM6 cells were treated with (E2), (BP) or (BPA) at indicated concentrations for 48 h and cells were harvested for total RNA. Total RNA was reverse transcribed and RT-PCR was performed to assess the expression of TGFα using 36B4 as an internal control. The values are presented as fold difference versus vehicle treated cells. (*P < 0.05 vs.10−5 M BP treatment) (C) JM6 cells were treated with E2 alone or in combination with different concentration of BP, BPA or 4OHT as indicated for 48 h. The values are presented as percentage of expression of TGFα mRNA considering the E2-induced levels as 100%. (*P < 0.05 vs. 1 nM E2 and 1 nM E2 +10−6 M BPA treatment.)
Molecular docking of BP and BPA to the LBD of ERα
To determine the binding mode of BPA and BP to ERα, the ligands were docked to the agonist and antagonist conformations of the receptor. The experimental structure, 3ERT, was selected from protein database for the antagonist conformation of ERα (Figure 5A) containing 4OHT, while for the agonist conformation, two experimental structures were selected, namely the receptor cocrystallized with E2, 1GWR (Figure 5B) and DES, 3ERD (Figure 5C) respectively.
Figure 5.
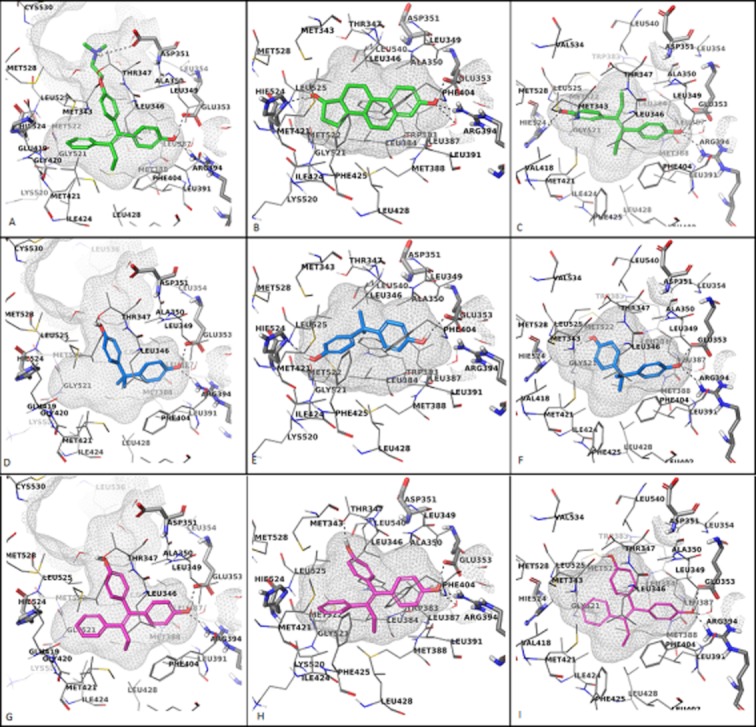
Molecular docking of bisphenol (BP) and bisphenol A (BPA) with ERα ligand binding domain. Cross-sectional representations of ERα binding sites in the antagonist (A) with 4OHT and agonist (B, C) with 17β-oestradiol and DES conformations. The top ranked docking poses of BPA into the binding site of 3ERT (D), 1GWR (E), 3ERD (F) are displayed with C atoms coloured in magenta while the best docking solutions of BP computed for 3ERT (G), 1GWR (H), 3ERD (I) are represented with C atoms coloured in blue. The amino acids involved in H-bond contacts are depicted as sticks and the rest of the amino acids lining the binding site are shown as lines having the C atoms coloured in gray. Only polar hydrogen atoms are shown, for simplicity.
When BPA is docked to the antagonist conformation, 3ERT, it is oriented perpendicular with the binding pocket and in this alignment it has the propensity to form the H-bond network involving E353, R394 and a water molecule (Figure 5D). Additionally, a hydrogen bond with the hydroxyl group of T347 is formed. In this alignment, the binding site is poorly occupied and the hydrophobic contacts with the amino acids lining the bottom of the binding site are missing.
In the case of BPA, two highly probable binding modes have been identified. The first one has been mostly predicted when the ligand has been docked into the binding sites of ERα cocrystallized with E2 and DES, the structure 3ERD_ε using the SP mode. The ligand is placed across the binding site in a similar orientation with the native ligands, having the two methyl groups involved in hydrophobic contacts with the side chains of amino acids W383, L384, L525 and L540. Also, BPA forms H-bonds with H524 and E353 (Figure 5E). When docking calculations have been run in the XP mode of Glide a second alignment of the top tanked poses in the binding site of 3ERD_ε and 3ERD_δ has been noticed. This orientation involves the formation of H-bonds between the hydroxyl groups of BPA and amino acids G521, E353 and R394 (Figure 5F). Apart from the H-bonds formation, the methyl groups are involved in hydrophobic contacts with amino acids L346, F404 and L428. Also, this binding mode has been encountered for 6 out of 10 poses resulted from the docking of BPA into the experimental structure 1GWR.
The predicted binding modes of BP to the open and closed conformation of ER are similar, forming the H-bond network between E353, R394 and the highly ordered water molecule and an additional H-bond with the hydroxyl group of T347 (Figure 5G–I). The composite score, Emodel, shows that BP is better accommodated in the binding site of the open or antagonist conformation of ERα and it is more likely for the ligand to bind at this conformation of ER. Similar results have been obtained using the induced fit docking method, which accounts for both the ligand and protein flexibility (Maximov et al., 2010).
The comparative analysis of the composite score Emodel for the agonist and antagonist top ranked docking poses of BPA has shown that the binding mode predicted for the antagonist conformation is highly improbable and it is more likely for BPA to bind to a conformation of ERα closely related with the agonist one. Two distinct binding modes of BPA to the agonist conformations of ERα have been predicted with tight Emodel scores and cannot be clearly discriminated which alignment is correct or at least with the highest probability of being right. The docking scores calculated for E2, DES and BPA shows the binding affinity of BPA to ERα is much lower when compared with the binding affinities of E2 or DES to ERα.
Comparative analysis of regulation of apoptotic genes by BP, BPA, 4OHT and E2 in MCF7 : 5C cells using apoptotic gene RT-PCR profiler
We thereafter determined the effect of BP and BPA treatment in regulating the apoptosis related genes in MCF7 : 5C cells and compared it with E2 and 4OHT as a positive and negative inducer of apoptosis respectively. We used the RT-PCR profiler assay kits for apoptosis from a commercial vendor which uses 384 well plates to profile the expression of 370 apoptosis related human genes (Qiagen; SABiosciences Corp.; Cat#330231 PAHS-3012E). To select a single time point of treatment with the ligands, we first treated the MCF7 : 5C cells with E2 (10−9 M) for 24, 48 and 72 h (in triplicate) and created an apoptotic gene signature throughout these time points after comparing them with vehicle treatment (Supporting Information Figure S1A, B, C and Supporting Information Table S1). This gene signature was generated by comparing the expression level of all the genes with vehicle treatment and selecting the genes which were at least 2.5-fold overexpressed or underexpressed as compared to vehicle treated cells. The fold change was calculated by delta-delta Ct method using the web based tool, RT2 profile PCR array data analysis version 3.5 (Qiagen; SABiosciences Corp.).
After carefully analysing the gene list generated by E2 treatments over the above said time period, we selected 48 h as the time point to treat MCF7 : 5C cells with BP, BPA and 4OHT and compare the expression of the apoptosis related genes with the gene signature of the E2 treatment at 48 h. This particular time point was selected because the MCF7 : 5C cells undergo apoptotic changes after E2 treatment during this time period (Lewis et al., 2005) and also because after 48 h of E2 treatment, the cells are committed to apoptosis, as 4OHT treatment cannot rescue these cells after this time point (unpublished observations).
Next, we analysed the changes in the overall expression profiles of apoptotic genes by E2, 4OHT, BP and BPA versus vehicle (Veh) treatment at 48 h (Supporting Information Figure S2A, B, C and D respectively) using the same apoptosis RT profiler. For any gene to be considered as differentially expressed, we set the cut-off as 2.5-fold up- or down-regulation versus the vehicle treatment. Using this criterion, we created a gene list for up-regulated and down-regulated genes for each treatment group (Supporting Information Table S2). We thereafter generated a heat map (Figure 6) in which we selected all the genes which were at least 2.5-fold up- or down-regulated by E2 treatment and compared it with other ligand treatments. This heat map clearly demonstrates that the genes which are up-regulated at least 2.5-fold after 48 h of E2 treatment are not up-regulated in 4OHT or BP treatment. In contrast, the majority of the genes up-regulated by BPA treatment were shown to be the same genes up-regulated by the E2 treatment. Many of these genes are up-regulated by BPA to the similar extent as E2 and others show a distinct trend of overexpression as compared to vehicle (Figure 6). Nevertheless, down-regulated genes follow a different pattern. The pattern of genes down-regulated by BP treatment resembles the pattern observed with E2 and BPA treatment and not with the pattern of 4OHT treatment (Figure 6 and Supporting Information Table S2). Approximately, 53 and 61% of down-regulated genes are in common with E2 treatment and with the treatment of BP and BPA respectively (Supporting Information Table S2).
Figure 6.
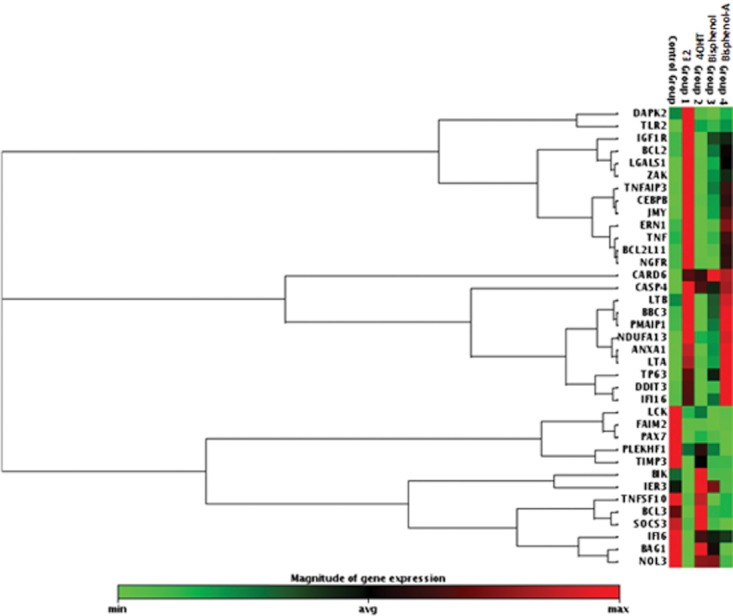
Heat map of apoptotic genes which are at least 2.5-fold up- or down-regulated by 48 h of treatment of 17β-oestradiol 10−9 M (E2), versus vehicle and its relative comparison of their expression with 4-hydroxy tamoxifen, 10−6 M (4OHT), bisphenol, 10−6 M (BP) and bisphenol A, 10−6 M (BPA) treatment after 48 h in MCF7 : 5C cells. The maximum expressed level of any given gene is represented by red colour and minimum levels are presented as green colour. Control group and group 1, 2, 3, 4 are the representation of the vehicle, E2, 4OHT, BP and BPA treatments respectively. The gene expression levels in each treatment group are the average of three independent biological replicates.
Discussion
The chemical structures of the ligands which bind to ERα are critical in determining the biological effects in the oestrogen-responsive cells and tissues. Minor changes in the ligand structures can alter the way these ligands interact with the ERα protein and transform the conformation of the liganded –ERα complex in the cells. Structure-function relationships have been studied extensively using various biological endpoints, such as modulation of prolactin gene expression in primary cell cultures of rat pituitary glands (Jordan and Lieberman, 1984; Jordan et al., 1984; 1986), or TGFα activation in stably transfected wt and mutant ERα in MDA : MB 231 cells (Jordan et al., 2001). The current study dissects, compares and contrasts the mechanism of action of BP and BPA, two structurally similar ligands of ERα, which have opposing effects on apoptosis but not on the growth of oestrogen-responsive breast cancer cells.
The results of this study established that unlike BPA and E2, BP was not functioning as an oestrogen-agonist in inducing apoptosis in MCF7 : 5C cells while both compounds (BPA and BP) were oestrogenic in inducing growth in MCF7 cells. This clearly indicated differential requirement of ERα mediated molecular action to achieve two distinct physiological responses in the breast cancer cells. Activation of oestrogen-responsive gene PS2 by these compounds in MCF7 cells suggested that higher concentrations of BPA was as effective as E2 but BP treatment failed to achieve E2-like stimulation, even with higher concentration. This phenomenon was observed because BP has a high ERα binding affinity and can maximally induce PS2 gene at lower concentration and raising the concentration did not enhance the induction because it failed to recruit sufficient coactivator (SRC3) at the PS2 gene promoter. This was most likely due to insufficient ERα recruitment at the promoter and inaccessibility of the coactivator interacting surface of BP-liganded ERα. A recent study (Bourgoin-Voillard et al., 2010) however, suggested that BP-liganded ERα cannot bind to a peptide containing the coactivator interacting domain. This discrepancy can be attributed to the fact that our studies were performed in live cells chromatin as opposed to using an in vitro ELISA based system. This indicates that binding of liganded ERα and its interaction with other coregulators can be modulated by other factors involved in transcriptional complex.
On the other hand, BPA at higher concentration engaged SRC3 to a similar level as E2 treatment. The fact that higher concentration of BPA was required to recruit ERα and SRC3 to the similar levels as E2 treatment is because its binding affinity with ERα is very low (RBA, 0.073) (Routledge et al., 2000) and therefore higher concentrations of the ligand is required to drive the kinetics towards the activated state. In the case of BP, it has a strong binding affinity to the ERα (RBA, 96.0) (Jordan et al., 1984) and therefore maximal activation is achieved at lower concentration and increasing concentration do not enhance the activation. Overall, these results indicate that binding mode of BPA and E2 are similar whereas BP might bind differently to ERα. Indeed, our molecular docking studies determined that BPA binds to the ERα in two possible ways, both similar to agonistic mode of binding. Also docking scores calculated in this study predicted very low binding affinity of BPA to ERα, which is in excellent agreement with previous reports (Gould et al., 1998; Kuiper et al., 1998; Kitamura et al., 2005). In contrast, modelling studies suggested antagonistic mode of binding (as in 4OHT) for BP to the ERα. To confirm the molecular modelling, we used a biological model system which can distinguish between planar and angular oestrogen ligands (Jordan et al., 2001; Bentrem et al., 2003) by measuring the transcriptional activation of TGFα in MDA : MB 231 cells stably transfected with wt ERα (MC2 cells) or mtERα (D351G) (JM6 cells). Results (Figure 4B) show that BP treatment failed to activate TGFα transcription similar to 4OHT (Jordan et al., 2001) in JM6 cells whereas BPA treatment was similar to E2 action, albeit with lower potency. This consolidated our finding that the mode of action of BP is more like 4OHT rather than E2. Importantly, the structure of BP is identical to 4OHT except for the basic dimethylamine-ethoxy side chain. The absence of the side chain contributes towards the enhanced oestrogenic properties of BP with AF-1 fully engaged in ER responses to stimulate growth, as H12 of the ERα protein liganded with BP may not be properly restrained. This contrasts with 4OHT or RAL, where the restricted structure of the coactivator-interacting interface for binding of SRC3 or the other coactivators now has limited AF-1 and AF-2 activity for growth. Of note, 4OHT and BP-liganded ERα was less efficiently recruited to the PS2 promoter ERE which may also contribute towards lesser recruitment of SCR3 for BP as recruitment of ERα precedes the coactivator binding (Metivier et al., 2003).
The fact that SRC3 is essential for E2-induced apoptosis in the MCF7 : 5C cells (Hu et al., 2011) as well as E2-mediated growth of MCF7 cells (List et al., 2001) coupled with the findings of this study, leads to the hypothesis that the oestrogen-mediated growth of MCF7 cells is more sensitive and can be induced even if the conformation of the liganded-ERα complex allows only partial interaction of coactivators as in case of BP binding. In contrast, complete and robust interaction of coactivator with the liganded-ERα complex must be needed for rapid induction of apoptosis in MCF7 : 5C cells.
Indeed, using an ‘apoptosis’ pathway focused RT-PCR based profiler consisting of 370 genes, this study further illustrated that apoptosis related genes were similarly up-regulated by E2 and BPA treatments after 48 h of treatment whereas BP and 4OHT showed very few up-regulated genes and the TPE based compounds did not have a similar profile of up-regulated genes during this time frame. By comparing the gene list (Supporting Information Table S2), which includes all the genes up- or down-regulated at least 2.5-fold by the treatments, it is evident that 66% of up-regulated genes are common between E2 and BPA treatment, whereas only 8% genes are commonly up-regulated by BP or 4OHT treatment.
Interestingly, a different pattern was observed for the down-regulated genes as both BP and BPA treatment exhibited common down-regulated genes as E2 and distinctly different from 4OHT. This suggests that the conformational requirement of liganded ERα may be different for up-regulation and down-regulation of genes. Furthermore, it indicates that the up-regulated apoptotic genes are responsible for triggering and executing apoptosis since up-regulated genes are differentially regulated by BP and BPA but not the down-regulated genes. These observations merits further investigations.
By employing structurally related ligands and using MCF7 : 5C and parental MCF7 cells, we have demonstrated that depending upon the biological response, the same molecule can function as an E2-antagonist or agonist respectively. Based on these data, it is reasonable to speculate that genistein and related phytoestrogens may also induce apoptosis in MCF7 : 5C cells as their binding to ERα LBD is similar as E2 and DES (Gao et al., 2012) and function as type I oestrogens (Bentrem et al., 2003). In conclusion, this study provides evidence that binding of ERα with different ligands that programme conformational changes of the liganded-ERα, determines the transcriptional profile of the responsive genes by virtue of interaction with coregulators.
Acknowledgments
This work (V.C.J.) was supported by the Department of Defense Breast Program under Award number W81XWH-06-1-0590 Center of Excellence; subcontract under the SU2C (AACR) Grant number SU2C-AACR-DT0409; the Susan G Komen For The Cure Foundation under Award number SAC100009 and the Lombardi Comprehensive Cancer Center Support Grant (CCSG) Core Grant NIH P30 CA051008. The views and opinions of the author(s) do not reflect those of the US Army or the Department of Defense.
Glossary
- 4OHT
4-hydroxy tamoxifen
- BP
bisphenol
- BPA
bisphenol A
- ChIP
chromatin-immunoprecipitation assay
- DES
diethylstilbestrol
- E2
17β-oestradiol
- ERα
oestrogen receptor alpha
- LBD
ligand binding domain
- RAL
raloxifene
- RT-PCR
real time PCR
- SRC3
steroid coactivator 3
- TFF1
trefoil factor 1
Conflicts of interest
None.
Supporting information
Additional Supporting Information may be found in the online version of this article at the publisher's web-site:
Figure S1 Representation of E2 (1 nM) regulated apoptotic genes in MCF7 : 5C cells at 24, 48 and 72 h of treatment versus vehicle treatment using volcano plots.
Figure S2 Representation of 17β-oestradiol 10−9 M (E2), 4-hydroxy tamoxifen, 10−6 M (4OHT), bisphenol, 10−6 M (BP) and bisphenol A, 10−6 M (BPA) regulated apoptotic genes in MCF7 : 5C cells after 48 h of treatment versus vehicle using volcano plots.
Figure S3 Dose dependent effect of BP (at various concentrations between 10−8 M and 10−7 M) on E2 (1 nM)-induced apoptosis in MCF7 : 5C cells, treated over a 6-day period. The growth is measured as percent of DNA present in each well; vehicle treated cells were considered as 100%.
Table S1 Gene list of E2 (1 nM) regulated apoptotic genes in MCF7 : 5C cells at 24, 48 and 72 h of treatment versus vehicle treatment.
Table S2 Gene list of 17β-oestradiol, 10−9 M (E2), 4-hydroxy tamoxifen, 10−6 M (4OHT), bisphenol, 10−6 M (BP) and bisphenol A, 10−6 M (BPA) regulated apoptotic genes in MCF7 : 5C cells after 48 h of treatment versus vehicle.
References
- Ariazi EA, Cunliffe HE, Lewis-Wambi JS, Slifker MJ, Willis AL, Ramos P, et al. Estrogen induces apoptosis in estrogen deprivation-resistant breast cancer through stress responses as identified by global gene expression across time. Proc Natl Acad Sci U S A. 2011;108:18879–18886. doi: 10.1073/pnas.1115188108. [DOI] [PMC free article] [PubMed] [Google Scholar]
- Bentrem D, Fox JE, Pearce ST, Liu H, Pappas S, Kupfer D, et al. Distinct molecular conformations of the estrogen receptor alpha complex exploited by environmental estrogens. Cancer Res. 2003;63:7490–7496. [PubMed] [Google Scholar]
- Bourgoin-Voillard S, Gallo D, Laios I, Cleeren A, Bali LE, Jacquot Y, et al. Capacity of type I and II ligands to confer to estrogen receptor alpha an appropriate conformation for the recruitment of coactivators containing a LxxLL motif-Relationship with the regulation of receptor level and ERE-dependent transcription in MCF-7 cells. Biochem Pharmacol. 2010;79:746–757. doi: 10.1016/j.bcp.2009.10.015. [DOI] [PubMed] [Google Scholar]
- Brzozowski AM, Pike AC, Dauter Z, Hubbard RE, Bonn T, Engstrom O, et al. Molecular basis of agonism and antagonism in the oestrogen receptor. Nature. 1997;389:753–758. doi: 10.1038/39645. [DOI] [PubMed] [Google Scholar]
- Gao L, Tu Y, Agren H, Eriksson LA. Characterization of agonist binding to His524 in the estrogen receptor alpha ligand binding domain. J Phys Chem B. 2012;116:4823–4830. doi: 10.1021/jp300895g. [DOI] [PubMed] [Google Scholar]
- Gould JC, Leonard LS, Maness SC, Wagner BL, Conner K, Zacharewski T, et al. Bisphenol A interacts with the estrogen receptor alpha in a distinct manner from estradiol. Mol Cell Endocrinol. 1998;142:203–214. doi: 10.1016/s0303-7207(98)00084-7. [DOI] [PubMed] [Google Scholar]
- Hu ZZ, Kagan BL, Ariazi EA, Rosenthal DS, Zhang L, Li JV, et al. Proteomic analysis of pathways involved in estrogen-induced growth and apoptosis of breast cancer cells. PLoS ONE. 2011;6:e20410. doi: 10.1371/journal.pone.0020410. [DOI] [PMC free article] [PubMed] [Google Scholar]
- Jiang SY, Wolf DM, Yingling JM, Chang C, Jordan VC. An estrogen receptor positive MCF-7 clone that is resistant to antiestrogens and estradiol. Mol Cell Endocrinol. 1992;90:77–86. doi: 10.1016/0303-7207(92)90104-e. [DOI] [PubMed] [Google Scholar]
- Jordan VC. Fourteenth Gaddum Memorial Lecture. A current view of tamoxifen for the treatment and prevention of breast cancer. Br J Pharmacol. 1993;110:507–517. doi: 10.1111/j.1476-5381.1993.tb13840.x. [DOI] [PMC free article] [PubMed] [Google Scholar]
- Jordan VC, Lieberman ME. Estrogen-stimulated prolactin synthesis in vitro. Classification of agonist, partial agonist, and antagonist actions based on structure. Mol Pharmacol. 1984;26:279–285. [PubMed] [Google Scholar]
- Jordan VC, O'Malley BW. Selective estrogen-receptor modulators and antihormonal resistance in breast cancer. J Clin Oncol. 2007;25:5815–5824. doi: 10.1200/JCO.2007.11.3886. [DOI] [PubMed] [Google Scholar]
- Jordan VC, Lieberman ME, Cormier E, Koch R, Bagley JR, Ruenitz PC. Structural requirements for the pharmacological activity of nonsteroidal antiestrogens in vitro. Mol Pharmacol. 1984;26:272–278. [PubMed] [Google Scholar]
- Jordan VC, Koch R, Mittal S, Schneider MR. Oestrogenic and antioestrogenic actions in a series of triphenylbut-1-enes: modulation of prolactin synthesis in vitro. Br J Pharmacol. 1986;87:217–223. doi: 10.1111/j.1476-5381.1986.tb10174.x. [DOI] [PMC free article] [PubMed] [Google Scholar]
- Jordan VC, Schafer JM, Levenson AS, Liu H, Pease KM, Simons LA, et al. Molecular classification of estrogens. Cancer Res. 2001;61:6619–6623. [PubMed] [Google Scholar]
- Kitamura S, Suzuki T, Sanoh S, Kohta R, Jinno N, Sugihara K, et al. Comparative study of the endocrine-disrupting activity of bisphenol A and 19 related compounds. Toxicol Sci. 2005;84:249–259. doi: 10.1093/toxsci/kfi074. [DOI] [PubMed] [Google Scholar]
- Kuiper GG, Lemmen JG, Carlsson B, Corton JC, Safe SH, van der Saag PT, et al. Interaction of estrogenic chemicals and phytoestrogens with estrogen receptor beta. Endocrinology. 1998;139:4252–4263. doi: 10.1210/endo.139.10.6216. [DOI] [PubMed] [Google Scholar]
- Labhart P, Karmakar S, Salicru EM, Egan BS, Alexiadis V, O'Malley BW, et al. Identification of target genes in breast cancer cells directly regulated by the SRC-3/AIB1 coactivator. Proc Natl Acad Sci U S A. 2005;102:1339–1344. doi: 10.1073/pnas.0409578102. [DOI] [PMC free article] [PubMed] [Google Scholar]
- Levenson AS, Catherino WH, Jordan VC. Estrogenic activity is increased for an antiestrogen by a natural mutation of the estrogen receptor. J Steroid Biochem Mol Biol. 1997;60:261–268. doi: 10.1016/s0960-0760(96)00184-7. [DOI] [PubMed] [Google Scholar]
- Levenson AS, Tonetti DA, Jordan VC. The oestrogen-like effect of 4-hydroxytamoxifen on induction of transforming growth factor alpha mRNA in MDA-MB-231 breast cancer cells stably expressing the oestrogen receptor. Br J Cancer. 1998;77:1812–1819. doi: 10.1038/bjc.1998.301. [DOI] [PMC free article] [PubMed] [Google Scholar]
- Lewis JS, Meeke K, Osipo C, Ross EA, Kidawi N, Li T, et al. Intrinsic mechanism of estradiol-induced apoptosis in breast cancer cells resistant to estrogen deprivation. J Natl Cancer Inst. 2005;97:1746–1759. doi: 10.1093/jnci/dji400. [DOI] [PubMed] [Google Scholar]
- List HJ, Lauritsen KJ, Reiter R, Powers C, Wellstein A, Riegel AT. Ribozyme targeting demonstrates that the nuclear receptor coactivator AIB1 is a rate-limiting factor for estrogen-dependent growth of human MCF-7 breast cancer cells. J Biol Chem. 2001;276:23763–23768. doi: 10.1074/jbc.M102397200. [DOI] [PubMed] [Google Scholar]
- Liu XF, Bagchi MK. Recruitment of distinct chromatin-modifying complexes by tamoxifen-complexed estrogen receptor at natural target gene promoters in vivo. J Biol Chem. 2004;279:15050–15058. doi: 10.1074/jbc.M311932200. [DOI] [PubMed] [Google Scholar]
- MacGregor Schafer J, Liu H, Bentrem DJ, Zapf JW, Jordan VC. Allosteric silencing of activating function 1 in the 4-hydroxytamoxifen estrogen receptor complex is induced by substituting glycine for aspartate at amino acid 351. Cancer Res. 2000;60:5097–5105. [PubMed] [Google Scholar]
- Maximov P, Sengupta S, Lewis-Wambi JS, Kim HR, Curpan RF, Jordan VC. The conformation of the estrogen receptor directs estrogen-induced apoptosis in breast cancer: a hypothesis. Horm Mol Biol Clin Investig. 2011;5:27–34. doi: 10.1515/HMBCI.2010.047. [DOI] [PMC free article] [PubMed] [Google Scholar]
- Maximov PY, Myers CB, Curpan RF, Lewis-Wambi JS, Jordan VC. Structure-function relationships of estrogenic triphenylethylenes related to endoxifen and 4-hydroxytamoxifen. J Med Chem. 2010;53:3273–3283. doi: 10.1021/jm901907u. [DOI] [PMC free article] [PubMed] [Google Scholar]
- Metivier R, Stark A, Flouriot G, Hubner MR, Brand H, Penot G, et al. A dynamic structural model for estrogen receptor-alpha activation by ligands, emphasizing the role of interactions between distant A and E domains. Mol Cell. 2002;10:1019–1032. doi: 10.1016/s1097-2765(02)00746-3. [DOI] [PubMed] [Google Scholar]
- Metivier R, Penot G, Hubner MR, Reid G, Brand H, Kos M, et al. Estrogen receptor-alpha directs ordered, cyclical, and combinatorial recruitment of cofactors on a natural target promoter. Cell. 2003;115:751–763. doi: 10.1016/s0092-8674(03)00934-6. [DOI] [PubMed] [Google Scholar]
- Routledge EJ, White R, Parker MG, Sumpter JP. Differential effects of xenoestrogens on coactivator recruitment by estrogen receptor (ER) alpha and ERbeta. J Biol Chem. 2000;275:35986–35993. doi: 10.1074/jbc.M006777200. [DOI] [PubMed] [Google Scholar]
- Sengupta S, Jordan VC. Selective estrogen modulators as an anticancer tool: mechanisms of efficiency and resistance. Adv Exp Med Biol. 2008;630:206–219. doi: 10.1007/978-0-387-78818-0_13. [DOI] [PubMed] [Google Scholar]
- Sengupta S, Sharma CG, Jordan VC. Estrogen regulation of X-box binding protein-1 and its role in estrogen induced growth of breast and endometrial cancer cells. Horm Mol Biol Clin Investig. 2010;2:235–243. doi: 10.1515/HMBCI.2010.025. [DOI] [PMC free article] [PubMed] [Google Scholar]
- Shang Y, Brown M. Molecular determinants for the tissue specificity of SERMs. Science. 2002;295:2465–2468. doi: 10.1126/science.1068537. [DOI] [PubMed] [Google Scholar]
- Shao W, Keeton EK, McDonnell DP, Brown M. Coactivator AIB1 links estrogen receptor transcriptional activity and stability. Proc Natl Acad Sci U S A. 2004;101:11599–11604. doi: 10.1073/pnas.0402997101. [DOI] [PMC free article] [PubMed] [Google Scholar]
- Shiau AK, Barstad D, Loria PM, Cheng L, Kushner PJ, Agard DA, et al. The structural basis of estrogen receptor/coactivator recognition and the antagonism of this interaction by tamoxifen. Cell. 1998;95:927–937. doi: 10.1016/s0092-8674(00)81717-1. [DOI] [PubMed] [Google Scholar]
- Wolf DM, Jordan VC. The estrogen receptor from a tamoxifen stimulated MCF-7 tumor variant contains a point mutation in the ligand binding domain. Breast Cancer Res Treat. 1994;31:129–138. doi: 10.1007/BF00689683. [DOI] [PubMed] [Google Scholar]
Associated Data
This section collects any data citations, data availability statements, or supplementary materials included in this article.