Abstract
Objective
To explore how hand-hygiene-observer scheduling influences the number of events and unique individuals observed.
Design
We deployed a mobile sensor network to capture detailed movement data for 6 categories of healthcare workers (HCWs) over 2 weeks Setting: The University of Iowa Hospital and Clinic’s MICU.
Methods
We recorded 33721 time-stamped HCW entries to and exits from patient rooms and considered each entry or exit an opportunity for hand hygiene. Architectural drawings were used to derive 4 optimal line-of-sight placements for observers. We ran simulations for different observer movement schedules, all with a budget of 1 hour total observation time. We considered observation times of 1–15, 15–30, 30 and 60 minutes per station. We stochastically generated HCW hand-hygiene compliance based on all data and recorded the total unit compliance as it would be reported by each simulated observer.
Results
Considering a 60 minute total observation period, aggregate simulated observers captured at best 1.7% of the average total number of opportunities per day and at worst 0.5%. The 1–15 minute schedule captures on average 16% fewer events than the 60-minute (i.e., static) schedule, but samples 17% more unique individuals. The 1–15 minute schedule also provides the best estimator of compliance for the duration of the shift, with a mean standard deviation of 17% versus 23% for the 60-minute schedule.
Conclusions
Our results show that observations are sensitive to different observers’ schedules and suggest the importance of using data-driven approaches to schedule hand-hygiene audits.
INTRODUCTION
Hand hygiene is a critical component of standard infection control precautions ideally practiced by all healthcare workers before and after each patient contact. While many local, national, and international initiatives have been launched [1, 2, 3] to improve hand-hygiene practices, high compliance remains an elusive goal [4] with rates among healthcare workers averaging less than 50%. [1, 3, 5]
Measurement of hand-hygiene compliance is an important component of infection control programs. [1, 3, 6] Currently, most healthcare facilities measure hand-hygiene compliance almost exclusively via direct human observation of healthcare workers. While considered the “gold standard”, [5] direct observation is labor-intensive and susceptible to observer biases. [5, 7, 8] Furthermore, the reliability of directly observed hand-hygiene audits as a reflection of overall performance can be adversely affected by sporadic or inconsistent sampling. [5] Several new technologies [9, 10, 11, 12, 13, 14, 15] offer alternatives to human observation by using technology to measure or approximate hand-hygiene compliance, but for the near future, hand-hygiene compliance will likely continue to be measured predominantly by human observers in most healthcare settings.
Despite many healthcare organizations’ reliance on human observations to monitor hand-hygiene compliance, in both research and practice, there is little guidance about exactly how many observations to collect, where observations should be made, and when to observe. Given that limited resources constrain the time available for observations in healthcare facilities, a streamlined approach for sampling hand-hygiene opportunities is needed to maximize number of opportunities and unique healthcare workers observed.
Several key knowledge gaps remain, including the best approaches to the timing, placement, and movement of observers. We conducted a series of computer simulations using real-world healthcare-worker-movement data from a medical intensive care unit (MICU) to explore how variations in observer schedules and placement influence the number of events observed, hand-hygiene compliance estimates and their precision, and the diversity of healthcare workers observed by human auditors.
METHODS
We deployed a mobile-sensor network to capture detailed movement data for 6 different job categories of healthcare workers at the University of Iowa Hospital and Clinics’ (UIHC) Medical Intensive Care Unit (MICU). Our sensor network consists entirely of small, wearable credit-card-sized devices called motes. Motes are active, battery-powered, programmable devices consisting of a small processor, flash memory and an IEEE 802.15.4 compliant wireless radio. Each mote is programmed to broadcast messages to all other motes within a range of approximately 20m, while recording any messages received from other motes in memory. From each recorded message we can extract: (1) the identifier of the sending mote; (2) the received signal strength indicator (RSSI); and (3) the time the message was received. Motes communicate over unused space in the Wi-Fi spectrum and do not interfere with medical devices. Collectively the data generated on signal strengths of motes relative to each other can approximate the location of healthcare workers.
We designated 2 categories of motes in our experiment: stationary beacon motes, which were placed inside 20 patient rooms and associated hallways and nurses’ stations; and portable badge motes, which were distributed to the healthcare workers starting a shift in the area. Badges are housed inside recycled pager bodies and worn by healthcare workers. By examining the message logs of each badge, we derive a time stamped event log of healthcare worker movement in and out of patient rooms; these In Room and Out of Room events are widely recognized as practical proxy measures for hand-hygiene opportunities. Generating this event log required pre-experiment mote calibrations to define RSSI thresholds for identifying the most likely healthcare worker spatial positions for any given timestamp; a more detailed discussion of this approach has been reported previously. [15]
We observed 3 healthcare worker job types: nurses, doctors, and critical support, separated into day and night shifts, making for 6 distinct healthcare worker categories. The nurse job type included floor nurses assigned to the MICU, nursing assistants and nurse managers; the doctor category included staff physicians, fellows and residents; and the critical support job type included clerks, pharmacists and respiratory therapists.
Once deployed, our sensor network captured 14 days of healthcare worker movement data. Every morning at 7am we distributed badges to healthcare workers in each of the 3 day categories, collecting badges at 7pm the same day while simultaneously handing out badges to the 3 night categories. While each badge had a unique mote ID number, we did not record the association between mote ID and healthcare worker. In practice, healthcare workers randomly selected badges from a bin of badges designated for their job category. Note that the majority of nurses worked 12-hour shifts. Anyone leaving before 7 p.m. (days) or 7 a.m. (nights) deposited their badge in a bin when departing the unit. For physicians spanning two 12-hour shifts, they were given a new badge at the beginning of each 12-hour shift.
Using MICU architectural drawings, we calculated candidate locations for human observers to stand. In our experiment, candidate locations are those line-of-sight positions that maximize the total number of visible patient room doorways into mote-equipped rooms given a simple model of human visual capabilities in which we assume an auditor can accurately observe any event taking place within a 33 foot radius of their current location. We identified 4 such candidate locations in our MICU.
For each logged day of mote data, we stochastically generate a variety of healthcare worker hand-hygiene compliance behaviors, enabling us to simulate each shift under the assumption of different hand-hygiene compliance rates but identical healthcare worker movement. This simulation framework enabled us to quantitatively evaluate whether different observation scenarios vary in terms their ability to accurately represent overall hand-hygiene compliance within the MICU.
For each simulator trial, we create a random synthetic observer. Each observer’s schedule is designed to reflect the behavior of a human observer, walking to various locations throughout a hospital unit and conducting observations. Each observer’s schedule comprises a fixed budget of total observation time, an agenda of candidate observation locations with associated wait times, and a fixed travel-time cost for moving between observation points. Wait times correspond to the actual time spent actively observing hand-hygiene opportunities and travel time corresponds to the time spent walking to a new observation point. For purposes of this simulation, we assume that observers do not record any events while transferring between observation positions. We consider a budget of 60 minutes, a travel time cost of 2 minutes, and four categories of wait times: the intervals of 1–15 and 15–30 minutes; and fixed wait times of 30 and 60 minutes, with the last corresponding to a static observation model (i.e., the observer stays at the same candidate location for the entire one hour observation period). Each schedule’s agenda is created by randomly generating a list of locations to visit and randomly choosing wait times for each location from the wait-time category under investigation. Note, we produce each schedule by uniformly sampling within the specified interval, adding a fixed movement time between stations until the one-hour-time budget is exhausted. This random schedule is then evaluated by selecting, with uniform probability, mote data from one shift in our dataset and assessing the proportion of all opportunities observed, number of unique individuals observed, and hand-hygiene compliance rate generated by the observer schedule. For each trial, the simulator records the set of visible opportunities given the current placement of our observer in one-minute increments. At the conclusion of each trial, we then: count the total number of observed opportunities; calculate the hand-hygiene compliance percentage for this set of observations; and calculate the percentage of unique individuals seen. Since our synthetic hand-hygiene compliance rates are defined a priori, the global true compliance rate is known for any given shift and can be compared to the rate as measured by our observation schedule. We assign a fixed average compliance rate and standard deviation to each healthcare worker class (e.g., mean=60%, S.D.=30% for nurses, mean=50%, S.D.=40% for doctors, etc.); adherence for a specific hand-hygiene opportunity is then sampled from a normal distribution with this mean and standard deviation. All reported results are based on 200 trials for each data set collected during the 14 day deployment, meaning each minute in our two week deployment data set is sampled 2800 times. We report the root mean squared error (RMSE) --equal to the sample standard deviation for these simulations --over the set of replicates; a low RMSE reflects a hand-hygiene-compliance estimate that is closer to true compliance than a high RMSE because RMSE represents a measure of the difference between the estimated compliance rate and the “true” compliance rate.
All statistical tests were calculated using R, version 2.12.0; for all tests of multiple comparisons we used a Dunnett-modified Tukey-Kramer (DTK) test via the R package DTK.
RESULTS
Mote Experiment Data
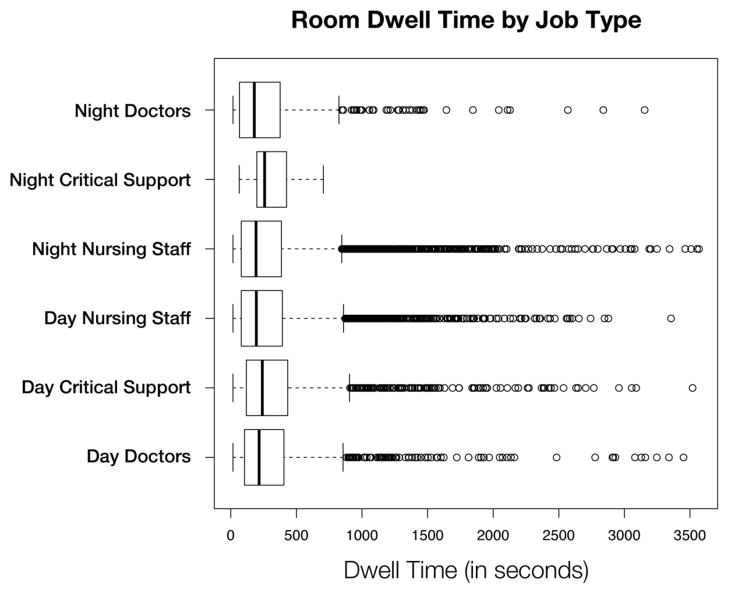
Overall, we captured 33,721 time-stamped in-room or out-of-room hand-hygiene opportunities over 14 consecutive days and nights (Figure 1). For each of these events, healthcare workers were inside a patient room (i.e., dwell time) for at least 16 seconds with a mean (.) room dwell time of 312 seconds (median=199, min=16, max=3568). Between 7am and 7pm, 19,321 events (57.3%) occurred, while 14,400 events (42.7%) occurred between 7pm and 7am. During the day, each room had on average 65 events, (median=62, min=2, max=196) or approximately 33 healthcare worker visits per room per shift (each in-room event necessarily accompanies an out-of-room event). The night shift had an average of 52 (median=42, min=1, max=320) events per room or approximately 26 healthcare worker visits per room per shift.
Figure 1.
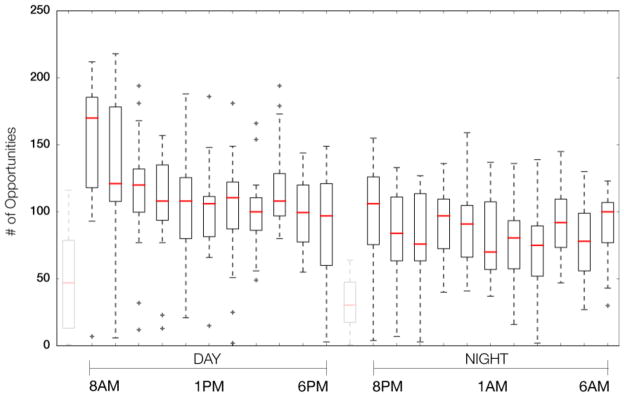
A box plot of Day/Night shift hand-hygiene opportunities by time of day. The gaps at 7am and 7pm correspond to hours where motes were being collected and/or distributed to healthcare workers; these hours are not used in our analysis.
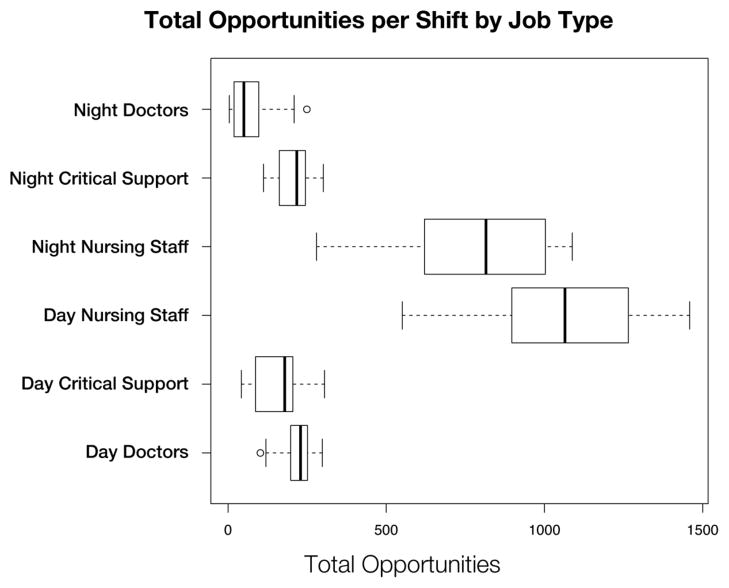
Figure 2 demonstrates the distribution of the hand-hygiene opportunities by job type. For day shifts, nurses had on average 1058 (median=1065, min=551, max=1459) daily opportunities; for night shifts, nurses had 779 daily opportunities (median=815, min=280, max=1088) on average. Overall, nurses averaged 5–10 times more opportunities per day than the other job types under observation.
Figure 2.
A box plot of the number of hand-hygiene opportunities broken down by job type.
Figure 3 shows a distribution of the dwell time for any given visit, broken down by job type. There was a statistically significant difference (p <= 0.05) between the distribution of dwell times between day critical support staff and both day and night nursing staff.
Figure 3.
A box plot of the total time spent in a patient room (i.e., dwell time) for any given visit, broken down by job type.
Simulation Results
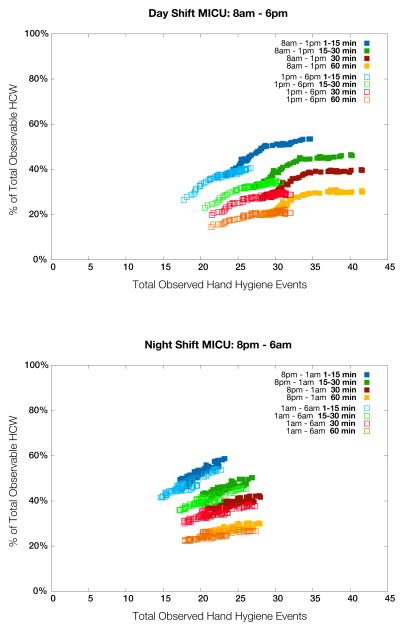
Figure 4 demonstrates the relationship between the number of hand-hygiene opportunities observed and the percentage of healthcare workers observed. Considering a 60 minute total observation period, aggregate simulated observers captured at best 1.7% of the average total number of opportunities per day and at worst 0.5%. By 12-hour shift, the simulated day-shift observers captured at best 3.0% and at worst 1.5%; the simulated night-shift observers captured at best 2.7% and at worst 1.2%. The 1–15 minute schedule captures on average, 16% fewer events than the 60-minute (i.e., static) schedule, but samples 17% more unique individuals. The 1–15 minute schedule also provides the best estimator of compliance for the duration of the shift, with a mean standard deviation of 17% versus 23% for the 60-minute schedule. Finally, Figure 5 shows the RMSE for the different simulated observer schedules.
Figure 4.
The relationship between number of hand-hygiene opportunities witnessed and the percentage of healthcare workers seen for each simulated observation schedule: day shift (upper); night shift (lower). Note the pronounced differences between the first and second half of day shifts, which can be partially explained by morning rounds, and how observed behavior is more uniform throughout the night. Similar trends were observed over weekend shifts although reduced staffing levels result in a less pronounced difference between day and night (detail not shown in figure).
Figure 5.
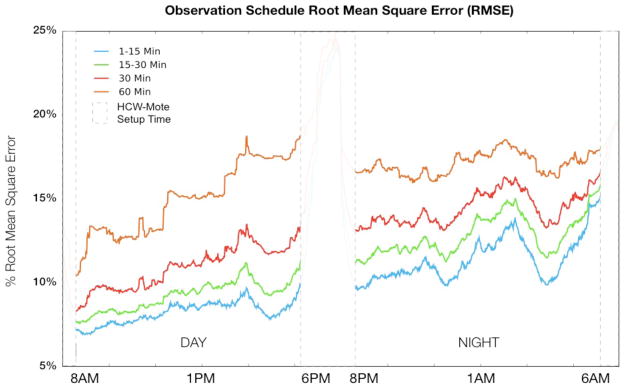
Root Mean Square Error for all 4 schedule-types by time of day. A lower RMSE reflects a better estimator of hand-hygiene compliance.
DISCUSSION
We found that one individual observing for one hour per day can, at best, capture only a very small proportion of daily observable hand-hygiene opportunities. The number of observations captured is highly dependent on when and where observations occur, factors influenced not only by the workload of the unit under observation, but also the physical structure of the unit itself. Furthermore, we found that the number of unique healthcare workers observed is dependent on the timing and location of human observers. Observers who move more frequently capture a larger sample of unique healthcare workers at the expense of missing hand-hygiene opportunities during travel time. In our simulation the best overall performance during a 1-hour observation period was obtained with many, brief (1–15 minute) observation intervals. The 1–15 minute per location schedule necessarily involves more travel time (~25% on average, ~66% at worst) between observation points. In our MICU, patient rooms are clustered together into pods; hallways connecting these pods typically do not contain patient rooms. This fact ultimately creates a deficit of observation time such that capturing the same number of overall events as the other schemes is not possible. This loss however, is mitigated by the larger diversity of individuals captured, resulting in a lower RMSE making the 1–15 minute schedule a better performing (i.e., more consistent) sampling methodology overall.
The first hour of each day shift (8 a.m.), corresponding with morning rounds, proved to be the best time to sample hand-hygiene opportunities in our MICU, typically providing the best overall estimator (i.e., the lowest RSME) of compliance for the entire shift. For the evening shift, 8pm (start of shift), midnight, and 4am provided approximately the same RMSE. We can use these results to guide future hand-hygiene audits.
To prevent the spread of nosocomial infections, a great deal of research has been devoted to increasing compliance via hand-hygiene intervention strategies. Guidance for human observation of hand-hygiene tends to focus on overall goals for compliance rates and broad recommendations for the number of observations to conduct. The Joint Commission, for example, recommends maintaining a 90% compliance rate and cites the WHO figure of 200 observations per time period for each unit or ward under observation. [16] This number, however, only speaks to the power to detect differences when comparing compliance within two observation periods and does not consider how representative the sample of observations is. Sampling guidelines that follow Lloyd [17] take the form of probabilistic approaches (i.e., various random sampling schemes) or non-probability schemes (i.e., convenience sampling, quota sampling, and judgment sampling), are typically borne out of resource-limited circumstances. While there may be a consensus that the number of observations currently performed in most facilities is too low, much less attention is focused on how methodological approaches to observation can affect the diversity of a sample population in healthcare facilities. Our mote deployment allowed us to focus on not only quantity but also diversity by capturing a large consecutive number of hand-hygiene opportunities across time and space and playing back these observations over and over with different observers.
One way to insure that the observations are more representative is to increase the number of different healthcare workers observed. Because healthcare workers tend to work within small clusters of rooms assigned to specific patients, observational schedules that limit the number of locations where observations take place can bias the sample by capturing fewer distinct healthcare workers. Increasing both the number of events seen and the number of unique individuals observed is the best strategy for reducing sampling error, but in practice a trade off exists between these two objectives. Our results suggest that frequent observer placement change is a better methodology for sampling a diversity of job types and individuals in an ICU setting. Thus, more unique observations are captured without sacrificing the number of observations. Moreover the cost associated with this change is quite minimal. For example, Figure 2 indicates that the percentage of unique healthcare workers observed can change from 20% to 40% by implementing the 1–15 min wait time compared to the 60 min wait time. This clearly indicates that moving facilitates observation of more opportunities, though none of the strategies led to more than 55% of the healthcare workers being directly observed during any given shift.
Several studies have demonstrated that improving hand hygiene can decrease healthcare-associated infections. Failure of healthcare workers to perform hand hygiene is cited as one of the leading preventable causes of healthcare-associated infections. Not all studies, however, have consistently shown that increasing hand-hygiene rates will decrease healthcare-associated infections. [18] Our simulations highlight one potential reason for these counter-intuitive results: examples where an increase in hand-hygiene rates may not decrease nosocomial infections may easily be an artifact of sampling at most 1–2% of all hand-hygiene opportunities. Clearly, healthcare workers’ hands can harbor and transmit infectious agents to patients under their care. Our simulations highlight how even attentive observers, diligently recording rates, may capture different versions of reality depending on when they started and finished and who they sampled.
Few studies have investigated the difference in observational approaches in terms of performance. An Australian ICU study also reported that conventional observation schedules detect only a small proportion of hand-hygiene opportunities.[19] However, they were only able to estimated opportunities for X-ray techs using patient visit logs as a measure of opportunities; they estimated that observers captured 3.4% of opportunities compared to our best case estimate of 1.7%. While human observers capture only a small percentage, it compares favorably to quality control samples in manufacturing outside healthcare. In addition, observations may be associated with positive externalities. For example, increasing awareness of hand hygiene, signaling administrator support, and possible increasing compliance due to an observational effect.
Our study has several limitations. First, we define opportunities as in room or out of room; this is easy for us to measure, but is it is an under-representation of what is happening in patient rooms; it does not capture the WHO 5 moments of hand hygiene. Second, there was a brief 20–40 minute period between 12 shifts during badge mote distribution that we did not capture opportunities. Thus, we did not have a complete 24/7 sample for the entire period. However, we think that during most of this period, report was being given and this period represented a period of healthcare worker-healthcare worker communication and thus fewer patient contacts. Third, we did not distribute motes to healthcare workers who visited the unit to see patients in the MICU (e.g., consulting physicians). This is an important group of healthcare workers to consider. Finally, our study was done in a single unit in a single medical center and the results may not be generalizable to other healthcare settings.
In conclusion, we show how sensitive hand-hygiene observations are to different observers’ schedules and demonstrate the importance of data-driven approaches to schedule hand-hygiene audits. Furthermore, even simple interventions in focusing audits toward peak flow times may dramatically improve the yield of audits in terms of number of observations and diversity of observations.
Acknowledgments
Financial Support: This work was supported in part from a cooperative agreement from the Centers for Disease Control and Prevention and from National Institutes of Health (Research Grants K01 AI75089 and R21-AI081164).
Footnotes
These data have been presented at the SHEA 2011 Scientific Meeting, Dallas, TX, April 1–4, 2011.
Potential conflicts of interest: No authors have any potential conflicts of interest. All authors submitted the ICMJE Form for Disclosure of Potential Conflicts of Interest, and the conflicts that the editors consider relevant to this article are disclosed here.
References
- 1.Boyce JM, Pittet D. Guidelines for Hand Hygiene in Health-Care Settings: Recommendations of the Healthcare Infection Control Practices Advisory Committee and the HICPAC/SHEA/APIC/IDSA Hand Hygiene Task Force. Infection Control and Hospital Epidemiology. 2002;23:S3–S41. doi: 10.1086/503164. [DOI] [PubMed] [Google Scholar]
- 2.Allegranzi B, Sax H, Bengaly L, Richet H, Minta DK, Chraiti MN, Sokona FM, Gayet-Ageron A, Bonnabry P, Pittet D. Successful Implementation of the World Health Organization Hand Hygiene Improvement Strategy in a Referral Hospital in Mali. Africa, Infection Control and Hospital Epidemiology. 2010;31:133–141. doi: 10.1086/649796. [DOI] [PubMed] [Google Scholar]
- 3.Pittet D, Allegranzi B, Boyce JM. The World Health Organization Guidelines on Hand Hygiene in Health Care and Their Consensus Recommendations, Infection Control and Hospital Epidemiology. World Health Organization World Alliance for Patient Safety First Global Patient Safety Challenge Core Group of Experts. 2009;30:611–622. doi: 10.1086/600379. [DOI] [PubMed] [Google Scholar]
- 4.Maskerine C, Loeb M. Improving Compliance to Hand Hygiene Among Health Care Workers. Journal of Continuing Education in the Health Professions. 2006;26:244–251. doi: 10.1002/chp.77. [DOI] [PubMed] [Google Scholar]
- 5.Haas JP, Larson EL. Measurement of Compliance with Hand Hygiene. Journal of Hospital Infection. 2007;66:6–14. doi: 10.1016/j.jhin.2006.11.013. [DOI] [PubMed] [Google Scholar]
- 6.Joint Commission on Accreditation of Healthcare Organizations. [Accessed December 2, 2009];Patient safety goals. http://www.jcaho.org/accredited+organizations/patient+safety/npsg.htm.
- 7.Adair JG. The Hawthorne Effect: A Reconsideration of the Methodological Artifact. Journal of Applied Psychology. 1984;69:334–345. [Google Scholar]
- 8.Eckmanns T, Bessert J, Behnke M, Gastmeier P, Ruden H. Compliance with Antiseptic Hand Rub Use in Intensive Care Units: The Hawthorne Effect. Infection Control and Hospital Epidemiology. 2006;27:931–934. doi: 10.1086/507294. [DOI] [PubMed] [Google Scholar]
- 9.Boscart VM, McGilton KS, Levchenko A, Hufton G, Holliday P, Fernie GR. Acceptability of a Wearable Hand Hygiene Device with Monitoring Capabilities. Journal of Hospital Infection. 2008;70:216–222. doi: 10.1016/j.jhin.2008.07.008. [DOI] [PubMed] [Google Scholar]
- 10.Boyce JM, Cooper T, Dolan MJ. Evaluation of an Electronic Device for Real-Time Measurement of Alcohol-Based Hand Rub Use. Infection Control and Hospital Epidemiology. 2009;30:1090–1095. doi: 10.1086/644756. [DOI] [PubMed] [Google Scholar]
- 11.Kinsella G, Thomas AN, Taylor RJ. Electronic Surveillance of Wall-Mounted Soap and Alcohol Gel Dispensers in an Intensive Care Unit. Journal of Hospital Infection. 2007;66:34–39. doi: 10.1016/j.jhin.2007.02.018. [DOI] [PubMed] [Google Scholar]
- 12.Larson ELS, Albrecht SO, Keefe M. Hand Hygiene Behavior in a Pediatric Emergency Department and a Pediatric Intensive Care Unit: Comparison of Use of 2 Dispenser Systems. American Journal of Critical Care. 2005;14:304–311. [PubMed] [Google Scholar]
- 13.Swoboda SM, Earsing K, Strauss K, Lane S, Lipsett PA. Isolation Status and Voice Prompts Improve Hand Hygiene. American Journal of Infection Control. 2007;35:470476. doi: 10.1016/j.ajic.2006.09.009. [DOI] [PubMed] [Google Scholar]
- 14.Venkatesh AK, Lankford MG, Rooney DM, Blachford T, Watts CM, Noskin GA. Use of Electronic Alerts to Enhance Hand Hygiene Compliance and Decrease Transmission of Vancomycin-Resistant Enterococcus in a Hematology Unit. American Journal of Infection Control. 2008;35:199–205. doi: 10.1016/j.ajic.2007.11.005. [DOI] [PubMed] [Google Scholar]
- 15.Polgreen PM, Hlady CS, Severson MA, Segre AM, Herman T. Method for Automated Monitoring of Hand Hygiene Compliance without Radio-Frequency Identification. Infect Control Hosp Epidemiol. 2010;31:1294–1297. doi: 10.1086/657333. [DOI] [PMC free article] [PubMed] [Google Scholar]
- 16.Sax H, Allegranzi B, Chraïti MN, Boyce J, Larson E, Pittet D. The World Health Organization hand hygiene observation method. Am J Infect Control. 2009 Dec;37(10):827–34. doi: 10.1016/j.ajic.2009.07.003. [DOI] [PubMed] [Google Scholar]
- 17.Lloyd RC. The search for a few good indicators. In: Ransom SC, Joshi MS, Nash DN, editors. The Healthcare Quality Book: Vision Strategy and Tools. Chicago: Health Administration Press; 2005. pp. 103–110. [Google Scholar]
- 18.Rupp ME, Fitzgerald T, Puumala S, Anderson JR, Craig R, Iwen PC, Jourdan D, Keuchel J, Marion N, Peterson D, Sholtz L, Smith V. Prospective, controlled, cross-over trial of alcohol-based hand gel in critical care units. Infect Control Hosp Epidemiol. 2008 Jan;29(1):8–15. doi: 10.1086/524333. [DOI] [PubMed] [Google Scholar]
- 19.van de Mortel T, Murgo M. An examination of covert observation and solution audit as tools to measure the success of hand hygiene interventions. Am J Infect Control. 2006;34:95–6. doi: 10.1016/j.ajic.2005.07.006. [DOI] [PubMed] [Google Scholar]


