Abstract
In real-world settings, information from multiple sensory modalities is combined to form a complete, behaviorally salient percept - a process known as multisensory integration. While deficits in auditory and visual processing are often observed in schizophrenia, little is known about how multisensory integration is affected by the disorder. The present study examined auditory, visual, and combined audio-visual processing in schizophrenia patients using high-density electrical mapping. An ecologically relevant task was used to compare unisensory and multisensory evoked potentials from schizophrenia patients to potentials from healthy normal volunteers. Analysis of unisensory responses revealed a large decrease in the N100 component of the auditory-evoked potential, as well as early differences in the visual-evoked components in the schizophrenia group. Differences in early evoked responses to multisensory stimuli were also detected. Multisensory facilitation was assessed by comparing the sum of auditory and visual evoked responses to the audio-visual evoked response. Schizophrenia patients showed a significantly greater absolute magnitude response to audio-visual stimuli than to summed unisensory stimuli when compared to healthy volunteers, indicating significantly greater multisensory facilitation in the patient group. Behavioral responses also indicated increased facilitation from multisensory stimuli. The results represent the first report of increased multisensory facilitation in schizophrenia and suggest that, although unisensory deficits are present, compensatory mechanisms may exist under certain conditions that permit improved multisensory integration in individuals afflicted with the disorder.
Keywords: schizophrenia, multisensory, audio-visual, visual-evoked potential, auditory-evoked potential, ERP
1. Introduction
Cognitive dysfunction is considered a hallmark feature of schizophrenia, but evidence suggests that disturbances in basic sensory processing may underlie many of the cognitive impairments observed (Javitt, 2009). A number of deficits have been reported in isolated sensory modalities in individuals with schizophrenia; however, it is clear that in real-world settings multiple sensory modalities interact to form a complete, unified percept (Ghazanfar and Schroeder, 2006). The impact of schizophrenia on these interactions and the resulting multisensory perceptions is not well understood.
Electrical and magnetic scalp recordings from individuals with schizophrenia have revealed several underlying physiological disturbances in auditory and visual processing. For example, the amplitude of the N100 component of the auditory-evoked potential (AEP), a large negative potential that typically peaks between 80 and 120 ms after stimulus presentation, appears to be reduced in schizophrenia (e.g. Rosburg et al., 2008). Processing deficits have also been detected in several early components of the visual evoked potential (VEP), such as the C1 (Butler et al., 2007) and the P1 components (Butler et al., 2007; Foxe et al., 2001). It appears that schizophrenia affects dorsal visual stream processing specifically, which preferentially responds to low contrast, low spatial frequency stimuli. Ventral stream visual processing, which responds to high contrast and high spatial frequency stimuli, appears to be largely spared (Butler et al., 2007; Foxe et al., 2005b; Martinez et al., 2008). Despite these well-characterized unisensory auditory and visual deficits in schizophrenia, less is known about the potential impact these impairments have on combined auditory and visual multisensory perception.
There are several lines of evidence that suggest that audio-visual speech integration may be impaired. For example, it has been demonstrated that schizophrenia patients show reduced McGurk effects. The McGurk effect is a phenomenon where an auditory syllable (e.g. /ba/) is presented simultaneously with a silent video showing a model articulating an incongruent syllable (e.g. /ga/) which results in fused or combined syllable perception (perceived as “/da/” or “/bga/”; McGurk and MacDonald, 1976). Schizophrenia patients also show reduced interference effects when detecting the emotional content of voices paired with facial expressions of a different emotion (de Jong et al., 2009), and patients benefit less from seeing the visual articulation of words when combined with noisy vocal presentations of the same words (Ross et al., 2007). It has been suggested that these deficits result from impairments in higher-order speech processing and biological motion perception networks (Ross et al., 2007; Szycik et al., 2009); however, a more general disturbance in multisensory integration may also contribute to the phenomena. Recently, Williams et al. (2010) reported that schizophrenia patients showed impairments in basic audio-visual integration using a simple target detection task without a speech component.
Physiological studies of multisensory perception in healthy participants suggest that audio-visual integration begins early in processing. Evoked potential studies indicate that integration effects can occur at time intervals comparable to the emergence of early AEP and VEP components (Foxe and Schroeder, 2005a; Giard and Peronnet, 1999), and it appears that audio-visual integration involves both the modulation of unisensory activity and activity unique to multisensory processing (Molholm et al., 2002). As reported in animal studies, multisensory stimuli frequently elicit stronger evoked responses than summed unisensory stimuli in specific cortical areas (Andersen, 1997a; Andersen, 1997b; Benevento et al., 1977; Jung et al., 1963; Meredith and Stein, 1986). This site-specific facilitation may explain increased ERP amplitudes in response to synchronous auditory and visual stimulation (Giard and Peronnet, 1999, Molholm et al., 2002, Molholm et al., 2006). While alternative explanations exist, these cannot be tested directly. However, physiological differences in the multisensory response relative to the summed unisensory responses above the level of the noise, inherently implies that physiological integration has occurred, regardless of how the underlying sources interacted to generate the facilitated ERP response. Although comparisons between summed unisensory and multisensory evoked responses have yielded evidence for physiological multisensory integration in healthy individuals, ERP measures of multisensory integration have not yet been explored in schizophrenia.
The aim of the present study was to explore basic multisensory integration in schizophrenia at the physiological level using high-density electrical scalp recordings. We compared the unisensory and multisensory responses of schizophrenia patients to healthy participants using ecologically relevant visual, auditory, and multisensory stimuli. Given the well-characterized abnormalities in early evoked visual and auditory responses, as well as behavioral deficits in basic multisensory integration, we hypothesized that comparisons between evoked multisensory and summed unisensory responses would show evidence for impaired audio-visual integration in schizophrenia patients.
2. Methods
2.1 Participants
Fifteen healthy normal volunteers (HNV) and fourteen schizophrenia patients (SP) participated in this study. Participant characteristics are summarized in Table I. All participants provided written informed consent, and procedures were conducted in accordance with the standards of the Institutional Review Board of the University of New Mexico and the Declaration of Helsinki.
Table I. Participant Characteristics.
Group means and (standard deviations) or numbers of participants for nine characteristics. WASI FSIQ: Full-scale intelligence quotient, Wechsler Abbreviated Intelligence Scale. PANSS: Positive and Negative Symptoms Scale.
| CHARACTERISTIC | SP (n = 14) | HNV (n = 15) |
|---|---|---|
| Age | 42.21 (12.69) | 37.80 (13.81) |
| Sex | 11 male, 3 female | 10 male, 5 female |
| Ethnicity | 8 Anglo/Hisp, 5 Nat. Am., 1 Afr. Am. |
5 Anglo/Hisp, 9 Nat. Am., 1 Afr. Am. |
| Education (years) | 13.14 (2.25) | 14.07 (1.62) |
| WASI FSIQ | 98.29 (19.06) | 113.27 (13.47) |
| PANSS total score | 54.29 (15.79) | - |
| - Positive symptoms | 13.36 (4.16) | - |
| - Negative symptoms | 12.64 (4.20) | - |
| Medications | 2 typical anti-psychotic, 12 atypical anti-psychotic |
- |
| OLZ equivalent (mg/day)a | 15.24 (8.94) | - |
Olanzapine dosage equivalents of antipsychotic medications (Gardner et al., 2010).
2.2 Auditory, visual, and multisensory stimuli
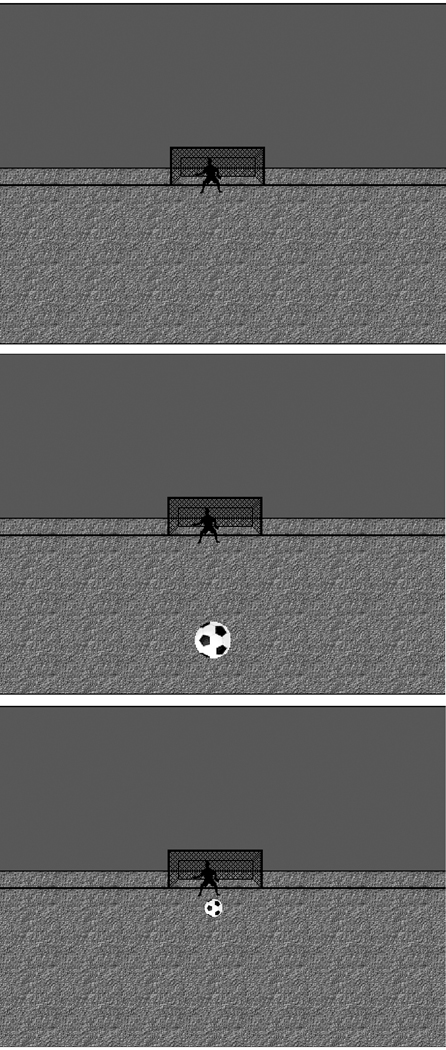
A perspective digital drawing of a soccer field was used as a background for the presentation of visual, auditory, and audio-visual stimuli (Fig. 1). On the soccer field a static goal and goalie were presented, and participants were instructed to maintain fixation on the goalie throughout the task. Two sets of stimuli were presented to each participant: One set consisted of “near” stimuli (NEAR) which simulated a stimulus nearer to the participant, while the “far” set (FAR) simulated stimuli farther away. The NEAR/FAR manipulation was implemented to assess potential differences between groups in response to central versus parafoveal visual stimuli (i.e., the FAR stimulus should evoke responses from the central retina, while the NEAR stimulus should evoke more peripheral responses). An image of a soccer ball was used as the visual stimulus. In the NEAR stimulus condition, the soccer ball appeared in the central foreground of the soccer field and occupied the participant’s lower central visual field (visual angle: 0.95°, eccentricity: 2.48°, visual frequency: 2.6 cycles/degree). In the FAR condition, the soccer ball was smaller and occupied the participant’s central visual field (angle: 0.38°, eccentricity: 0.30°, visual frequency: 6.6 cycles/degree). The auditory stimulus was a low tone used to simulate a bouncing soccer ball (550 Hz). The tone was presented at a volume of 80 dB during the NEAR condition and 64 dB during the FAR condition. For the NEAR and FAR multisensory conditions, auditory and visual stimuli were presented together. During these multisensory presentations, the visual stimulus was presented first followed by the auditory stimulus presented between 0 and 5 ms later, when accounting for both auditory and visual stimulus equipment delays. All visual stimuli were presented on a computer monitor located 1.50 m from the participant. Auditory stimuli were presented binaurally through a set of headphones.
Fig. 1. Stimuli.
Visual stimuli used during experiment. (Top) Background perspective drawing of soccer field with goalie and net. Auditory-only stimuli were presented with this background. (Middle) NEAR presentation of visual stimuli (soccer ball). (Bottom) FAR presentation of visual stimuli. The middle and bottom figures appeared during visual-only and audio-visual presentations. Participants were asked to maintain fixation on the goalie throughout the experiment.
2.3 Behavioral task
Trials consisted of a 200 ms presentation of the visual stimulus alone (VIS), the auditory stimulus alone (AUD), or both stimuli together (audio-visual, AV). During each trial the participant’s task was to determine if the presented stimulus was near or far by pressing a button on a response device with their right index finger or middle finger, respectively. NEAR and FAR VIS, AUD, and AV trial types were presented in random order. There were 20 presentations of each trial type per experimental block with a 1500 – 1900 ms interval between trials. There were five consecutive experimental blocks leading to a total of 100 trials of each trial type. In 20% of the trials, participants received feedback regarding their responses: If the participant made a correct response, the soccer ball would roll into the goal and participants would hear a “cheering crowd” sound. If the response was incorrect the soccer ball would roll away from the goal and the participant would hear a “groaning crowd” sound. Each experimental block began with instructions regarding the task, followed by a practice experimental run (five random presentations of each trial type). Trials were presented and responses recorded using Presentation software (Neurobehavioral Systems, Inc., Albany, CA). The total duration of the task was approximately 30 minutes.
2.4 EEG recording and processing
Electrophysiological data (EEG) were collected throughout the task at a sampling rate of 256 Hz using a whole-scalp, 128-channel active electrode EEG array (BioSemi Active Two System; BioSemi, Amsterdam, Netherlands).
Data from each participant were filtered with a 1 and 55 Hz bandpass, and potentials were referenced to an electrode attached to the right earlobe. Trials were extracted offline from the continuous data for each of the six trial types. Each trial was time-locked to stimulus onset for an interval of −50 to 300 ms (50 ms baseline). Trials with eye blinks, muscle movements, or noisy channels where potentials exceeded +/− 50 µV were rejected. Remaining trials were averaged for each stimulus condition for each participant. Baseline corrections were applied at each electrode by subtracting the mean baseline potentials (−50 to 0 msec pre-stimulus) from the averaged waveforms.
2.5 Analysis
2.5.1 Behavioral analysis
Group differences in performance were assessed with 3 × 2 × 2 multivariate repeated-measures analysis-of-variance tests (MANOVAs) where stimulus type (AUD, VIS, AV) and location (NEAR, FAR) were within-subjects factors, and group (SP, HNV) was a between-subjects factor. The MANOVA tests were also used to assess the redundant signal effect (RSE). The RSE occurs when reaction times to multisensory stimuli are faster than responses to unisensory stimuli (Molholm et al., 2002) and therefore provides a behavioral measure of multisensory gain.
In addition to the MANOVA tests, planned direct comparisons between SPs and HNVs were made for the NEAR and FAR AUD, VIS, and AV responses separately to determine if groups significantly differed in response to any specific stimulus type.
Because faster reaction times in the multisensory condition could occur as a result of independent activations of unisensory processes, Miller’s race model test was performed to confirm that any multisensory gains observed resulted from integration rather than independent activation. The race model compares the combined cumulative probability of reaction times in the separate unisensory conditions (AUD and VIS) to the cumulative probability of reaction times in the AV condition. Multisensory facilitation is assumed when reaction times to AV stimuli are significantly faster than combined unisensory responses (Miller, 1982). To perform the race model test, reaction times for each experimental condition (AUD, VIS, AV) were used to generate cumulative density functions. The cumulative density functions for the AUD and VIS condition were then combined (Ulrich et al., 2007). MANOVAs were performed that compared the AV density function to the combined density function at 19 different probabilities from .05 to .95. Group (SP, HNV) differences were tested as a between-subjects factor. Facilitation was considered to occur when the AV reaction time was faster than the combined unisensory reaction time at a given probability. Bonferroni corrections for multiple comparisons were applied to any significant group differences detected.
2.5.2 Evoked potential analysis
EEG evoked potentials in response to visual-only stimuli (VEP), auditory-only stimuli (AEP) and audio-visual stimuli (AVEP) were compared in SPs and HNVs.
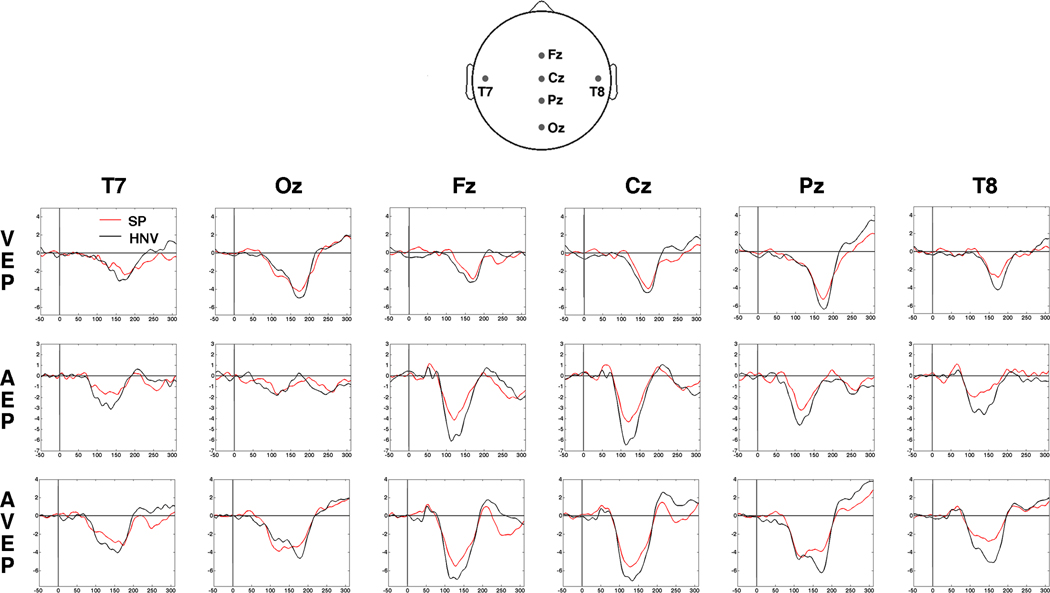
As a preliminary step, VEP, AEP, and AVEP group-averaged waveforms were examined at six electrode positions (Modified 10–20 EEG System designations: Fz, Cz, Pz, Oz, T7, and T8) to identify group differences and confirm that standard responses were obtained. Group averaged waveforms from all electrodes were then used to generate whole-scalp voltage contour maps. These contour maps were used to identify differences in the spatial topographies of voltage distributions between groups. Maps were generated every 15 ms from 50 to 200 ms post-stimulus. This early analysis interval was selected to reduce the number of timepoint comparisons and because previous reports have shown that AEP, VEP, and integration effects occur early in processing (e.g. Butler et al., 2007; Giard and Peronnet, 1999; Rosburg et al., 2008). SP and HNV maps were then visually compared at each 15 ms timepoint.
To quantify differences observed in the waveforms and voltage maps, group amplitudes were compared using running timepoint-by-timepoint independent samples t-tests (two-tailed) assessed at each scalp electrode from 50 – 200 ms post-stimulus (cf. Molholm et al., 2002). To control for multiple comparisons, it was required that t-values reached significance (p < 0.05) in at least seven adjacent scalp electrodes for at least three consecutive timepoints (21 datapoints, minimum). Requiring at least 21 datapoints of significant difference exceeds the criteria suggested by Guthrie and Buchwald (1991) when the assumption is made that adjacent datapoints are highly correlated. The electrodes and timepoints detected by these t-tests thereby delineated spatio-temporal regions where significant group differences in amplitudes occurred.
In addition to comparisons between unisensory and multisensory evoked responses, differences in multisensory facilitation between groups were also assessed. Multisensory facilitation occurs when responses to multisensory stimuli evoke a greater absolute amplitude response than the sum of evoked responses to unisensory stimuli presented alone and therefore provides a measure of physiological multisensory gain (Giard and Peronnet, 1999). In the present study, the sum of VEP and AEP amplitudes (SUM) was subtracted from the AVEP amplitude at each electrode and timepoint [AVEP − (AEP + VEP)]. This measure was calculated for each participant separately and group averaged. Between-group comparisons of this measure were assessed with timepoint-by-timepoint independent samples t-tests, and the same significance criteria were applied as in the evoked potential analysis. When t-tests reached significance, SUM and AVEP amplitudes were averaged across the significant spatio-temporal region and compared with a MANOVA test where group (SP, HNV) was a between-subjects factor. The MANOVAs were used to test specific interactions and directions of any effects observed in the t-tests.
2.5.3 Correlations between electrophysiological measures, clinical profile, and performance
Behavioral responses (AUD, VIS, AV) were correlated with significant mean AEP, VEP, and AVEP effects detected by the t-test analyses. Evoked potentials were averaged across significant electrodes and time intervals and correlated with reaction times for each participant. NEAR reaction times were only correlated with significant NEAR evoked potentials and FAR reaction times were only correlated with significant FAR potentials. In those cases where reaction times were correlated with more than one evoked potential, the α-significance threshold was divided by the number of comparisons to adjust for multiple comparisons. SP and HNV responses were combined during the correlation analyses.
Additional correlations were tested for the SP group that compared anti-psychotic medication dosages and PANSS positive and negative symptom scores to NEAR and FAR AUD, VIS, and AV reaction times. The α-significance threshold was reduced to 0.025 to account for family-wise multiple comparisons within stimulus type (i.e. NEAR and FAR for each stimulus type).
3. Results
3.1 Behavioral results
Group characteristics as well as symptom and medication ranges for the schizophrenia group are presented in Table I. Because age can significantly affect multisensory integration (Stephen et al., 2010), group differences in age were assessed. No significant difference in mean age between groups was detected (p > 0.05; Table I). As expected, there was a significant difference in IQ between groups (t27 = −2.46, p = 0.02), yet there was no significant group difference in years of education (p > 0.05). The participants were also matched on ethnicity and gender.
Mean reaction time and percent correct were averaged across trials within condition and participant. Reaction times of less than 100 ms and those that were greater than three standard deviations from the participant’s mean reaction time were excluded from the averages (cf. Molholm et al., 2002; Williams et al., 2010). Behavioral responses to visual-only stimuli were missing for two schizophrenia participants, so these participants were not included in the behavioral analyses (Behavioral N: 12 patients, 15 controls).
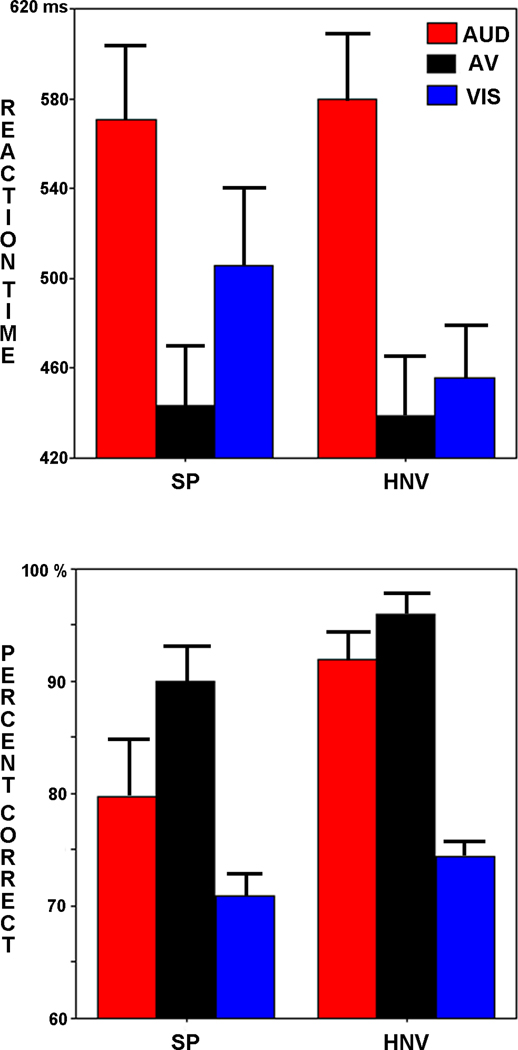
Averaged reaction time results revealed a significant main effect of stimulus type (F2,24 = 163.09, p < 0.001; Fig. 2, Left; Supplementary Material Table SI) such that AV reaction times were significantly faster than AUD reaction times (t26 = 13.72, p < 0.001) and VIS reaction times (t26 = 4.83, p < 0.001) confirming a significant RSE across groups and stimulus locations. A significant stimulus type by group interaction was also detected (F2,24 = 6.35, p = 0.006). VIS vs. AV reaction time differences were greater for SPs than HNVs (t25 = 3.55, p = 0.002), indicating that patients displayed a significantly greater RSE between these stimulus types. No NEAR vs. FAR differences or any other main effects or interactions reached significance in the reaction time analysis.
Fig. 2. Behavioral Results.
Reaction times (Top) and percents correct (Bottom). Schizophrenia patients (SP), Healthy normal volunteers (HNV). Error bars represent standard errors of the mean (SEM).
Analysis of percent correct responses also revealed a significant main effect of stimulus type (F2,24 = 471.84, p < 0.001; Fig. 2, Right; Supplementary Material Table SI). There were more correct responses to AV trials than to AUD trials (t26 = 4.38, p < 0.001) and VIS trials (t26 = 28.04, p < 0.001), corroborating the significant RSEs detected in reaction times. No other significant main effects or interactions were detected in the percent correct analysis.
Planned direct comparisons between SPs and HNVs on AUD, VIS, and AV trials revealed no significant group differences in response times (p > 0.05, all cases); however, direct comparisons of group differences in percent correct were significant in both the AUD NEAR (t25 = 2.74, p = 0.01) and AUD FAR (t25 = 2.38, p = 0.025) conditions. Percent correct in the AV NEAR condition was also significantly different between groups (t25 = 2.167, p = 0.04). In each case, HNVs had significantly more correct responses than SPs (Supplementary Material Table SI).
The test of Miller’s race model did not reveal significant facilitation at any probability and no significant group differences were detected (Supplementary Material Fig. S1).
3.2 Evoked potential results
Following artifact removal, an average of 71 trials (st.dev. = 22) across subjects and conditions remained for analysis of VEPs, AEPs, AVEPs, and facilitation. The number of trials did not significantly differ between groups (t27 = 0.21, p > 0.05). Evoked potential data from all participants had clearly recognizable components and were therefore used in the analyses, including the two subjects for whom behavioral data were not acquired (EEG N: 14 patients, 15 controls). Noisy channels and muscle artifacts were consistently detected in 15 electrodes over the central forehead in multiple participants, so these channels were excluded prior to statistical analysis.
3.2.1 VEPs
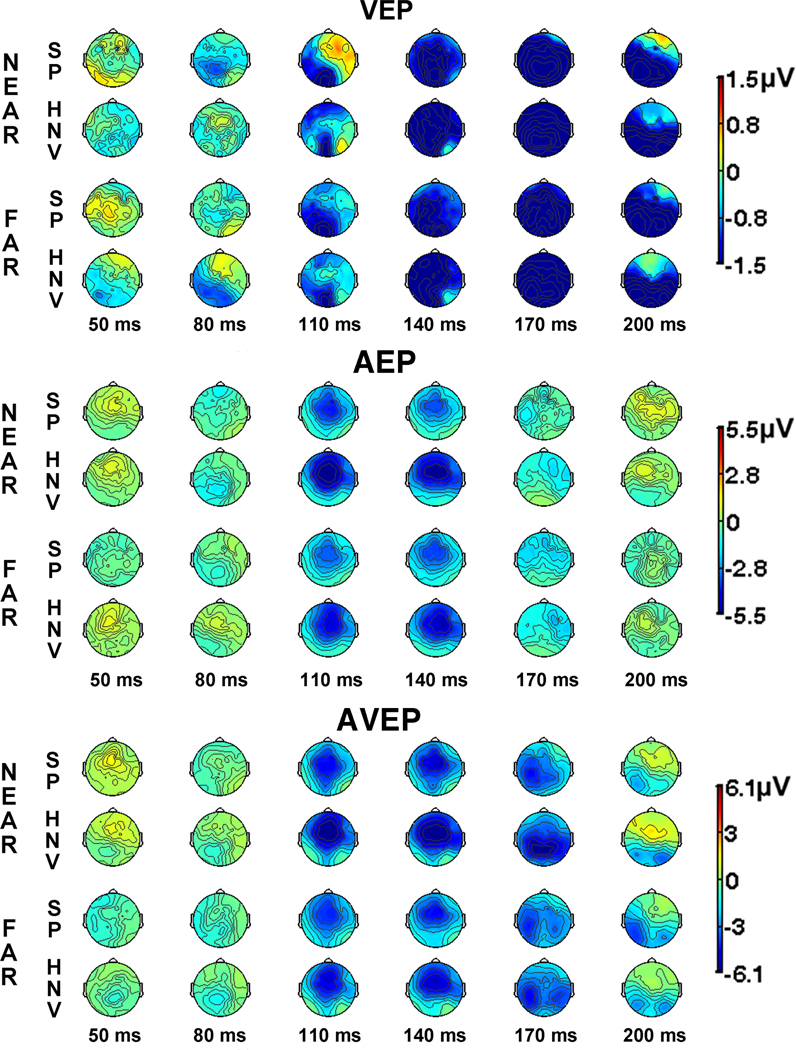
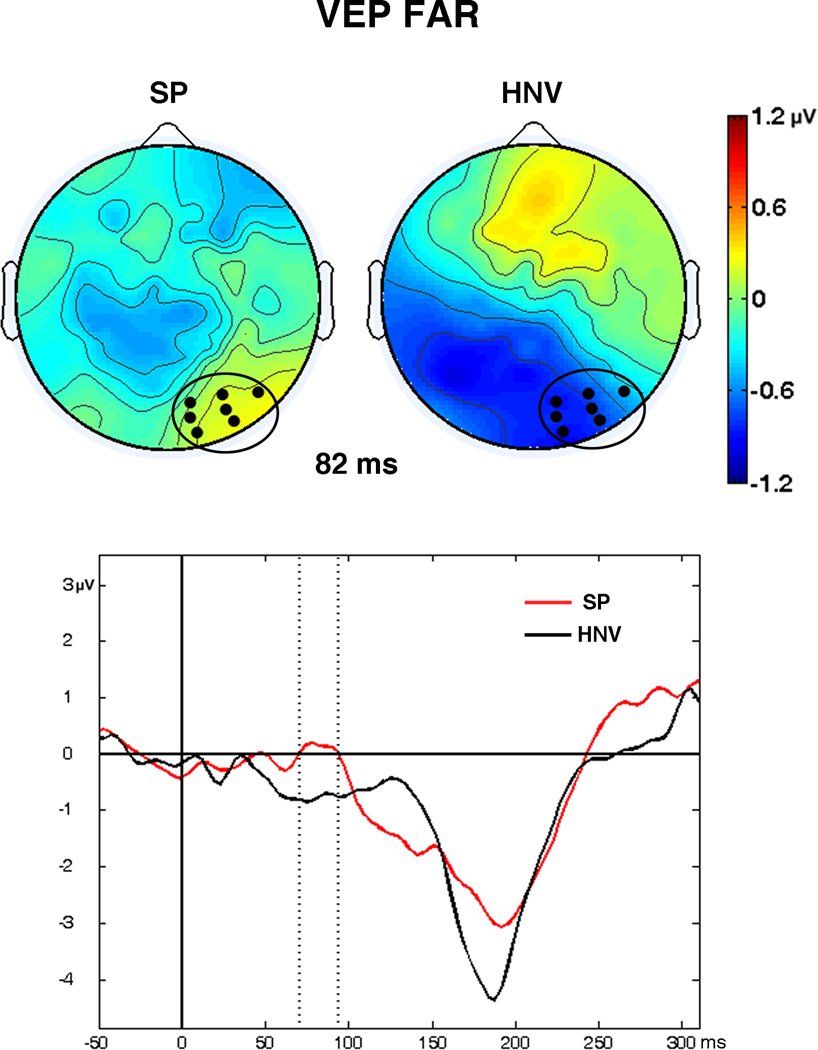
Examination of the VEP waveforms revealed standard responses with maximal evoked responses occurring at the Oz and Pz electrodes, as expected (Fig. 3). Group differences in the waveforms and scalp voltage maps emerged early in both the NEAR and FAR visual-only conditions (Figs. 3 and 4). In the FAR condition, the HNV group maps displayed a medial occipital negativity from 70 – 95 ms. In contrast, this negativity was absent from the SP voltage maps, and an SP specific positivity over right occipital regions appeared during this interval. This difference was confirmed by significant t-tests in seven adjacent right occipital electrodes from 70 – 94 ms (36 datapoints, Fig. 5). Although there were indications of differences in the VEP waveforms and voltage maps in the NEAR condition, t-test comparisons did not detect significant spatio-temporal differences between groups.
Fig. 3. Unisensory and Multisensory Waveforms.
Evoked potential waveforms for visual-only (VEP, Top Row), auditory-only (AEP, Middle Row) and audio-visual (AVEP, Bottom Row) conditions for six electrodes. Group averaged waveforms for schizophrenia patients (SP, red) and healthy normal volunteers (HNV, black) are depicted. Graphs represent waveforms from −50 to 300 ms post-stimulus. Potentials are presented in microvolts. Waveforms are depicted for responses in the NEAR condition only. (Top) Scalp map of electrode positions.
Fig. 4. Scalp Voltage Contour Maps.
(Top) Scalp contour maps from schizophrenia patients (SP) and healthy normal volunteers (HNV) depict sequential topographies of visual-evoked potentials (VEPs) during the NEAR and FAR conditions from 50 – 200 ms (30 ms intervals). (Middle) Auditory-evoked potential scalp contour maps (AEPs) from SP and HNV groups in the NEAR and FAR conditions. (Bottom) Audio-visual evoked potential scalp maps (AVEPs) from SP and HNV groups. Voltage scales appear to the right of each figure. All maps are depicted with the nose toward top of the figure, and the left and right hemispheres are represented on the left and right sides of the figures, respectively.
Fig. 5. Significant VEP Differences.
Significant visual-evoked potential differences between schizophrenia patients (SP) and controls (HNV) detected in seven right occipital electrodes from 70 – 94 ms in the FAR condition. (Top) Whole-scalp maps depict VEP voltage topographies at 82 ms. Black circles on scalp maps show the locations of the seven significant electrodes. (Bottom) Graph represents waveforms averaged across the seven electrodes for the SP (red) and HNV (black) participants from −50 to 300 ms post-stimulus. The significant time interval (70 – 94 ms) of group differences is shown between the vertical dashed lines.
3.2.2 AEPs
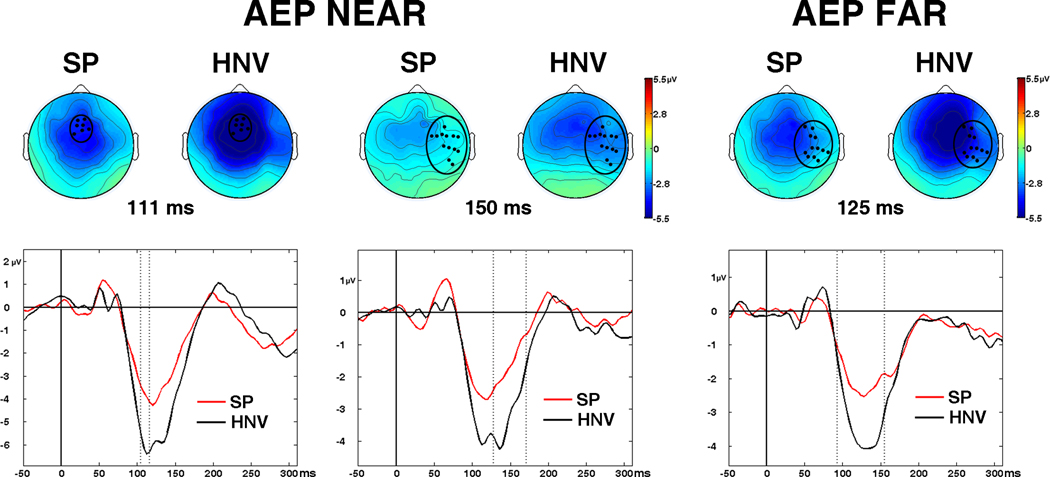
The AEP waveforms displayed large evoked responses at the midline central and frontal electrodes (Cz and Fz; Fig. 3). As expected, waveforms and scalp voltage topographies revealed a large fronto-central negativity from 100–150 ms, corresponding to the N100 component of the AEP (Figs. 3 and 4). The N100 in the SP group maps appeared attenuated in comparison to HNV responses in both NEAR and FAR conditions. This difference was confirmed by significant t-tests in the NEAR condition in 7 fronto-central electrodes from 105 to 117 ms (26 datapoints) and in 13 right temporal electrodes from 129 – 172 ms (73 datapoints, Fig. 6). In the FAR condition, t-tests reached significance in a similar right temporal region in 12 adjacent electrodes from 94 – 156 ms (65 datapoints). No other significant spatio-temporal differences were detected in the auditory-only conditions.
Fig. 6. Significant AEP Differences.
Significant auditory-evoked potential (AEP) differences between patients (SP) and controls (HNV). (Left) AEP differences in the NEAR condition detected in 7 fronto-central electrodes from 105 to 117 ms. Whole-scalp maps depict AEP voltage topographies at 111 ms. (Middle) AEP differences in the NEAR condition detected in a separate set of 13 right temporal electrodes from 129 – 172 ms. (Right) AEP differences in the FAR condition detected in 12 electrodes from 94 – 156 ms. Black circles on scalp maps show locations of significant electrodes. (Bottom) Graphs corresponding to whole-scalp maps depict amplitude waveforms averaged across significant electrodes for the SP (red) and HNV (black) groups from −50 to 300 ms post-stimulus. Significant time intervals of group differences occur between the vertical dashed lines.
3.2.3 AVEPs
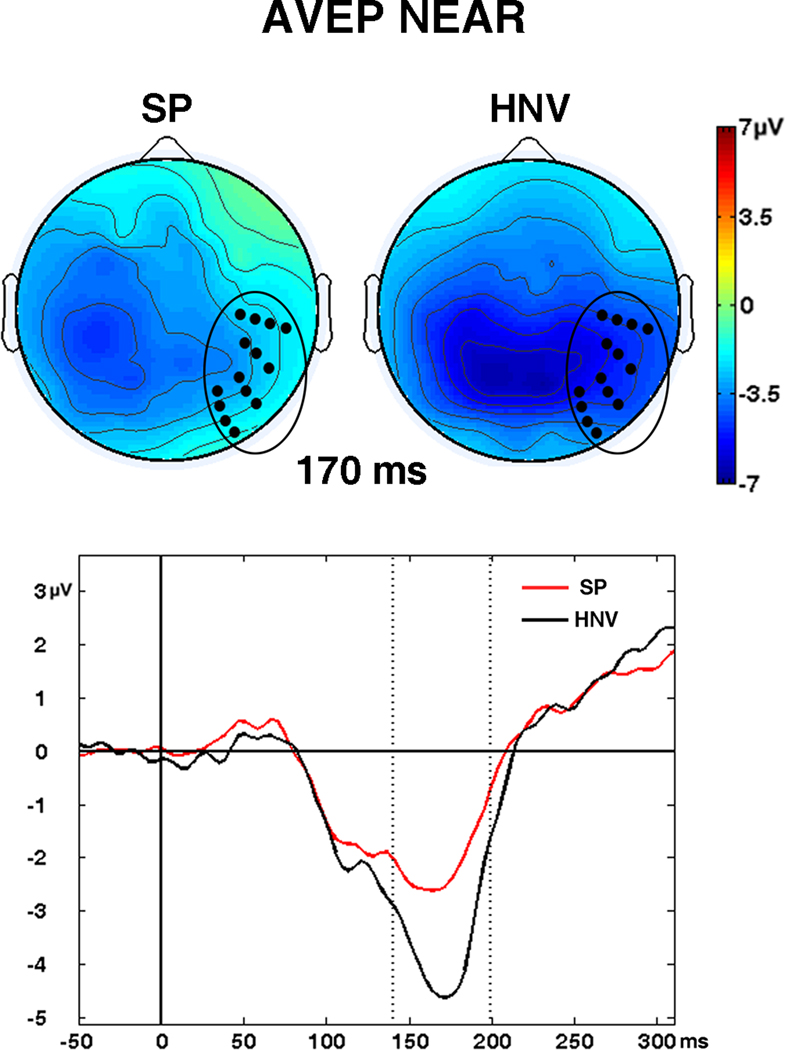
The waveforms from the AVEP condition showed the greatest responses across midline electrodes, consistent with the unisensory responses. Comparisons of waveforms and voltage maps for the AV conditions revealed a large negativity from 110 – 180 ms in the NEAR and FAR conditions which appeared larger for the HNV group (Figs. 3 and 4). Scalp maps in the NEAR condition showed that the negativity occupied medial-posterior/occipital regions for the HNV group while appearing more lateralized over left temporal-occipital regions in the SP group. These differences emerged in significant t-tests in 14 right temporal-occipital electrodes from 140 – 199 ms (72 datapoints, Fig. 7). Although a similar pattern was detected in the FAR condition, group differences failed to reach significance.
Fig. 7. Significant AVEP Differences.
Significant differences between patients (SP) and controls (HNV) in audio-visual evoked potentials (AVEPs) detected in 14 right temporal-occipital electrodes from 140 – 199 ms in the NEAR condition. Scalp maps are shown at 170 ms. Black circles on scalp maps show locations of significant electrodes. (Bottom) Graph represents waveforms averaged across the 14 significant electrodes for the SP (red) and HNV (black) groups from −50 to 300 ms post-stimulus. The significant time interval is depicted between the vertical dashed lines.
3.3 Multisensory Facilitation
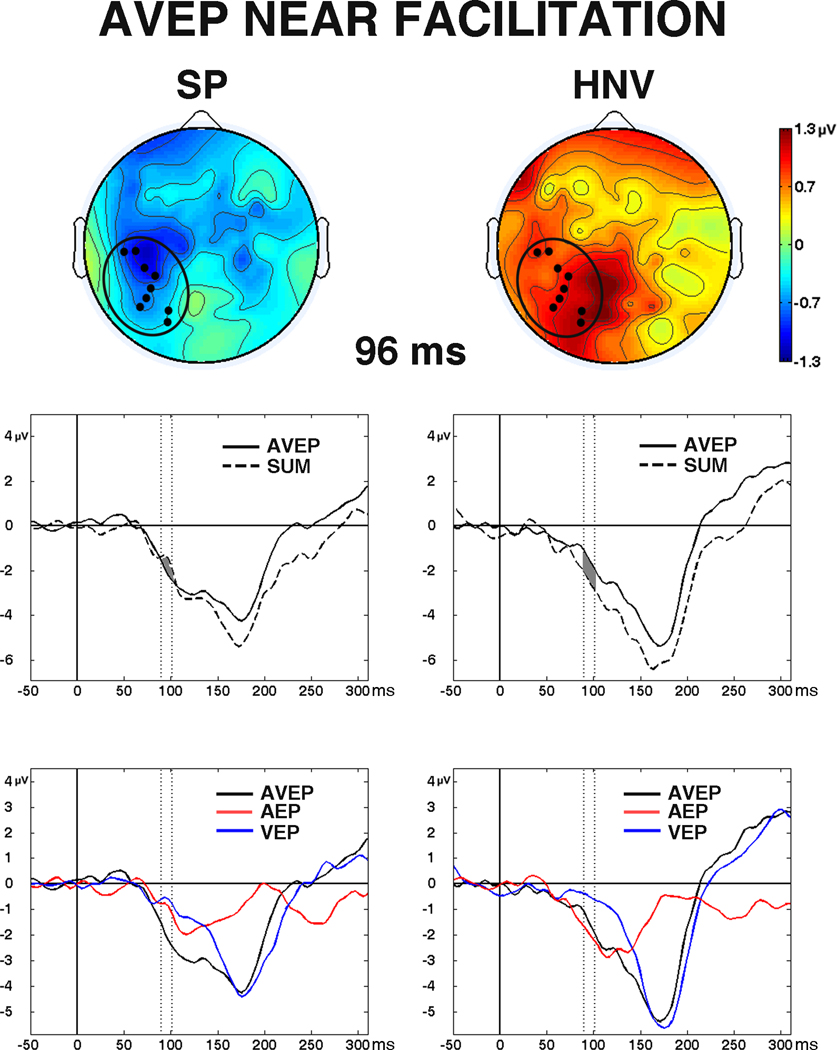
The facilitation measure [AVEP − (AEP + VEP)] was significantly different between groups in the NEAR condition, indicating group differences in multisensory facilitation. Between-groups t-tests reached significance in nine electrodes over a left hemisphere occipital-temporal region from 90 to 102 ms (29 datapoints, Fig. 8), and the MANOVA revealed a significant stimulus-type (AVEP, SUM) by group (SP, HNV) interaction in this region (F1,27 = 8.09, p = 0.008). The SP group showed greater magnitude AVEP responses than SUM responses, indicating facilitation, while the HNV group showed the opposite pattern. No significant group differences in multisensory facilitation were observed in the FAR condition (see Supplementary Material Fig. S2).
Fig. 8. Significant Differences in Multisensory Facilitation.
Significant differences in multisensory facilitation detected in the NEAR condition. (Top) Scalp topography difference maps from the patient (SP) and control (HNV) groups at 96 ms. Maps were generated by subtracting the sum of AEP and VEP (SUM) from AVEP voltages [AVEP − (AEP + VEP)]. Black circles represent locations of the nine electrodes where significant differences were detected. (Middle) AVEP vs. SUM waveforms for the SP group (left) and HNV group (right) averaged across the nine electrodes from −50 to 300 ms post-stimulus. Time interval of significant difference between groups (90 – 102 ms) is indicated by the dark gray region between waveforms. (Bottom) SP (left) and HNV (right) AVEP, AEP, and VEP waveforms averaged across the nine significant electrodes. Regions between vertical dashed lines represent the significant time interval (90 – 102 ms).
3.4 Correlation Results
A significant correlation was detected between mean NEAR AUD reaction times and mean amplitudes from both significant AEP NEAR spatio-temporal regions (medial-central region: n = 27, r = 0.45, p = 0.020; right temporal region: n = 27, r = 0.46, p = 0.016). The correlations revealed that faster reaction times positively covaried with greater (i.e. more negative) N100 amplitudes. No other significant correlations between evoked responses and performance were detected (p > 0.05, all cases).
Correlation tests between SP olanzapine-equivalent dosages and behavioral performance were also tested. These tests yielded significant positive correlations between dosage and reaction times to FAR AUD (n = 12, r = 0.65, p = 0.022) and FAR AV (n = 12, r = 0.65, p = 0.021) stimuli, indicating that anti-psychotic medication increased reaction times for SPs in these conditions.
Additional correlations were tested between PANSS positive and negative symptom scores and performance. None of these tests yielded significant results (p > 0.025, all tests).
4. Discussion
This report represents the first characterization of basic multisensory integration in schizophrenia at the physiological level. Our aim was to explore differences in behavioral and physiological multisensory integration between schizophrenia patients and healthy controls. We observed significant early alterations in the processing of visual and auditory unisensory stimuli among patients, as well as early differences in multisensory responses. Multisensory integration was assessed by comparing summed auditory-only and visual-only responses to responses from simultaneous audio-visual presentations; a greater response to multisensory stimuli than to summed unisensory responses indicates that facilitation has occurred. Surprisingly, schizophrenia patients displayed increased multisensory facilitation compared to the control group, both behaviorally and physiologically, despite significant unisensory deficits.
As predicted, significant differences between patients and controls emerged in the early evoked responses to unisensory stimuli. Previous research has demonstrated altered early evoked responses to visual stimuli in schizophrenia, which may occur because of alterations in C1 or P1 component generators (Butler et al., 2007; Foxe et al., 2001). Additionally, reduced auditory N100 amplitudes have been widely reported (for a review, see Rosburg et al., 2008). Our findings substantiate these reports of early evoked unisensory deficits in schizophrenia.
Significant differences in responses to audio-visual stimuli were detected, as well. However, analysis of the audio-visual responses in isolation cannot determine whether these differences occurred as a result of unisensory differences or differences in multisensory integration. Therefore, we compared audio-visual responses to summed auditory-only and visual-only responses to assess differences in integration. Contrary to our original hypothesis, comparisons between unisensory and multisensory responses revealed significantly greater multisensory gains in schizophrenia patients, both in terms of behavioral performance and evoked brain responses. To our knowledge, this is the first report of increased multisensory facilitation in schizophrenia patients. The few previous reports on basic multisensory integration in schizophrenia have yielded mixed results. In an early study by de Gelder et al. (2002), the authors found that schizophrenia patients performed as well as healthy controls on a spatial localization task using simple audio-visual stimuli, and deficits only emerged during the integration of auditory and visual speech. In contrast, Williams et al. (2010) recently compared patients and controls on a simple audio-visual target detection task and assessed integration by comparing multisensory reaction times to race model predictions. The authors found reduced facilitation in patients in terms of significantly fewer quantiles where race model violations occurred. Because significant methodological differences exist between these previous studies and our own, it remains unclear under what conditions patients receive a benefit from multisensory presentations. Although our race model tests did not reveal significant group differences, direct comparisons of mean reaction times revealed a significant redundant signal effect in the patient group compared to controls, suggesting that the increased multisensory benefit observed in the present study was the result of greater unisensory deficits in our patients. According to the inverse effectiveness model, multisensory gains are greatest when the incoming signal is weakest, i.e. the redundant signals are most beneficial when the unisensory signals are weak (Meredith and Stein, 1983; Meredith and Stein, 1986). In contrast, the Williams study did not directly compare mean unisensory and multisensory responses. Although Williams and colleagues found reduced facilitation, the gains we observed in the present study were driven by greater unisensory deficits and enhanced redundant signal effects in our patients.
Interestingly, the increased multisensory facilitation that we observed in performance was accompanied by evidence of physiological facilitation. Evoked responses to audio-visual stimuli were greater in absolute magnitude than combined auditory-only and visual-only responses in schizophrenia patients but not in healthy controls. Although our exploratory analysis of evoked potentials indicates potential multisensory facilitation in schizophrenia, it remains unclear how different cortical and subcortical regions may have contributed to these results. Several models of multisensory processing in the human cortex have been proposed (for a review, see Driver and Noesselt, 2008). Historically, models have emphasized putative polysensory areas in multisensory integration, although emerging evidence suggests that cross-modal interactions between primary or secondary sensory cortices may also contribute to the process (Brett-Green et al., 2003; Fu et al., 2003; Martuzzi et al., 2007; Murray et al., 2005; Raij et al., 2010; Schroeder et al., 2001). Research on the cortical substrates of multisensory processing in schizophrenia is sparse. An exception is the recent study by Szycik et al. (2009) which examined audio-visual speech integration in schizophrenia patients using fMRI. The authors found multiple atypical activations in frontal, temporal, and parietal cortices in patients during the presentation of congruent and incongruent speech stimuli. These researchers interpreted their findings as evidence of compromised functioning in language processing and facial recognition networks. However, activations in primary sensory and polysensory areas, such as the superior colliculus and posterior parietal cortex, showed no significant differences between schizophrenia patients and controls. It is possible that schizophrenia may impact higher-order cortical regions during speech integration tasks while regions involved in early multisensory processing remain unaffected. At any rate, the contributions of polysensory areas and the possibility of cross-modal unisensory interactions during multisensory integration in schizophrenia are still largely unknown. Utilization of multiple neuroimaging tools, as well as analysis of the neural sources which generate unisensory and multisensory evoked responses, may elucidate which cortical substrates are involved.
Schizophrenia is a complex disorder and multisensory integration is a complex process, even when the simplest stimuli are considered. Our findings demonstrate increased multisensory facilitation in schizophrenia, both in terms of task performance and brain response. However, unisensory deficits persist, and previous findings suggest that multisensory processing is still affected by the disorder, at least in some conditions. Further research is needed to replicate and extend our initial findings and determine which circumstances give rise to improved functioning. Conflicting reports of behavioral facilitation in schizophrenia raise questions about which symptoms or task paradigms have the greatest impact on performance. In addition, questions remain regarding the physiological mechanisms underpinning multisensory integration in schizophrenia and the impact of clinical symptoms and anti-psychotic medications on multisensory processes.
Although widespread cognitive and perceptual deficits in schizophrenia are frequently reported, there are ‘islands’ of cognitive functioning that appear to be spared in the disorder (Gold et al., 2009). Our results indicate that basic multisensory processing, at least under some conditions, may represent one type of spared functioning. Despite deficits in auditory and visual perception, improved multisensory performance offers possibilities for exploring new clinical interventions which may ultimately provide a better quality of life for patients with schizophrenia.
Highlights.
-
>
Unisensory and multisensory processing were examined in schizophrenia and controls.
-
>
Facilitation was assessed by comparing summed unisensory to multisensory responses.
-
>
Early unisensory and multisensory differences were observed between groups.
-
>
Behavioral measures revealed increased multisensory facilitation in schizophrenia.
-
>
Evoked potentials also revealed greater multisensory facilitation in schizophrenia.
Supplementary Material
Cumulative probabilities for multisensory (AV) and combined auditory-only and visual-only (PRED) reaction times for schizophrenia patients (SP, Left) and healthy normal volunteers (HNV, Right). No significant facilitation and no significant group differences were detected.
Means and (SEM) of reaction times and percents correct for the six behavioral conditions for patients (SP), controls (HNV), and all (ALL) participants.
Acknowledgements
We thank the Administrative and Clinical Core team for their assistance with participant recruitment and assessment. We thank Vince Calhoun for his overall support of this project as the PI of the COBRE. We thank Lucinda Romero for her help with data collection.
Funding for this study was provided by The National Institutes of Health and the National Center for Research Resources, NCRR #1P20RR021938-01.
Footnotes
Publisher's Disclaimer: This is a PDF file of an unedited manuscript that has been accepted for publication. As a service to our customers we are providing this early version of the manuscript. The manuscript will undergo copyediting, typesetting, and review of the resulting proof before it is published in its final citable form. Please note that during the production process errors may be discovered which could affect the content, and all legal disclaimers that apply to the journal pertain.
Contributor Information
David B. Stone, Email: dstone@unm.edu.
Laura J. Urrea, Email: lurrea@mrn.org.
Cheryl J. Aine, Email: caine@mrn.org.
Juan R. Bustillo, Email: jbustillo@salud.unm.edu.
Vincent P. Clark, Email: vclark@mrn.org.
Julia M. Stephen, Email: jstephen@mrn.org.
References
- Andersen RA. Multimodal integration for the representation of space in the posterior parietal cortex. Philosophical Transactions of the Royal Society of London Series B-Biological Sciences. 1997a;352:1421–1428. doi: 10.1098/rstb.1997.0128. [DOI] [PMC free article] [PubMed] [Google Scholar]
- Andersen RA, Snyder LH, Bradley DC, Xing J. Multimodal representation of space in the posterior parietal cortex and its use in planning movements. Annual Review of Neuroscience. 1997b;20:303–330. doi: 10.1146/annurev.neuro.20.1.303. [DOI] [PubMed] [Google Scholar]
- Benevento LA, Fallon J, Davis BJ, Rezak M. Auditory-visual interaction in single cells in cortex of superior temporal sulcus and orbital frontal cortex of macaque monkey. Experimental Neurology. 1977;57:849–872. doi: 10.1016/0014-4886(77)90112-1. [DOI] [PubMed] [Google Scholar]
- Brett-Green B, Fifkova E, Larue DT, Winer JA, Barth DS. A multisensory zone in rat parietotemporal cortex: Intra- and extracellular physiology and thalamocortical connections. Journal of Comparative Neurology. 2003;460:223–237. doi: 10.1002/cne.10637. [DOI] [PubMed] [Google Scholar]
- Butler PD, Martinez A, Foxe JJ, Kim D, Zemon V, Silipo G, Mahoney J, Shpaner M, Jalbrzikowski M, Javitt DC. Subcortical visual dysfunction in schizophrenia drives secondary cortical impairments. Brain. 2007;130:417–430. doi: 10.1093/brain/awl233. [DOI] [PMC free article] [PubMed] [Google Scholar]
- de Gelder B, Vroomen J, Annen L, Masthof E, Hodiamont P. Audio-visual integration in schizophrenia. Schizophrenia Research. 2002;59:211–218. doi: 10.1016/s0920-9964(01)00344-9. [DOI] [PubMed] [Google Scholar]
- de Jong JJ, Hodiamont PPG, Van den Stock J, de Geldera B. Audiovisual emotion recognition in schizophrenia: Reduced integration of facial and vocal affect. Schizophrenia Research. 2009;107:286–293. doi: 10.1016/j.schres.2008.10.001. [DOI] [PubMed] [Google Scholar]
- Driver J, Noesselt T. Multisensory interplay reveals crossmodal influences on 'sensory-specific' brain regions, neural responses, and judgments. Neuron. 2008;57:11–23. doi: 10.1016/j.neuron.2007.12.013. [DOI] [PMC free article] [PubMed] [Google Scholar]
- Foxe JJ, Doniger GM, Javitt DC. Early visual processing deficits in schizophrenia: impaired PI generation revealed by high-density electrical mapping. Neuroreport. 2001;12:3815–3820. doi: 10.1097/00001756-200112040-00043. [DOI] [PubMed] [Google Scholar]
- Foxe JJ, Schroeder CE. The case for feedforward multisensory convergence during early cortical processing. Neuroreport. 2005a;16:419–423. doi: 10.1097/00001756-200504040-00001. [DOI] [PubMed] [Google Scholar]
- Foxe JJ, Murray MM, Javitt DC. Filling-in in schizophrenia: A high-density electrical mapping and source-analysis investigation of illusory contour processing. Cerebral Cortex. 2005b;15:1914–1927. doi: 10.1093/cercor/bhi069. [DOI] [PubMed] [Google Scholar]
- Fu KMG, Johnston TA, Shah AS, Arnold L, Smiley J, Hackett TA, Garraghty PE, Schroeder CE. Auditory cortical neurons respond to somatosensory stimulation. Journal of Neuroscience. 2003;23:7510–7515. doi: 10.1523/JNEUROSCI.23-20-07510.2003. [DOI] [PMC free article] [PubMed] [Google Scholar]
- Gardner DM, Murphy AL, O'Donnell H, Centorrino F, Baldessarini RJ. International consensus study of antipsychotic dosing. American Journal of Psychiatry. 2010;167:686–693. doi: 10.1176/appi.ajp.2009.09060802. [DOI] [PubMed] [Google Scholar]
- Ghazanfar AA, Schroeder CE. Is neocortex essentially multisensory? Trends in Cognitive Sciences. 2006;10:278–285. doi: 10.1016/j.tics.2006.04.008. [DOI] [PubMed] [Google Scholar]
- Giard MH, Peronnet F. Auditory-visual integration during multimodal object recognition in humans: A behavioral and electrophysiological study. Journal of Cognitive Neuroscience. 1999;11:473–490. doi: 10.1162/089892999563544. [DOI] [PubMed] [Google Scholar]
- Gold JM, Hahn B, Strauss GP, Waltz JA. Turning it upside down: areas of preserved cognitive function in schizophrenia. Neuropsychology Review. 2009;19:294–311. doi: 10.1007/s11065-009-9098-x. [DOI] [PMC free article] [PubMed] [Google Scholar]
- Guthrie D, Buchwald JS. Significance testing of difference potentials. Psychophysiology. 1991;28:240–244. doi: 10.1111/j.1469-8986.1991.tb00417.x. [DOI] [PubMed] [Google Scholar]
- Javitt DC. When doors of perception close: bottom-up models of disrupted cognition in schizophrenia. Annual Review of Clinical Psychology. 2009;5:249–275. doi: 10.1146/annurev.clinpsy.032408.153502. [DOI] [PMC free article] [PubMed] [Google Scholar]
- Jung R, Kornhuber H, da Fonseca J. Multisensory convergence on cortical neurons: Neuronal effects of visual, acoustic and vestibular stimuli in the superior convolutions of the cat's cortex. Progress in Brain Research. 1963;1:207–234. [Google Scholar]
- Martinez A, Hillyard SA, Dias EC, Hagler DJ, Butler PD, Guilfoyle DN, Jalbrzikowski M, Silipo G, Javitt DC. Magnocellular pathway impairment in schizophrenia: evidence from functional magnetic resonance imaging. Journal of Neuroscience. 2008;28:7492–7500. doi: 10.1523/JNEUROSCI.1852-08.2008. [DOI] [PMC free article] [PubMed] [Google Scholar]
- Martuzzi R, Murray MM, Michel CM, Thiran JP, Maeder PP, Clarke S, Meuli RA. Multisensory interactions within human primary cortices revealed by BOLD dynamics. Cerebral Cortex. 2007;17:1672–1679. doi: 10.1093/cercor/bhl077. [DOI] [PubMed] [Google Scholar]
- McGurk H, Macdonald J. Hearing lips and seeing voices. Nature. 1976;264:746–748. doi: 10.1038/264746a0. [DOI] [PubMed] [Google Scholar]
- Meredith MA, Stein BE. Interactions among converging sensory inputs in the superior colliculus. Science. 1983;221:389–391. doi: 10.1126/science.6867718. [DOI] [PubMed] [Google Scholar]
- Meredith MA, Stein BE. Visual, auditory, and somatosensory convergence on cells in superior colliculus results in multisensory integration. Journal of Neurophysiology. 1986;56:640–662. doi: 10.1152/jn.1986.56.3.640. [DOI] [PubMed] [Google Scholar]
- Miller J. Divided attention - evidence for co-activation with redundant signals. Cognitive Psychology. 1982;14:247–279. doi: 10.1016/0010-0285(82)90010-x. [DOI] [PubMed] [Google Scholar]
- Molholm S, Ritter W, Murray MM, Javitt DC, Schroeder CE, Foxe JJ. Multisensory auditory-visual interactions during early sensory processing in humans: a high-density electrical mapping study. Cognitive Brain Research. 2002;14:115–128. doi: 10.1016/s0926-6410(02)00066-6. [DOI] [PubMed] [Google Scholar]
- Molholm S, Sehatpour P, Mehta AD, Shpaner M, Gomez-Ramirez M, Ortigue S, Dyke JP, Schwartz TH, Foxe JJ. Audio-visual multisensory integration in superior parietal lobule revealed by human intracranial recordings. Journal of Neurophysiology. 2006;96:721–729. doi: 10.1152/jn.00285.2006. [DOI] [PubMed] [Google Scholar]
- Murray MM, Molholm S, Michel CM, Heslenfeld DJ, Ritter W, Javitt DC, Schroeder CE, Foxe JJ. Grabbing your ear: Rapid auditory-somatosensory multisensory interactions in low-level sensory cortices are not constrained by stimulus alignment. Cerebral Cortex. 2005;15:963–974. doi: 10.1093/cercor/bhh197. [DOI] [PubMed] [Google Scholar]
- Pearl D, Yodashkin-Porat D, Katz N, Valevski A, Aizenberg D, Sigler M, Weizman A, Kikinzon L. Differences in audiovisual integration, as measured by McGurk phenomenon, among adult and adolescent patients with schizophrenia and age-matched healthy control groups. Comprehensive Psychiatry. 2009;50:186–192. doi: 10.1016/j.comppsych.2008.06.004. [DOI] [PubMed] [Google Scholar]
- Raij T, Ahveninen J, Lin FH, Witzel T, Jaaskelainen IP, Letham B, Israeli E, Sahyoun C, Vasios C, Stufflebeam S, Hamalainen M, Belliveau JW. Onset timing of cross-sensory activations and multisensory interactions in auditory and visual sensory cortices. European Journal of Neuroscience. 2010;31:1772–1782. doi: 10.1111/j.1460-9568.2010.07213.x. [DOI] [PMC free article] [PubMed] [Google Scholar]
- Rosburg T, Boutros NN, Ford JM. Reduced auditory evoked potential component N100 in schizophrenia - a critical review. Psychiatry Research. 2008;161:259–274. doi: 10.1016/j.psychres.2008.03.017. [DOI] [PubMed] [Google Scholar]
- Ross LA, Saint-Amour D, Leavitt VM, Molholm S, Javitt DC, Foxe JJ. Impaired multisensory processing in schizophrenia: deficits in the visual enhancement of speech comprehension under noisy environmental conditions. Schizophrenia Research. 2007;97:173–183. doi: 10.1016/j.schres.2007.08.008. [DOI] [PubMed] [Google Scholar]
- Schroeder CE, Lindsley RW, Specht C, Marcovici A, Smiley JF, Javitt DC. Somatosensory input to auditory association cortex in the macaque monkey. Journal of Neurophysiology. 2001;85:1322–1327. doi: 10.1152/jn.2001.85.3.1322. [DOI] [PubMed] [Google Scholar]
- Stephen JM, Knoefel JE, Adair J, Hart B, Aine CJ. Aging-related changes in auditory and visual integration measured with MEG. Neuroscience Letters. 2010;484:76–80. doi: 10.1016/j.neulet.2010.08.023. [DOI] [PMC free article] [PubMed] [Google Scholar]
- Szycik GR, Munte TF, Dillo W, Mohammadi B, Samii A, Emrich HM, Dietrich DE. Audiovisual integration of speech is disturbed in schizophrenia: An fMRI study. Schizophrenia Research. 2009;110:111–118. doi: 10.1016/j.schres.2009.03.003. [DOI] [PubMed] [Google Scholar]
- Ulrich R, Miller J, Schroter H. Testing the race model inequality: An algorithm and computer programs. Behavior Research Methods. 2007;39:291–302. doi: 10.3758/bf03193160. [DOI] [PubMed] [Google Scholar]
- Williams LE, Light GA, Braff DL, Ramachandran VS. Reduced multisensory integration in patients with schizophrenia on a target detection task. Neuropsychologia. 2010;48:3128–3136. doi: 10.1016/j.neuropsychologia.2010.06.028. [DOI] [PMC free article] [PubMed] [Google Scholar]
Associated Data
This section collects any data citations, data availability statements, or supplementary materials included in this article.
Supplementary Materials
Cumulative probabilities for multisensory (AV) and combined auditory-only and visual-only (PRED) reaction times for schizophrenia patients (SP, Left) and healthy normal volunteers (HNV, Right). No significant facilitation and no significant group differences were detected.
Means and (SEM) of reaction times and percents correct for the six behavioral conditions for patients (SP), controls (HNV), and all (ALL) participants.


