

Abstract
α-Conotoxin MII (α-CTxMII) is a potent and selective peptide antagonist of neuronal nicotinic acetylcholine receptors (nAChRs). Studies have shown that His9 and His12 are significant determinants of toxin binding affinity for nAChR, while Glu11 may dictate differential toxin affinity between nAChR isoforms. The protonation state of these histidine residues and therefore the charge on the α-conotoxin may contribute to the observed differences in binding affinity and selectivity. In this study, we assess the pH dependence of the protonation state of His9 and His12 by 1H NMR spectroscopy and constant pH molecular dynamics (CpHMD) in α-CTxMII, α-CTxMII[E11A], and the triple mutant, α-CTxMII[N5R:E11A:H12K]. The E11A mutation does not significantly perturb the pKa of His9 or His12, while N5R:E11A:H12K results in a significant decrease in the pKa value of His9. The pKa values predicted by CpHMD simulations are in good agreement with 1H NMR spectroscopy, with a mean absolute deviation from experiment of 0.3 pKa units. These results support the use of CpHMD as an efficient and inexpensive predictive tool to determine pKa values and structural features of small peptides critical to their function.
Keywords: α-Conotoxin MII (α-CTxMII), neuronal nicotinic acetylcholine receptors (nAChRs), Constant pH Molecular Dynamics (CpHMD), pKa determination, nuclear magnetic resonance spectroscopy
I. INTRODUCTION
Conotoxins are small cysteine rich peptides isolated from the venom of predatory marine snails of the genus Conus.(1) There are approximately 500 species of cone snail, each with a peptide rich venom.(2) Conotoxins are categorized based on species of origin, sequence commonality, cysteine pattern, cysteine connectivity, and target receptor. These peptides have been extensively studied for over thirty years because they are among the most potent and selective molecular probes for biological receptors.(3–5) Here we focus on α-conotoxin MII (α-CTxMII), a 16 amino acid peptide with the sequence GCCSNPVCHLEHSNLC, and disulfide bonds from Cys2 to Cys8 and Cys3 to Cys16.
α-CTxMII has been identified as a potent antagonist of nicotinic acetylcholine receptors (nAChRs) with an IC50 of 0.5 nM.(6) nAChRs are heteropentameric members of the ligand-gated ion channel superfamily that regulate release of the neurotransmitter dopamine. To date, ten different α-β subunit combinations of nAChRs have been characterized.(7–10) Pentameric nAChRs in the brain consist of α6α4β2β3 and α6β2β3 containing nAChRs, and specifically, it is the α6α4β2β3 containing nAChRs on nerve cells that are degraded in Parkinson’s patients.(11, 12) Unfortunately, the α6 subunit is highly homologous to the α3 subunit, which is found throughout the body, making development of an effective molecular probe able to distinguish between the two channels difficult.(13)
Native α-CTxMII inhibits α6β2 subunits, however it also binds with similar affinity to α3β2 subunits. Experiments have shown various mutations of α-CTxMII can drastically alter the selectivity and the potency of the peptide towards certain nAChR subunit combinations.(13, 14) Specifically of interest here, is an E11A mutation of α-CTxMII was found to show a 50-fold preference for binding to the α6β2 subunit pair over the α3β2 subunit pair.(13) Subsequent studies of the E11A mutant have confirmed the ability of the mutant to differentiate between nAChRs containing the α6β2 combination in the striatum of mouse, monkey, and humans.(11) In fact, the E11A mutant aided in the discovery that it is specifically the α6α4β2β3 containing nAChRs on nerve cells that are degraded in Parkinson’s patients.(11, 12) α-CTxMII[E11A] represent a first generation molecular probe for identifying different subunit containing nAChRs. This peptide played an important role in identifying the specific nAChR subunit combination that degrade in PD, and is a good candidate for future studies such as building a model for ligand screening and the development of diagnostic compounds and therapeutic drugs for PD. However, many obstacles remain, including identification of the underlying interactions leading to subunit specificity.
It is well known that the functionality of many biological systems is highly dependent on pH. At an atomistic level, this pH dependence is due to the changing protonation state of ionizable residues, which alters the electrostatic environment and possibly the structure and dynamics of the system. It has been shown that α-CTxMII has a higher binding affinity under more acidic conditions, and that binding activity is significantly decreased at pH’s above 7.(14) The typical bulk water pKa of a histidine imidazole ring is ~6, thus the dependency of α-CTxMII potency on pH is thought to be due to histidine protonation. This study also showed an H12A mutation reduced the potency of the peptide by >2700 fold (IC50 ~10,000 nM) in its ability to act as an antagonist to the α3β2 nAChRs expressed in Xenopus oocytes.(14) Furthermore, circular dichroism studies of the H12A analog confirmed the molecular scaffold of α-CTxMII[H12A] was conserved to a pH of 8.9, indicating the protonation of His12 is responsible for the pH dependence of α-CTxMII binding to nAChR’s.(14)
His12 protonation may also be related to the altered binding selectivity seen in α-CTxMII[E11A]. Analysis of the electronic environment surrounding His12, based on the protein data base (PDB) structures of α-CTxMII (PDB accession number 1M2C), reveals that the imidazole ring of His12 is in close proximity (4.08 Å) to the neighboring carboxylate of Glu11.(15) In the structure of α-CTxMII[E11A], the carboxylate neighboring the imidazole ring of His12 is absent, resulting in a modification of the electrostatic topography of the peptide.(16) This alteration of the electrostatic topography may be responsible for the selectivity of α-CTxMII[E11A] for α6β2 over α3β2 containing nAChRs. However, what is not known is whether the selectivity of α-CTxMII[E11A] is due to the pKa shifts of the nearby histidine residues in positions 9 and 12, the overall charge in the electronic environment, or a combination of the two factors.
In the current study, 1D 1H NMR experiments and constant pH molecular dynamics simulations (CpHMD) were utilized to examine the protonation behavior of ionizable residues in native α-CTxMII and two analogues; α-CTxMII[E11A] and α-CTxMII[N5R:E11A:H12K]. This study allowed for the evaluation of protonation behavior of α-CTxMII as relevant to binding to nAChRs, including the hypothesis that the protonation of His12 is responsible for the pH dependence seen previously in α-CTxMII. Incorporation of the α-CTxMII analogues allowed this study to evaluate the use of site-directed mutations to manipulate the pKa of ionizable residues in small peptides such as α-CTxMII. Specifically, the Glu11 to Ala11 mutant was investigated to determine the effect on the pKa of His12, and if perturbed His12 protonation could be responsible for the altered binding selectivity seen in this peptide. The Glu11 to Ala11, Asn5 to Arg5, and His12 to Lys12 mutant was created to assess the impact of these mutations on the pKa of His9. Furthermore, the Asn5 to Arg5 and His12 to Lys12 mutations ensure an electropositive nature at either end of the α-helix, which is essential for peptide-receptor binding, was retained under physiological pH. This evaluation of α-CTxMII[N5R:E11A:H12K] represents the first time this mutant has been reported. Finally, this study allowed for the evaluation of the accuracy of this CpHMD method for predicting pKa values and other structural features of small peptides such as α-CTxMII.
II. Methods
Similar system preparation protocols and methodology were implemented for all α-CTxMII variants presented in this paper unless otherwise noted.
2.1 Materials
Properly folded, high purity (>95%) α-CTxMII peptides were purchased from CS Bio Co. (Menlo Park, CA), 4,4-dimethyl-4-silapentane-1-sulfonic acid (DSS) (98%), D2O (99.9%), NaOD (99.5%), and DCl (99.8%) were purchased from Cambridge Isotope Laboratories. Standard solutions for pH calibrations were obtained from Fisher and Ricca Chemical Company. Buffering compounds were purchased from Acros Organics or Fisher and were of the highest purity available.
2.2 NMR Spectroscopy
High-resolution one-dimensional proton (1D 1H) and TOtal Corrleation SpectroscopY (TOCSY) spectra were acquired for 1.7 mM samples of α-CTxMII in 90% H2O and 10% D2O at 15°C on a Bruker Avance III NMR spectrometer at 14.1 T field strength using a TXI indirect detection probe. High-resolution 1D 1H NMR spectra were acquired with the transmitter set to the solvent resonance, and a sweep width of 12200 Hz. TOCSY spectra were obtained with the transmitter set to the solvent resonance, a 7200 Hz spectral width, and a 60 ms mixing time. The H2O resonance was manually selected for each sample and minimized using pre-saturation. Spectra were processed using Bruker Topspin (v. 2.1) software.
2.3 NMR Titrations
Peptide samples were titrated in excess of twelve steps over a pH range of 2–10. An IQ 240 pH meter was used with an ISFET micro pH probe (IQ Scientific Instruments) to measure pH values before and after the acquisition of 1D 1H spectra. Teflon tubing (4 mm O.D.) attached to a 10 μL auto pipetter was used to add 1–3 μL aliquots of concentrated (0.1–1.1 M) NaOD or DCl directly into the samples. The pH of each sample was also taken after the spectrum was acquired, and spectra were accepted only for differences of < 0.03 pH units before and after NMR analysis.(17)
2.4 Constant pH Molecular Dynamics
The theoretical background for constant pH molecular dynamics (CpHMD) has been extensively reported in the literature and therefore will only be briefly discussed here.(18, 19) The benefits of CpHMD simulations include the explicit coupling of protein conformations and the protonation states of ionizable amino acids during a molecular dynamics (MD) simulation. The CpHMD method utilized here models protein dynamics with the AMBER parm99SB force field while the solvent is represented with the Generalized-Born (GB) implicit solvent model.(20–23) Protonation states for the ionizable amino acid residues are sampled periodically using the Monte Carlo method, with the protonation transition free energy, ΔG, used as the Metropolis accept/reject criterion. The transition free energy is calculated according to equation 1:
| (1) |
where kB is the Boltzmann constant, T is temperature in Kelvin, pH is the specified solvent pH, pKa,ref is the pKa of the reference compound, ΔGe is the electrostatic component of the protonation transition energy, and ΔGe,ref is the electrostatic component of the protonation transition energy of the reference compound.
The starting configurations for the CpHMD simulation of α-CTxMII utilized NMR structural data and protonation states (PDB accession number 1M2C).(15) The two mutants, α-CTxMII[E11A] and α-CTxMII[N5R:E11A:H12K], were created using the α-CTxMII NMR structure and the site-directed mutagenesis tool in the Swiss PDB Viewer program.(24) Upon creating the relevant mutations, the Swiss PDB Viewer was used to identify the most energetically favorable side chain rotamer orientations and the new structure files were saved in the PDB format. The α-CTxMII and two mutant α-CTxMII PDBs were then used with the LEAP program in AMBER11 to create topology and coordinate files.(25) All systems were described by the parm99SB force field with the ionizable residues described by the constant pH force field as implemented in the AMBER11 code.(25) The solvent was described in an implicit fashion using the modified Generalized-Born solvent model (igb = 2),(23) with a salt concentration of 0.1 M, and a non-bonded cutoff of 30 Å. The Monte Carlo algorithm used to determine the protonation state of the ionizable residues during the CpHMD simulation was performed every 5 time steps (10 fs) with a global simulation time step of 2 fs. The length of bonds to hydrogen atoms were constrained using the SHAKE algorithm and the temperature was maintained at 300 Kelvin by use of Langevin dynamics with a collision frequency of 2 ps−1.(18, 25, 26) After the systems were created, each of the three α-CTxMII systems were subjected to 4000 steps of geometry optimization using the steepest descent algorithm. Each optimized system was then used to create a pH titration experiment. The pH titration experiment consisted of 13 separate simulations, one simulation for each pH value between 3.0 and 9.0 separated by 0.5 pH units. The three pH titration experiments (a total of 39 individual simulations) were equilibrated for 10 nanosecond (ns) followed by 60 ns of data collection in the canonical ensemble.
2.5 Determination of pKa values
The pKa of ionizable amino acid residues were independently determined by NMR experiments and computational simulations. Both methods used the creation of titration curves to approximate residue pKa values through the use of the Henderson-Hasselbalch (H-H) equation (Equation 2):
| (2) |
In NMR experiments, the chemical shift of the labile proton, δH is observed to change in response to alteration of the pH. For the purpose of calculating the pKa value of a particular ionizable residue, a method similar to that described by Silverstein was used, where the chemical shift is converted into the fraction of protonated species, α, according to equation 3:(27)
| (3) |
where Δδ is the difference between the chemical shift for the fully deprotonated species and the observed chemical shift at a given pH value (Δδ=Δδdeprotonated −δobs), and ΔδTotal is the chemical shift between the protonated and unprotonated species ΔδTotal =δprotonated −δdeprotonated). Substitution of equation 3 into equation 2 yields the following modified H-H equation (Equation 4):
| (4) |
To determine the pKa of the histidine residues, equation 4 was fit to the NMR data. In the case of the CpHMD data, a direct fit of the fractional protonated values was performed (i.e. the α in equation 4 was replaced with the percent protonated). In both cases, equation 4 was fit using an iterative algorithm that optimizes the pKa value by minimizing a built-in scoring function. The scoring function for this procedure was the root-mean squared (RMS) error between the observed chemical shift and the theoretical chemical shift at a specific pH and pKa value as determined by the H-H equation.
To determine if the H-H equation is an appropriate assumption for this system, the titration data can also be fit to the standard hill equation, which accounts for interactions between ionizable residues. The standard hill equation can be written as:
| (5) |
In equation 5, n is the hill coefficient, which is 1 for a residue that follows ideal H-H behavior. To determine n, the log10([1-α]/α) was plotted vs. pH for each set of titration data, and the slope of the line was determined by performing a least squares regression to the linear portion of the data.(18, 28) To determine the significance level at which the resulting hill coefficient differs from 1, a p-value was calculated for each titration curve, with p < 0.05 taken to indicate statistically significant none H-H behavior.(18)
In addition to the previously described H-H fitting procedure, an averaging method was also used to determine the pKa from CpHMD simulation data. This method, as previously described in the literature, involves averaging the pKa values from all simulations in which the calculated pKa is within two pKa units of the pH.(18)
III. RESULTS & DISCUSSION
3.1 NMR
High-resolution 1D 1H NMR spectra of α-CTxMII and analogs have been acquired at pHs ranging from 2–10 (Figure 2), while titration curves (Figure 3) and subsequent pKa values and hill coefficients (Table 1) have been created for the histidine residues using equation 4 and equation 5, respectively. The titration plots shown in Figure 3 indicate the H-H equation accurately represents the protonation behavior of the histidine residues, with small to moderate deviations from ideal behavior. All proteins are expected to have some degree of none H-H behavior due to interactions between ionizable residues, even small peptides such as α-CTxMII. Significant charge coupling is typically characterized by a hill coefficient that differs from 1 by >0.3,(18, 28–30) or a p-value < 0.005.(18) As table 1 shows, all residues were found to have a hill coefficient within ± 0.22 of 1, and a p-value > 0.7, indicating the H-H equation is a reasonable assumption for this system.
Figure 2.
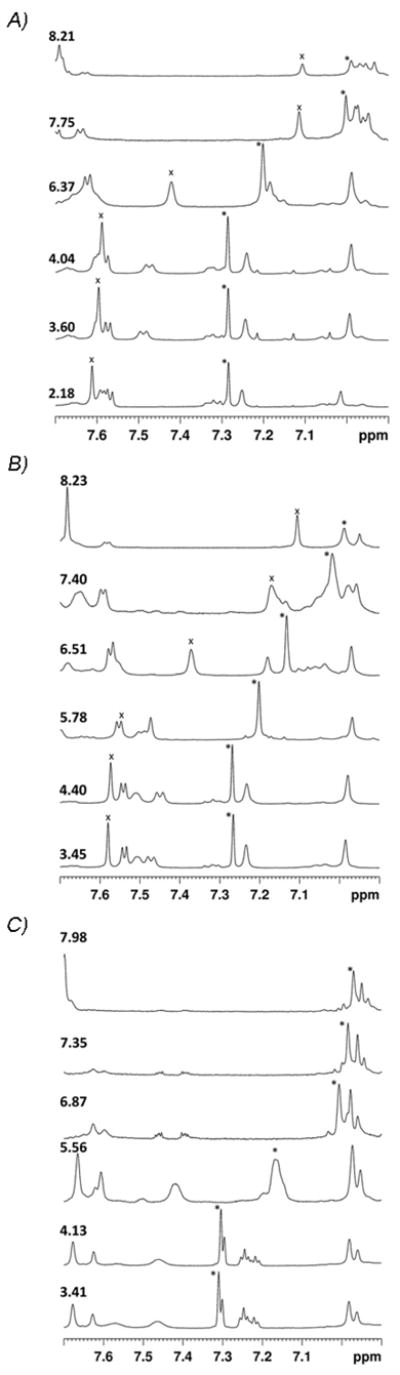
Representative high resolution 1D 1H NMR spectra of A) α-CTxMII, B) α-CTxMII[E11A], and C) α-CTxMII[N5R:E11A:H12K]. The pH value is shown for each spectrum, and the His12 C2H proton is labeled with an “x”, while the His9 C2H proton resonance is labeled with an “*”. In all cases, the spectra are stacked from low pH (bottom) to high pH (top).
Figure 3.
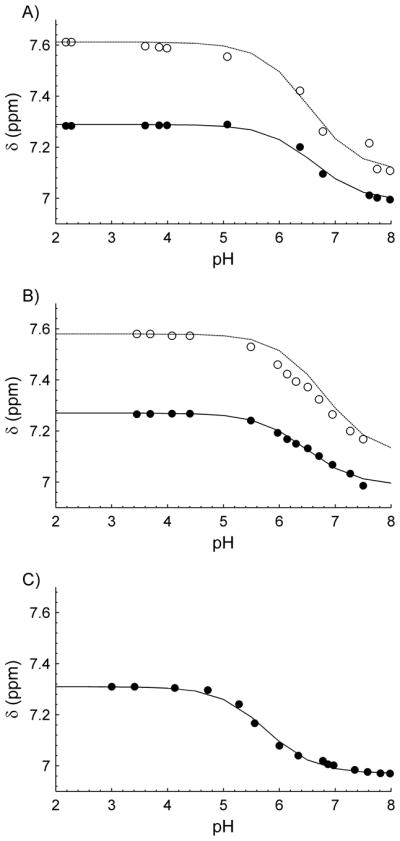
Titration curves produced from 1D 1H NMR titration experiments for A) α-CTxMII B) α-CTxMII[E11A] and C) α-CTxMII[N5R:E11A:H12K]. In all plots, His12 data are represented as open circles and the fitted H-H curve is shown as a dashed line, while data for His9 are represented as solid circles and the fitted H-H curve is shown as a solid line.
Table 1.
Comparison of pKa values, hill coefficients, and p-values obtained from 1H NMR experiments and CpHMD simulations. Standard deviations are shown in parantheses. For pKaAVG, standard deviations were obtained by splitting each simulation trajectory into three 20 ns sub-trajectories.
| NMR | Constant pH MD | |||||||
|---|---|---|---|---|---|---|---|---|
| pKa, HH | Hill Coeff. | p-value | pKaAVG | pKaHH | Hill Coeff. | p-value | ||
| MII | His9 | 6.61 | 1.22 | 0.84 | 6.54 (0.08) | 6.63 | 0.9 | 0.93 |
| Glu11 | --- | --- | --- | 4.31 (0.03) | 4.28 | 0.95 | 0.81 | |
| His12 | 6.52 | 0.82 | 0.74 | 6.74 (0.05) | 6.83 | 0.88 | 0.85 | |
|
| ||||||||
| MII-E11A | His9 | 6.48 | 0.82 | 0.85 | 6.24 (0.24) | 5.83 | 0.95 | 0.89 |
| His12 | 6.80 | 0.84 | 0.84 | 6.39 (0.11) | 6.15 | 1.19 | 0.66 | |
|
| ||||||||
| MII-N5R:E11A:H12K | His9 | 5.77 | 0.87 | 0.92 | 5.99 (0.32) | 5.94 | 0.98 | 0.94 |
| Lys12 | --- | --- | --- | 10.23 (0.07) | 10.17 | 0.98 | 0.79 | |
|
| ||||||||
| MAD | --- | --- | --- | 0.2 (0.1) | 0.4 (0.3) | |||
The pKa values in Table 1 reveal His9 and His12 in native α-CTxMII have similar pKa values of 6.61 and 6.52, respectively, while in the α-CTxMII[E11A] mutant, the pKa of His9 shows a small decrease of 0.13 and the pKa of His12 shows a small increase of 0.28. However, these small shifts in pKa are consistent with thermal fluctuations, and thus do not constitute a significant deviation. In the α-CTxMII[N5R:E11A:H12K] peptide, a more significant shift is observed for the pKa of His9, which is approximately 0.9 pKa units lower than the pKa of His9 in α-CTxMII.
Previous studies have shown that a positively charged quaternary nitrogen plays an important role in the binding of nicotine and acetylcholine to nAChR’s.(31–33) Likewise, studies have indicated that positively charged histidine residues in α-CTxMII play an important role in the binding activity. Specifically, a study on the effect of pH on the potency of native α-CTxMII acting on α3β2 subunits found that α-CTxMII was more potent under acidic conditions (pH=5.5) than physiological conditions (pH=7.2), and was ineffective under basic conditions (pH=8.9).(14) The effect of pH on toxin potency indicated that the protonation of one or both histidine residues plays an important role in the binding activity, which is supported by the current titration experiments. The pKa of His9 and His12 were found to be ~6.5, which corresponds to the histidines being 91% protonated at a pH=5.5, 20% protonated at a pH=7.2, and 0.3% protonated at a pH=8.9. Thus, protonation and potency correlate well at various pH values, supporting the hypothesis that positively charged histidine residues are necessary for binding of α-CTxMII to nAChR’s. Several studies have shown that alanine substitution at His12 has a significantly larger impact on toxin binding affinity than at His9, suggesting that the protonation state of His12 is the major factor affecting toxin potency.(13, 14) However, due to the similar pKa value of His9 and His12, the current pKa results do not rule out the protonation of His9 as a contributing factor to the observed pH dependence of α-CTxMII potency.
Although results seen here support the importance of His12’s protonation state, the pKa values of His12 (and His9) are similar in the α-CTxMII and α-CTxMII[E11A] peptides. Thus, it does not appear that Glu11 has a substantial effect on the observed pKa of His12, indicating factors other than His12 protonation are responsible for the selectivity seen in the α-CTxMII[E11A] mutant. A possible contribution to the change in selectivity could be the disruption of the α-helical content in the α-CTxMII[E11A] mutant. However, 1H NMR structural data show the α-helical content in the E11A mutant is highly conserved, making it likely the removal of the negatively charged Glu11 itself causes the altered selectivity. In addition, it is possible that the small shift (+0.3) in the pKa of His12 in α-CTxMII[E11A], or other factors involving His12, are responsible for the altered selectivity.
This study represents the first reporting of the α-CTxMII[N5R:E11A:H12K] analogue. The N5R and H12K mutations ensure either end of the α-helix, which spans from Asn5 to Ser13, retains a positively charged nitrogen under physiological pH conditions. As discussed above, a quaternary, positively charged nitrogen atom has been shown to play a crucial role in the binding of nicotine and acetylcholine to nAChR’s, and a positively charged His12 seems to play an important role in the binding of α-CTxMII. Thus, it is hypothesized this peptide may have an increased potency under physiological conditions, while also retaining the binding selectivity seen in the α-CTxMII[E11A] peptide. Interestingly, we found the pKa of the remaining His9 in α-CTxMII[N5R:E11A:H12K] to be 5.8, a decrease of ~0.8 from the α-CTxMII value. This is a much larger pKa shift than was seen in α-CTxMII[E11A], and provides an example of manipulating the protonation state of a histidine residue within small peptides.
3.2 CpHMD
3.2.1 pKa predictions and Hendserson-Hasselbach Behavior
CpHMD simulations were performed on α-CTxMII, α-CTxMII[E11A], and α-CTxMII[N5R:E11A:H12K] over a pH range of 3 to 9 in increments of 0.5. Titration curves showing the percent protonation for residues that were titrated (residues allowed to have dynamic protonation states during the CpHMD simulations) as a function of pH, as well as the H-H fitted curve, are shown in Figure 4. The simulation results indicate that all residues follow nearly ideal H-H behavior, in agreement with the 1H NMR titration experiments, Figure 3. Given that all residues in these systems have a large degree of solvent exposure, it is expected that nearly ideal H-H behavior will be observed with relatively minor shifts in the observed pKa value as compared to their typical bulk water values.
Figure 4.
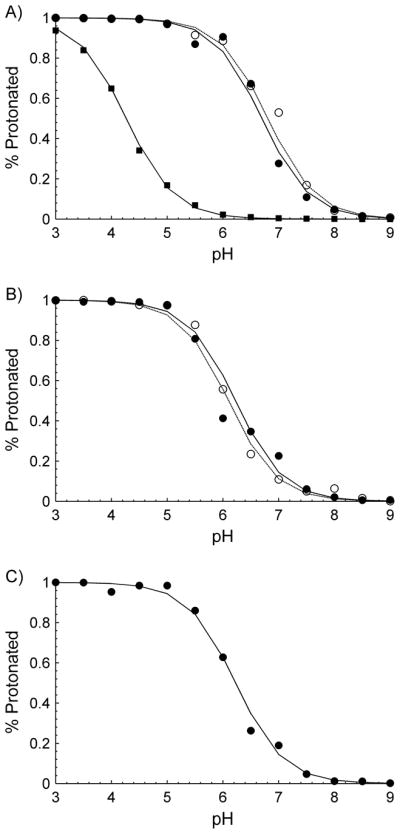
Titration curves produced from CpHMD simulations for A) α-CTxMII, B) α-CTxMII[E11A] and C) α-CTxMII[N5R:E11A:H12K]. In all plots, His12 data are represented as open circles and the fitted H-H curve is shown as a dashed line, while the data for His9 are represented as solid circles and the fitted H-H curve is shown as a solid line, and data for Glu11 are shown as solid squares with the fitted H-H curve shown as a solid double line.
Table 1 provides both the NMR derived pKa values and the predicted pKa values obtained from the CpHMD simulations. As described in the methods section, two separate procedures were utilized to predict the pKa values; the first (pKaHH), involves fitting the H-H equation to percent protonation data at various pH’s, while the second (pKaAVG) involves averaging pKa values from simulations in which the pKa is within 2 units of the pH value.(18) To evaluate the accuracy of either method as compared to the experimentally determined pKa values, the mean absolute deviation (MAD) between the computational and experimental values was computed. It is found that for pKaHH the MAD is 0.4, while the MAD for pKaAVG is 0.3, indicating good agreement between both methods. Given the slightly better agreement between the experimental data and the averaging technique, the pKaAVG value will be used in the remainder of the discussions in this manuscript.
Our reported MAD value of 0.3 for pKaAVG is encouraging given that an average error from experiment of 0.82 was reported in the validation of this CpHMD method, and subsequent studies have reported average errors from experiment on the order of 1 pKa unit or greater.(18, 34, 35) The relatively small MAD values reported here are believed to be due to several factors including the small size of the peptide, high solvent exposure for the protonatable residues, and the long simulation time (70 ns) that was used to sample the various protonation states. The small size of the peptide favorably impacts the accuracy of the CpHMD method by reducing the complexity of residue interactions within the peptide while also enabling the possibility of sufficiently sampling the various side chain orientations and collective peptide motions. The high solvent exposure of the peptide ensures that the predicted pKa values will not depend on complex hydrophobic (i.e. buried environments) and therefore should be easier to predict than those for a larger more complex protein.(35) The use of simulations that are >3 times longer than typically employed for CpHMD ensured sufficient sampling of the various side chain conformations and protonation states.(18)
Beyond looking at the overall average deviation from experiment, the calculated pKa values of specific residues were also in good agreement with experiment. As noted above, the 1D 1H NMR titration experiments show similar pKa values for His9 (6.61) and His12 (6.52) in α-CTxMII. The CpHMD simulations also reveal similar pKa values, with calculated values of 6.5 and 6.7 for His9 and His12, respectively. It is noted that the relative order for the predicted pKa values are flipped in the CpHMD simulations, with His9 having a lower pKa than His12, while the NMR studies indicate His9 has the higher pKa. However, given the standard deviations and the MAD value reported in Table 1, it is not expected that the CpHMD method would be able to resolve between these two closely related pKa values. Thus, within statistical error, the individual pKa values of His9 and His12 from the CpHMD simulation can be considered to be approximately equivalent and in agreement with the experimental findings.
In the α-CTxMII[E11A] peptide, 1H NMR experiments show the pKa of the histidine residues to be similar to the α-CTxMII peptide, with the pKa of His9 and His12 determined to be 6.48 and 6.80, respectively. Taking into account the standard deviation of the reported CpHMD pKa values, the CpHMD calculated pKa values of 6.2 and 6.4 for His9 and His12, respectively, can be considered to be consistent with experiment. The largest pKa shift was seen in the triple mutant α-CTxMII[N5R:E11A:H12K], where 1H NMR experiments show the pKa of His9 shifted from the α-CTxMII value of 6.61 to 5.77, a decrease of ~0.8 pKa units. The CpHMD simulations show the pKa of His9 shifting from 6.5 to 5.9, a result that is statistically significant and in agreement with the direction of the shift reported in the NMR data, although with a slightly smaller magnitude.
It is also of interest to examine the convergence of the calculated pKa values along the simulation trajectory. Figure 5 shows the difference between the calculated pKaAVG and the experimental pKa along the time course of the simulation trajectory. Inspection of Figure 5 reveals that nearly all calculated pKa values quickly converge to near their experimental value, ± 0.3 pKa units. One exception is His9 in α-CTxMII[N5R:E11A:H12K], which takes the entire 70 ns simulation to move from a difference ~0.8 to ~0.2 from the experimental pKa. This indicates that, even in the case of small peptides such as α-CTxMII, simulation times longer than the 20 ns originally proposed for this method, may be required to obtain accurate results.(18) However, utilizing CpHMD coupled with other MD techniques has been shown to reduce simulation convergence times.(28, 29, 36, 37) In particular, pH replica exchange simulations, such as the one recently developed and implemented into Amber by Roitberg et. al., allows for enhanced conformation and protonation state sampling, and has been shown to produce pKa values in good agreement with experiment with the advantage of faster convergence times.(36)
Figure 5.

Time evolution of the calculated pKaAVG value. for α-CTxMII-His9 (circles), α-CTxMII-His12 (asterisks), α-CTxMII[E11A]-His9 (crosses), α-CTxMII[E11A]-His12 (squares), and α-CTxMII[N5R:E11A:H12K]-His9 (diamonds).
The above discussions reveal good correlation between pKa calculations from CpHMD simulations and NMR titration experiments. CpHMD simulations can also be used to investigate other factors relating to residue protonation, such as proton tautomerism. A breakdown of the proton tautomerism for the histidine residues in the various peptides at pH=7 (around physiological pH range) is shown in Table 2. The table shows that in the case of α-CTxMII, His12 prefers the epsilon nitrogen (Nε) singly protonated state, while in α-CTxMII[E11A], His12 shows no preference for the Nε or delta nitrogen (Nδ) singly protonated state. This difference in preference for the Nε or Nδ protonation state appears to be due to the stabilizing interaction of the ε protonated His12 and Glu11 in α-CTxMII, and the increased fluctuation between the Nε and Nδ in the absence of the stabilizing Glu11 in the α-CTxMII[E11A] mutant.(13) However, other features of Glu11 and His12 indicate there is limited interaction between the two residues. This includes the average distance between the two residues remaining relatively unchanged across the various pH trajectories (data not shown), as well as the pKa and other structural features involving His12 remaining similar in α-CTxMII and α-CTxMII[E11A] (discussed further below). Thus, it is difficult to determine the exact cause of the observed tautomer prefence in the simulations. It is found that His9 does not show a clear trend across the different systems, which is most likely due to the larger separation distance between the side chains of His9 and Glu11 as compared to the separation distance between His12 and Glu11.
Table 2.
Breakdown of the proton tautomer distribution for histidine residues in the various peptides at pH=7. HIP indicates a doubly protonated immidazole ring, while HID and HIE indicate singly prototonated immidazole with the excess proton residing on the δ nitrogen and ε nitrogen, respectively.
| System | pH=7 | |||
|---|---|---|---|---|
| HIP | HID | HIE | ||
| MII | His9 | 0.28 | 0.56 | 0.15 |
| His12 | 0.51 | 0.43 | 0.06 | |
|
| ||||
| MII-E11A | His9 | 0.22 | 0.57 | 0.21 |
| His12 | 0.10 | 0.48 | 0.42 | |
|
| ||||
| MII-N5R:E11A:H12K | His9 | 0.19 | 0.65 | 0.16 |
3.2.2 Structural Dynamics
CpHMD simulations can be used to probe the connection between structure, dynamics and the protonation state of ionizable residues. As an initial validation step, structural features of the CpHMD simulations were compared to previously published 1H NMR structural data of α-CTxMII and α-CTxMII[E11A]. NMR data for α-CTxMII was collected at pH=3.3 (PDB accession number 1M2C), while data for α-CTxMII[E11A] was collected at pH=3.(15, 16) Therefore, simulation trajectories for α-CTxMII at pH=3.5 and α-CTxMII[E11A] at pH=3 were used for evaluation.
An initial comparison of the backbone RMSD of the α-CTxMII and α-CTxMII[E11A] simulation trajectories and 1H NMR structures were computed using a plug-in in the Virtual Molecular Dynamics (VMD) code.(38) For the α-CTxMII peptide, the average RMSD between the 14 reported NMR structures was 1.4 ± 0.4 Å, while the RMSD for the CpHMD trajectory was 2.1 ± 0.4 Å, and the RMSD between the 1H NMR and CpHMD simulation trajectory was 2.0 ± 0.4 Å. For the α-CTxMII[E11A] system, the backbone RMSD for the 19 reported NMR structures was 0.8 ± 0.1 Å, while the CpHMD simulation trajectory was 2.2 ± 0.2 Å, and the RMSD between the two methods was 2.0 ± 0.2 Å. These results indicate good agreement in the overall structural characteristics between the tens of structures reported by 1H NMR and the millions of structures predicted by the CpHMD simulations, indicating the CpHMD simulations accurately capture the experimentally observed structural fluctuations in these peptides.
We further compared the use of NMR and CpHMD in their determinations of specific residue orientation distributions. The χ1 andχ 2 angles of the ionizable residue of His12 in α-CTxMII and α-CTxMII[E11A] were computed for the simulation trajectories and the 1H NMR data. When evaluating the orientation of histidine amino acids, α1 is defined as the dihedral involving N-Cα-Cβ-Cγ and indicates the rotation about the Cα-Cβ atoms, while χ2 is the dihedral involving Cα-Cβ-Cγ-Nδ and indicates the rotation about the Cβ-Cγ atoms.(39) Results for α-CTxMII and α-CTxMII[E11A] at the acidic pH values used in the RMSD calculations are shown in Figure 6. The figure indicates a large portion of the χ1 and χ2 angles sampled in the simulations are similar to those seen in the 1H NMR structures, although the simulations sample a broader range of dihedral angles. Figure 6 also reveals that both the 1H NMR titration experiments and the CpHMD simulations predict little change in the dihedral distribution of His12 in α-CTxMII and α-CTxMII[E11A] peptides, which similar to the pKa findings, indicates Glu11 does not have a substantial effect on His12.
Figure 6.

Plots showing His12 χ1 (horizontal axis) and χ2 (vertical axis) in A) α-CTxMII at acidic pH, B) α-CTxMII[E11A] at acidic pH, C) α-CTxMII at neutral pH, and D) α-CTxMII[E11A] at neutral pH.
The above discussion, while indicating similar χ1 and χ2 distribution between CpHMD and 1H NMR, were conducted at pH values well below the physiological pH. The χ1 and χ2 angles for His12 in α-CTxMII and α-CTxMII[E11A] at pH=7 are also shown in Figure 6. The figure indicates the overall distribution pattern is similar between acidic and physiological pH, although more local minima are observed at physiological pH, indicating an increased flexibility of the side chains. Specifically, in α-CTxMII at an acidic pH, His12 resides predominantly at a χ1 value of around −70°, with minor distributions at near −170° and 70°. Near physiological pH, the distribution of χ1 values at ~−170° and 70° are more pronounced. At a physiological pH, the increased flexibility is likely due to His12 transitioning to a neutral protonation state, which results in reduced charge-charge and hydrogen bonding interactions with the surrounding environment.
CpHMD simulations were also utilized to analyze structural features of the newly reported α-CTxMII[N5R:E11A:H12K] peptide. The structural stability as indicated by the RMSD of this peptide at an acidic pH=3 was found to be 2.5 ± 0.7 Å. This result shows that the overall structural fluctuations of α-CTxMII[N5R:E11A:H12:K] are slightly higher than the other two peptides, although the RMSD still indicates the peptide is stable. Analysis of the dihedral angle of the remaining His9 at a pH=3 and pH=7 indicate it follows a similar trend as histidine residues in α-CTxMII and α-CTxMII[E11A]. This includes a major χ1 distribution at around −170°, and sampling a broader χ1 and χ2 range around physiological pH. These results indicate that the three mutations have resulted in a stable peptide with a modified histidine pKa. Beyond showing the ability to manipulate residue pKa while also retaining overall structural features, this peptide may serve as a good experimental probe for the role of His9 protonation in binding and specificity to nAChRs.
3.2.3 Charge Dynamics
In addition to the structural features, CpHMD simulations allow for the inspection of residue charge states over the simulation trajectory, which enables the possibility to evaluate charge dynamics and various charge-charge interactions. To evaluate possible dynamical charge interactions in the various peptides, the charge of ionizable residues in 2 ns increments over the entire simulation trajectory at a pH of 7 were computed, and are displayed in Figure 7. Inspection of the figure indicates that in α-CTxMII, the protonation state of the His9 and His12 residues are highly dynamic, while in the E11A mutant this dynamic nature is less pronounced. This observation may be related to the altered selectivity of α-CTxMII[E11A] at physiological pH, and indicates the presence of Glu11 enables this dynamic charge-charge interaction by offsetting any net accumulated positive charge. Another implication of these results is when the pH is such that the histidine residues can adopt multiple protonation states (pH~ pKa), it appears His9 and His12 prefer to reside in opposite protonation states. Thus, it is expected that mutation of either of these residues to an amino acid with a high pKa would lead to a suppression of the pKa for the remaining His residue. As discussed above, the pKa reduction is observed in the α-CTxMII[N5R:E11A:H12:K] peptide, where the pKa of His9 is ~0.8 lower than the value seen in α-CTxMII, although it is likely the N5R mutation also contributed to the reduced His pKa.
Figure 7.
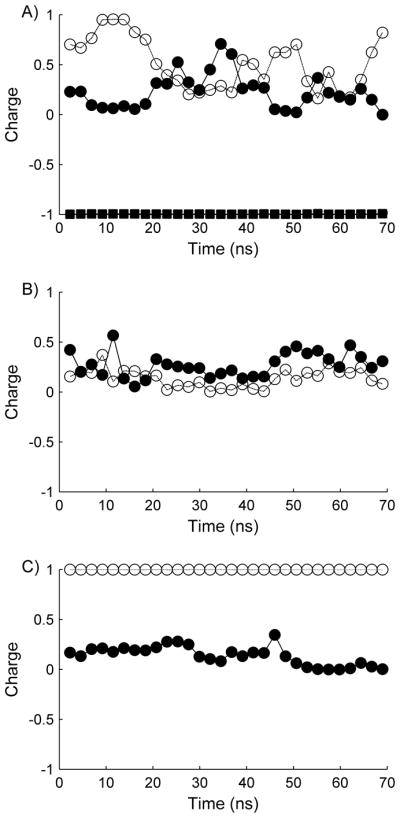
Percent protonation for the various α-CTxMII peptides at pH=7. The graphs depict A) α-CTxMII, B) α-CTxMII[E11A], and C) α-CTxMII[N5R:E11A:H12K] with residue 12 (open circle and dashed line), residue 9 (solid circle and dark line), and residue 11 (solid square and solid line).
IV. CONCLUSION
1D 1H NMR titration experiments and CpHMD simulations have been performed on α-CTxMII, and the two mutant peptides α-CTxMII[E11A] and α-CTxMII[N5R:E11A:H12K]. The 1D 1H NMR results indicate His9 and His12 have pKa values of 6.61 and 6.52, respectively, and follow nearly ideal bulk water H-H behavior. It is found that mutation of Glu11 to Ala11 has little effect on the pKa of His12, indicating it is the removal of Glu11 itself that is responsible for the altered nAChR selectivity seen in this peptide. In α-CTxMII[N5R:E11A:H12K], the pKa of the remaining His9 drops by ~0.8, providing an initial means of manipulating the protonation behavior of histidine residues in small peptides such as α-CTxMII, and a good candidate for future studies examining the role of His9 protonation in nAChR binding. Furthermore, the introduction of positively charged residues on either side of the α-helix is hypothesized to promote favorable binding properties, including a positively charged nitrogen on residue 12.
The CpHMD predictions are in good agreement with the 1D 1H NMR titration results, with an overall MAD of 0.3, as well as showing strong similarity to previously published structural data. In general, the agreement with experiment is attributed to the small size of the peptide, the high solvent exposure of ionizable residues, and the long time simulations used to sufficiently sample various peptide conformations. The CpHMD simulations were also able to accurately capture relative pKa behavior of individual residues, including the finding that an E11A mutation has little effect on the pKa of His12, and the pKa of His9 is reduced in the α-CTxMII[N5:E11A:H12:K] mutant. The CpHMD simulations also show good agreement with previously published structural data of α-CTxMII and α-CTxMII[E11A], and reveal that the newly reported α-CTxMII[N5:E11A:H12:K] is structurally stable and possesses similar characteristics as the α-CTxMII and α-CTxMII[E11A] peptides.
Overall, the study reported here investigated the protonation behavior of α-CTxMII and two analogues, giving further details on the role of histidine protonation in experimentally observed binding trends, as well as providing an initial examination of modifying histidine protonation. The use of CpHMD is shown to accurately and quickly predict pKa values in small peptides, as well as exploring dynamic structural and charge features of these peptides.
Figure 1.
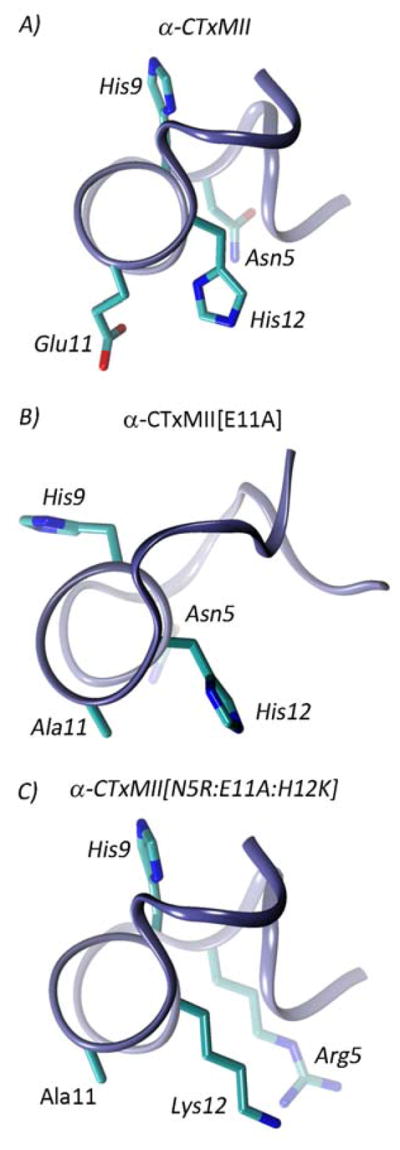
Peptide structures for A) α-CTxMII, B) α-CTxMII[E11A], and C) α-CTxMII[N5R:E11A:H12K].
Acknowledgments
Funding Sources
NSF CRIF-MU/RUI, NIH INBRE, Research Corporation, MSTMRI, CSM.
Research Corporation Cottrell College Scholars Program, Mountain States Tumor Medical Research Institute, Idea Network for Biomedical Research Excellence (Idaho INBRE NIH Grant #P20 RR016454), NSF CRIF-MU/RUI Grant Number 0639251. Colorado Schools of Mines Campus Computing, Communications, and Information Technologies. We also recognize the significant contribution of Dr. Gerry Chingas to the NMR investigation.
ABBREVIATIONS
- α-CTxMII
α-Conotoxin MII
- nAChRs
neuronal nicotinic acetylcholine receptors
- PD
Parkinson’s Disease
- RMSD
root mean square deviation
- MD
molecular dynamics
- CpHMD
constant pH molecular dynamics
- PDB
protein data base
- DSS
4,4-dimethyl-4-silapentane-1-sulfonic acid
- TOCSY
TOtal Corrleation SpectroscopY
- H-H
Henderson-Hasselbalch
- VMD
Virtual Molecular Dynamics
- RMSD
root mean square deviation
- MAD
mean absolute deviation
References
- 1.Olivera BM, Rivier J, Clark C, Ramilo CA, Corpuz GP, Abogadie FC, Mena EE, Woodward SR, Hillyard DR, Cruz LJ. Science. 2000;249:257–263. doi: 10.1126/science.2165278. [DOI] [PubMed] [Google Scholar]
- 2.Terlau H, Olivera BM. Physiol Rev. 2004;84:41–68. doi: 10.1152/physrev.00020.2003. [DOI] [PubMed] [Google Scholar]
- 3.Han TS, Teichert RW, Olivera BM, Bulaj G. Curr Pharm Design. 2008;14:2462–2479. doi: 10.2174/138161208785777469. [DOI] [PubMed] [Google Scholar]
- 4.Lewis RJ. In: Pharmaceutical Biotechnology. Guzman CA, Feuerstein GZ, editors. 2009. pp. 44–48. [Google Scholar]
- 5.Lewis RJ, Dutertre S, Vetter I, Christie M. J Pharmacol Rev. 2012;64:259–298. doi: 10.1124/pr.111.005322. [DOI] [PubMed] [Google Scholar]
- 6.Cartier GE, Yoshikami DJ, Gray WR, Luo SQ, Olivera BM, McIntosh JM. J Biol Chem. 1996;271:7522–7528. doi: 10.1074/jbc.271.13.7522. [DOI] [PubMed] [Google Scholar]
- 7.Cartier GE, Yoshikami DJ, Gray WR, Luo SQ, Olivera BM, McIntosh JM. J Biol Chem. 1996;271:7522–7528. doi: 10.1074/jbc.271.13.7522. [DOI] [PubMed] [Google Scholar]
- 8.Anand R, Conroy WG, Schoepfer R, Whiting P, Lindstrom J. J Biol Chem. 1991;266:11192–11198. [PubMed] [Google Scholar]
- 9.Role LW, Berg DK. Neuron. 1996;16:1077–1085. doi: 10.1016/s0896-6273(00)80134-8. [DOI] [PubMed] [Google Scholar]
- 10.Le Novere N, Grutter T, Changeux JP. Proc Natl Acad Sci USA. 2002;99:3210–3215. doi: 10.1073/pnas.042699699. [DOI] [PMC free article] [PubMed] [Google Scholar]
- 11.Bordia T, Grady SR, McIntosh JM, Quik M. Mol Pharmacol. 2007;72:52–61. doi: 10.1124/mol.107.035998. [DOI] [PubMed] [Google Scholar]
- 12.Quik M, Wonnacott S. Pharmaco l Rev. 2011;63:938–966. doi: 10.1124/pr.110.003269. [DOI] [PMC free article] [PubMed] [Google Scholar]
- 13.McIntosh JM, Azam L, Staheli S, Dowell C, Lindstrom JM, Kuryatov A, Garrett JE, Marks MJ, Whiteaker P. Mol Pharmacol. 2004;65:944–952. doi: 10.1124/mol.65.4.944. [DOI] [PubMed] [Google Scholar]
- 14.Everhart D, Cartier GE, Malhotra A, Gomes AV, McIntosh JM, Luetje CW. Biochemistry. 2004;43:2732–2737. doi: 10.1021/bi036180h. [DOI] [PubMed] [Google Scholar]
- 15.Shon KJ, Koerber SC, Rivier JE, Olivera BM, McIntosh JM. Biochemistry. 1997;36:15693–15700. doi: 10.1021/bi971443r. [DOI] [PubMed] [Google Scholar]
- 16.Turner M, Eidemiller S, Martin B, Narver A, Marshall J, Zemp L, Cornell KA, McIntosh JM, McDougal OM. Bioorg Med Chem. 2009;17:5894–5899. doi: 10.1016/j.bmc.2009.07.005. [DOI] [PMC free article] [PubMed] [Google Scholar]
- 17.Tishmack PA, Bashford D, Harms E, VanEtten RL. Biochemistry. 1997;36:11984–11994. doi: 10.1021/bi9712448. [DOI] [PubMed] [Google Scholar]
- 18.Mongan J, Case DA, McCammon JA. J Comput Chem. 2004;25:2038–2048. doi: 10.1002/jcc.20139. [DOI] [PubMed] [Google Scholar]
- 19.Mongan J, Case DA. Curr Opin Struct Biol. 2005;15:157–163. doi: 10.1016/j.sbi.2005.02.002. [DOI] [PubMed] [Google Scholar]
- 20.Wang JM, Cieplak P, Kollman PA. J Comput Chem. 2000;21:1049–1074. [Google Scholar]
- 21.Onufriev A, Bashford D, Case DA. J Phys Chem B. 2000;104:3712–3720. [Google Scholar]
- 22.Onufriev A, Case DA, Bashford D. J Comput Chem. 2002;23:1297–1304. doi: 10.1002/jcc.10126. [DOI] [PubMed] [Google Scholar]
- 23.Onufriev A, Bashford D, Case DA. Proteins. 2004;55:383–394. doi: 10.1002/prot.20033. [DOI] [PubMed] [Google Scholar]
- 24.Guex N, Peitsch MC. Electrophoresis. 1997;18:2714–2723. doi: 10.1002/elps.1150181505. [DOI] [PubMed] [Google Scholar]
- 25.Case DA, Darden TA, Cheatham ITE, Simmerling CL, Wang J, Duke RE, Luo R, Walker RC, Zhang W, et al. AMBER. Vol. 11. University of California; San Francisco: 2010. [Google Scholar]
- 26.Wang J, Cieplak P, Kollman PA. J Comput Chem. 2000;21:1049–1074. [Google Scholar]
- 27.Silversten TP. J Chem Educ. 2012;89:1474–1475. [Google Scholar]
- 28.Wallace JA, Shen JK. J Chem Theory Comput. 2011;7:2617–2629. doi: 10.1021/ct200146j. [DOI] [PMC free article] [PubMed] [Google Scholar]
- 29.Meng YL, Roitberg AE. J Chem Theory and Comput. 2010;6:1401–1412. doi: 10.1021/ct900676b. [DOI] [PMC free article] [PubMed] [Google Scholar]
- 30.Whittaker MM, Whittaker JW. Biochemistry. 2008;47:11625–11636. doi: 10.1021/bi8015636. [DOI] [PMC free article] [PubMed] [Google Scholar]
- 31.Dougherty DA, Stauffer DA. Science. 1990;250:1558–1560. doi: 10.1126/science.2274786. [DOI] [PubMed] [Google Scholar]
- 32.Xiu XA, Puskar NL, Shanata JAP, Lester HA, Dougherty DA. Nature. 2009;458:534–537. doi: 10.1038/nature07768. [DOI] [PMC free article] [PubMed] [Google Scholar]
- 33.Zhong WG, Gallivan JP, Zhang YO, Li LT, Lester HA, Dougherty DA. Proc Natl Acad Sci USA. 1998;95:12088–12093. doi: 10.1073/pnas.95.21.12088. [DOI] [PMC free article] [PubMed] [Google Scholar]
- 34.Williams SL, Blachly PG, McCammon JA. Proteins. 2011;79:3381–3388. doi: 10.1002/prot.23136. [DOI] [PMC free article] [PubMed] [Google Scholar]
- 35.Chen YZ, Chen X, Deng YF. Comput Phys Commun. 2007;177:210–213. [Google Scholar]
- 36.Dashti DS, Meng YL, Roitberg AE. J Phys Chem B. 2012;116:8805–8811. doi: 10.1021/jp303385x. [DOI] [PMC free article] [PubMed] [Google Scholar]
- 37.Williams SL, de Oliveira CAF, McCammon JA. J Chem Theory Comput. 2010;6:560–568. doi: 10.1021/ct9005294. [DOI] [PMC free article] [PubMed] [Google Scholar]
- 38.Humphrey W, Dalke A, Schulten K. J Mol Graph. 1996;14:33–38. doi: 10.1016/0263-7855(96)00018-5. [DOI] [PubMed] [Google Scholar]
- 39.Maupin CM, Voth GA. Biochemistry. 2007;46:2938–2947. doi: 10.1021/bi062170f. [DOI] [PMC free article] [PubMed] [Google Scholar]