

Abstract
Computational tumour models have emerged as powerful tools for the optimization of cancer therapies; ideally, these models should incorporate patient-specific imaging data indicative of therapeutic response. The purpose of this study was to develop a tumour modelling framework in order to simulate the therapeutic effects of anti-angiogenic agents based upon clinical molecular imaging data. The model was applied to positron emission tomography (PET) data of cellular proliferation and hypoxia from a phase I clinical trial of bevacizumab, an antibody that neutralizes the vascular endothelial growth factor (VEGF). When using pre-therapy PET data in combination with literature-based dose response parameters, simulated follow-up hypoxia data yielded good qualitative agreement with imaged hypoxia levels. Improving the quantitative agreement with follow-up hypoxia and proliferation PET data required tuning of the maximum vascular growth fraction (VGFmax) and the tumour cell cycle time to patient-specific values. VGFmax was found to be the most sensitive model parameter (CV=22%). Assuming availability of patient-specific, intratumoural VEGF levels, we show how bevacizumab dose levels can potentially be ‘tailored’ to improve levels of tumour hypoxia while maintaining proliferative response, both of which are critically important in the context of combination therapy. Our results suggest that, upon further validation, the application of image-driven computational models may afford opportunities to optimize dosing regimens and combination therapies in a patient-specific manner.
Keywords: computational modelling, in silico oncology, patient-specific modelling, tumour growth, tumour modelling, angiogenesis, anti-angiogenic therapy, therapy response, bevacizumab
1. Introduction
Angiogenesis has long been recognized as a requirement for invasive tumour growth and metastasis and is, in its sustained form, one of the hallmarks of cancer (Hanahan and Weinberg 2011). In the 1970s, Folkman and co-authors (1971) hypothesized that cancer cells can ‘switch’ from a quiescent to a growth state by secreting a tumour angiogenesis factor (TAF). They further hypothesized that this process can be reversed or temporarily interrupted through therapies targeting this TAF or TAF-dependent pathways (Folkman 1974). Today, one of most potent TAFs known is the vascular endothelial growth factor (VEGF), a key mediator in the angiogenic process which binds to vascular endothelial cells via specific tyrosine kinase receptors (VEGFRs) (Hicklin and Ellis 2005). Once bound to VEGFRs, VEGF promotes proliferation and migration of endothelial cells and inhibits apoptosis (Dvorak 2002). VEGF is over-expressed in most cancers (Ferrara and Davis-Smyth 1997) and has been associated with disease progression and decreased survival (Jain et al 2006). Consequently, VEGF has emerged as a promising therapeutic target and several molecularly targeted treatments inhibiting VEGF or VEGFRs have proven beneficial in clinical trials (Duda et al 2007). In the US, the first VEGF-specific anti-angiogenic agent that received FDA-approval was bevacizumab (Avastin), a recombinant humanized monoclonal antibody to VEGF (Ferrara et al 2004). In addition, the receptor tyrosine kinase inhibitors sorafenib (Nexavar) and sunitinib (Sutent) are currently approved for clinical use (Escudier et al 2007a, Motzer et al 2007). However, although these drugs have demonstrated survival benefits in several malignancies, recent clinical trials (Kindler et al 2010, Allegra et al 2011) showed no significant improvements in progression-free survival when anti-angiogenic regimens were administered as monotherapy or in combination with chemotherapy. Even in cases in which therapeutic gains were observed, the optimal treatment strategy regarding dosing and sequencing of combination therapies remains subject to scientific debate, primarily due to conflicting experimental data (Rofstad et al 2003, Zips et al 2003). These findings underscore the critical need for research tools yielding an improved understanding of the mechanisms of action of anti-angiogenic agents, which would provide means to optimize anti-angiogenic therapies. In addition, a better mechanistic understanding could unlock the full potential of anti-angiogenic agents as part of combination therapies and lead to the development of more rational, evidence-driven combination therapies (Grothey and Galanis 2009). This would stand in stark contrast to the empirical trial designs used to date (Zhu et al 2007).
Anti-angiogenic therapies have been hypothesized to result in destruction or remodelling of blood vessels, reduction of circulating endothelial cells, and normalization of the vascular environment (Willett et al 2004, Koukourakis et al 2007). In clinical trials, anti-angiogenic therapies were found to reduce the tumour microvessel density (MVD) in tumours, which was accompanied by a reduction in both tumour blood perfusion and blood volume (Willett et al 2004, Escudier et al 2007, Motzer et al 2007). The temporal development of these effects, while currently not well characterized, is critically important, especially in the context of combination therapy: Here, continued therapy may destroy tumour vasculature to the point of necrosis and reduced perfusion of oxygen and administered drugs (Jain 2005), which might adversely affect other concurrent or adjuvant therapies.
In order to elucidate the temporal dynamics during anti-angiogenic therapy, therapeutic response can be evaluated in several ways. Preclinical ex vivo methods, such as immunohistochemical staining following tumour excision, are inadequate for longitudinal studies due to their inherently destructive nature. Immunohistochemical staining of biopsies taken in human patients offer excellent spatial resolution, but are limited by sample bias stemming from tumour heterogeneity. In clinical trials, which are primarily concerned with end-of-treatment outcomes rather than the temporal dynamics of response, response is typically characterized by a combination of anatomical imaging and systemic biomarkers (Andre et al 2011). However, since these circulating biomarkers are generally not specific to tumour tissue, background levels produced by normal tissues can render them insensitive to changes in tumour biology (Diamandis 2010).
An alternative, rather novel approach is computational (’in silico’) tumour modelling (for a review, see Deisboeck et al (2009) and references therein), which has emerged as a powerful and cost-effective tool to investigate the interplay of biological factors influencing tumour growth and therapeutic response. Computational models are able to formally and systemically describe the main biological processes that relate tumour phenotypes to measured biological properties. While purely theoretical approaches to model anti-angiogenic therapy have used reaction-diffusion equations to study the interplay between tumour vasculature and local tumour cell densities during anti-angiogenic and combination therapies (Kohandel et al 2007, Billy et al 2009, Gevertz 2011), more applicable models incorporating experimental data have recently been established to investigate the complex mechanisms involved in angiogenesis and anti-angiogenic therapy. Gorelik et al (2008) combined an analytical model describing the pharmacokinetics and -dynamics of anti-angiogenic drugs with a murine xenograft model, comparing simulated tumour growth curves to those measured in vivo. Ribba and colleagues (2010) implemented a semi-mechanistic model to simulate tumour growth in mice. Their model, which is based on a mixed-effects formalism and differential equations governing the growth and response of tumour cells, illustrates the potential use of computational tumour modelling in investigating effects of anti-angiogenic therapies on tumour growth when combined with empirical data.
However, current approaches modelling anti-angiogenic therapy are limited in their applicability to patient data due to their reliance on arbitrary or non-measurable model parameters and the absence of non-systemic biomarkers adequately reflecting the action of anti-angiogenic drugs. In order to simulate the highly variable inter- and intra-patient responses observed clinically, one would ideally incorporate patient data that are specific to the tumour tissue and that can be assessed at multiple time points without disrupting the tumour. Molecular imaging is, in contrast to circulating biomarkers, suited for the non-invasive, serial, spatially-resolved, and quantitative assessment of imaging biomarkers specific to tumour tissue (Shah et al 2009). Moreover, molecular imaging has been shown to be capable of imaging proliferative and metabolic response to targeted therapy (Desar et al 2009), which generally precede changes in tumour burden detected by anatomical imaging (Stroobants et al 2003).
The purpose of this study was to develop a computational tumour modelling framework in order to simulate the effects of anti-angiogenic therapy based on multiparametric, clinical molecular imaging data. This was implemented by adding a vascular component to a previous molecular imaging-driven tumour simulation model (Titz and Jeraj 2008) to account for the pharmacokinetics and pharmacodynamics of anti-angiogenic therapies. Positron emission tomography (PET) data of tumour proliferation and hypoxia acquired before and after anti-angiogenic therapy were used to incorporate patient imaging data into the model. Underlying model parameters were either taken from literature or, in the case of patient-specific parameters, determined for each patient by reproducing follow-up PET images based upon the pre-therapy data sets. After illustrating the ability to reproduce proliferative and hypoxic response to anti-angiogenic therapy, the sensitivity of the model to its main parameters was investigated. Finally, a potential application of the model and how it could be used to reject certain treatment options was illustrated by investigating different treatment scenarios.
2. Structure of the tumour modelling framework
The model developed in this work is based on a previous tumour growth and radiation therapy response model (Titz and Jeraj 2008), which has been expanded to include a pharmacokinetic/pharmacodynamic (PK/PD) model of anti-angiogenic therapy. The modelling framework can be applied to different drugs targeting the VEGF signalling pathway or receptor tyrosine kinases (such as sunitinib) in general, which may cause both anti-angiogenic and anti-proliferative effects. As an example, the model was applied to imaging data from a phase I clinical trial in which head and neck squamous cell carcinoma (HNSCC) patients were treated with the VEGF antibody bevacizumab.
Model input data consist of both cell-line-specific as well as patient-specific parameters derived from molecular imaging, which allows the incorporation of biological properties of individual tumours. Three different PET imaging tracers were used to acquire model inputs: [18F]Fluoro-2-deoxy-2-D-glucose ([18F]FDG), a marker of metabolic activity; 3'-Deoxy-3'-[18F]fluorothymidine ([18F]FLT), a surrogate marker of cellular proliferation; and Copper(II) diacetyl-di(N4-methylthiosemicarbazone) ([61Cu]Cu-ATSM), a marker of cellular hypoxia.
2.1. Tumour model simulation layers
The core of the tumour modelling framework consists of three different layers (figure 1) corresponding to different spatial scales: 1) a tissue simulation layer to account for the macroscopic imaging scale, 2) a cellular simulation layer to account for the underlying microscopic scale, and 3) a molecular layer, which accounts for levels of relevant molecular substances.
Figure 1. Illustration of the anti-angiogenic therapy tumour modelling framework.

An anti-angiogenic therapy module (red), consisting of a pharmacokinetic (PK) model and an implementation of pharmacodynamic (PD) effects, was incorporated into a pre-existing tumour modelling core. The model was applied using bevacizumab, whose PD can be modelled as a change in microvessel density (MVD), ultimately resulting in a change in oxygenation (pO2) within each tumour voxel. This change in pO2 in turn affects simulated biological processes at the cellular simulation layer. Dashed grey lines represent the implementation of additional pharmacodynamics required for the modeling of anti-angiogenic drugs other than bevacizumab (e.g., receptor tyrosine kinase inhibitors).
The tissue layer is the interface for the integration of clinical imaging data. At this level, biological input parameters such as tumour cell density, proliferative rate, and the average oxygenation level of each voxel are derived from PET/CT imaging data (section 3.2). The cellular layer enables accounting for sub-voxel-scale processes such as tumour cell proliferation as well as necrosis and lysis of dead cells following therapy. In addition, general model parameters (e.g. individual cell cycle times and the oxygen necrosis threshold) are assigned at this level (see section 2.4). The molecular layer accounts for levels of oxygen (pO2), circulating TAFs, and, if anti-angiogenic therapy is being administered, their antagonists (e.g. endogenous, soluble VEGFRs) or pharmacophores (such as bevacizumab), respectively.
2.2. Incorporation of anti-angiogenic therapy
The therapy module affects tumour and vascular growth and response processes when therapy is being administered. To link changes in the vascular domain to the tumour domain, a PK/PD model was implemented and incorporated into the tumour model. The model framework was then used to simulate response to anti-angiogenic drugs, using bevacizumab as an example. Bevacizumab is a recombinant humanized monoclonal antibody that recognizes and neutralizes VEGF (Ferrara et al 2004); it has been shown to have no direct effects on tumour cells (Fujita et al 2007), but rather on endothelial cells only (Kim et al 1993). Effects of bevacizumab include decreased MVD and vascular volume (Willett et al 2004). These changes in tumour vasculature were shown to result in decreased tumour oxygenation (Hattingen et al 2011), which in turn can induce tumour cell apoptosis due to tumour cell oxygen-dependence (Wedam et al 2006).
2.2.1. Pharmacokinetic model
The pharmacokinetics of bevacizumab have been studied extensively (Gordon et al 2001, Lu et al 2008) and were shown to be dose-proportional and best described by an open 2-compartment pharmacokinetic model (Lu et al 2008). In this work, a 2-compartment model was implemented in Matlab Simulink (The MathWorks, Natick, MA) to yield the bevacizumab plasma concentration-time-profile cbev(t). Model parameters were adapted to population-based values stemming from clinical trial data published by Lu et al (2008) (table 1). Simulated peak plasma concentrations for different dose levels yielded good agreement with values published by Gordon et al (2001), as shown in figure 2.
Table 1.
Summary of model input parameters.
| Model parameter | Symbol | Value | Reference/comment |
|---|---|---|---|
| Cell-line-specific input parameters: | |||
| necrosis threshold | pO2 necr | 1 mmHg | (De Los Santos and Thomas 2007) |
| Average cell cycle time | Tcc | 69 hrs | (Zatterstrom et al 1991) |
| fraction of cells in G1 phase | FG1 | 60 % | (Johnson et al 1997, Huang et al 2002) |
| fraction of cells in S phase | FS | 25 % | (Johnson et al 1997, Huang et al 2002) |
| fraction of cells in G2/M phase | FG2/M | 15 % | (Johnson et al 1997, Huang et al 2002) |
| Time for cell lysis and removal | Tlys | 5 days | (Titz and Jeraj 2008) |
| Patient-specific input parameters: | |||
| Total voxel occupancy (number of cells) | N | 106 | (Titz and Jeraj 2008) |
| proliferating tumour cells per voxel | Npc | 0 to 106 | derived from [18F]FLT data (Titz and Jeraj 2008) |
| oxygen partial pressure of voxel | pO2 | 0 to 40 mmHg | from [61Cu]Cu-ATSM data (Titz and Jeraj 2008) |
| MVD simulation input parameters: | |||
| capillary diameter | dcap | 3 to 20 µm | (Tsuji et al 2002) |
| polar capillary angle | dcap | 0 to 180° | (Krasnoperov and Gerasimov 2009) |
| planar capillary angle | φcap | 39.6 ± 17.1° | (Schlageter et al 1999) |
| Inter-capillary pO2 | pO2 cap | 40 mmHg | (Secomb et al 2004) |
| oxygen diffusion range | R | 140 µm | (Beasley et al 2001) |
| increase in VEGF expression | VEGF(pO2) | 1- to 6-fold | (Schoch et al 2002), see equation 1 |
| max. vascular growth fraction | VGFmax | 0.60 %/hr | based on data from (Zhou et al 2008) |
| max. vascular regression fraction | VRFmax | 1.16 %/hr | based on data from (Ou et al 2009) |
| fraction of bound VEGF | ϕbVEGF | 0 to 1 | (Bock et al 2007), see figure 2 |
| PK model input parameters: | |||
| central compartment distribution volume | VD | 2.39 L | (Lu et al 2008) |
| average clearance | CL | 0.262 L/day | (Lu et al 2008) |
| terminal half-life | t1/2 | 19.9 days | (Lu et al 2008) |
| Elimination rate constant | k10 | 0.078 day−1 | (Lu et al 2008) |
| central compartment efflux rate constant | k12 | 0.223 day−1 | (Lu et al 2008) |
| central compartment influx rate constant | k21 | 0.215 day−1 | (Lu et al 2008) |
Note that some of the literature-based parameter values represent averages originating from pre-clinical experiments and thus may have limited applicability to human patients. For Tcc and VGFmax, this was accounted for by initializing the parameters based on the literature values, after which they were further tuned based on the patient-specific imaging input, as described in section 3.3.
Figure 2. Comparison between simulated bevacizumab peak plasma concentrations at different dose levels and corresponding values from literature.

Blue squares represent single dose peak plasma concentrations published by Gordon et al (2001), green diamonds symbolize data by Lu et al (2008), and red circles correspond to dose levels simulated in this work. The red-shaded area represents the clinical dosage range (5 mg/kg up to 15 mg/kg) for FDA-approved regimens as recommended by the drug manufacturer.
2.2.2. Modelling angiogenesis and the pharmacodynamic response to bevacizumab
Angiogenic processes are promoted by a predominance of pro-angiogenic factors, primarily by VEGF (Jain 2005). The most potent stimulator of VEGF upregulation is hypoxia, which causes increased transcription of the VEGF gene via the action of hypoxia-inducible factor 1 alpha (HIF-1α) (Forsythe et al 1996). HIF-1α is an oxygen-sensing transcription factor protein expressed in hypoxic cells in order to maintain oxygen homeostasis (Semenza 2001). VEGF secretion levels of tumour cells have been shown to be elevated 5- to 6-fold in response to hypoxia (May et al 2005, Azoitei et al 2010). In our model, the levels of VEGF were modelled to continuously increase at oxygen tension (pO2) levels below 25 mmHg (Sinor et al 1998) up to a 6-fold of the VEGF base level (VEGF0) (Schoch et al 2002). This was implemented using a sigmoid function (equation 1, figure 3) as proposed by Mac Gabhann et al (2007).
| (1) |
Figure 3. Simulated VEGF upregulation under hypoxia.

Under normoxia, tumour cells secrete VEGF at a basal level (dashed) required for EC homeostasis (Carmeliet 2003). At pO2 levels below 25 mmHg, VEGF expression continuously increases up to a 6-fold (red) of the base level (May et al 2005). To represent tumour cells upregulating VEGF to a lower degree, additional 4-fold (orange) and 2-fold (green) increases in VEGF were simulated for a sensitivity study. The vascular growth fraction VGF (not shown) is assumed to increase linearly with VEGF (Toi et al 1995).
This empirical relationship is consistent with experimental data on oxygen tension vs. HIF-1α expression levels (Jiang et al 1996) and data on HIF-1α expression vs. VEGF secretion levels (Blancher et al 2000).
Given the linear relationship between VEGF expression and endothelial cell (EC) proliferation (Tanaka et al 2001, Loggini et al 2003), elevated VEGF levels increase the vascular growth fraction (VGF) (Helmlinger et al 2000), thus mediating hypoxia-driven angiogenesis (Shweiki et al 1992). Based on these relationships, the VGF and the resulting microvessel density (MVD) can be assumed to be linearly proportional to levels of VEGF expression (Toi et al 1995). Accordingly, the MVD at a given time point t+Δt can be expressed as:
| (2) |
where VGF is the pO2-dependent vascular growth fraction at time point t and Δt the simulation time step (here: 1hr). If anti-angiogenic therapy is being administered, the drug-specific dose-response relationships (figure 4) need to be accounted for. To modify the VEGF-dependent MVD growth term for VEGF neutralization due to bevacizumab, equation (2) can be expanded so that
| (3) |
Figure 4. Dose-response relationship between bevacizumab concentration, bound fraction of VEGF, and the resulting inhibition in EC proliferation.

Grey diamonds show the bound fraction of VEGF (ϕbVEGF) due to bevacizumab (Bock et al 2007) while red circles signify the inhibition in EC proliferation (Presta et al 1997), indicating a linear relationship between VEGF levels and EC proliferation. Values for the half maximal effective concentration (EC50, green triangle) of bevacizumab are consistent in literature (Presta et al 1997, Wang et al 2004, Gerber and Ferrara 2005). In this work, the dose response fit (black) to the Bock et al (2007) data was used to simulate therapeutic response to bevacizumab.
Here, cbev(t) represents the plasma concentration of bevacizumab at time point t and ϕbVEGF represents the fraction of bevacizumab-bound VEGF. In order to model the pharmacodynamics of bevacizumab, a sigmoid dose-response relationship between bevacizumab and the inhibition of VEGF-mediated EC proliferation (Wang et al 2004) was fitted to in vitro data (Presta et al 1997, Bock et al 2007) using an Emax model from the Origin (OriginLab, Northampton, MA) pharmacology fitting library (figure 4).
To further relate the bevacizumab-induced inhibition of EC proliferation to a change in MVD, linear relationships between the amount of VEGF, EC proliferation, and the MVD were implemented (Toi et al 1995, Nakasaki et al 2002, Loggini et al 2003, Du et al 2008).
Neglecting vascular growth and assuming that a prolonged inhibition of EC proliferation causes vascular regression (Liu et al 2000), the decrease in microvasculature due to therapy can be calculated as
| (4) |
Here, VRFmax represents the maximum vascular regression fraction (table 1) which is linked to the bevacizumab plasma concentration-dependent inhibitory effect via ϕbVEGF. Accordingly, if both vascular growth and response to therapy occur simultaneously (at dose levels below the maximum effective dose), the net change in MVD can be calculated by:
| (5) |
2.3. Modelling intra-voxel heterogeneity in oxygenation
PET imaging can be used to extract and quantify biological properties of the tumour microenvironment. However, one has to consider the spatial resolution (3.5 to 5.0 mm for a clinical PET scanner) and the resulting limitations in resolving the underlying tumour biology on the microscopic scale (Christian et al 2009). Accordingly, biological heterogeneity within imaged voxels is of special interest when estimating parameters since the underlying statistical distribution of the parameter of interest is unknown. For example, since oxic and anoxic cells can be separated by less then 150 µm (Tannock 1972), an imaged voxel can contain cells of a wide range of oxygenation levels, regardless of the average PET voxel value. To account for this heterogeneity, a previous method of sampling cellular pO2 values within each voxel from normal distributions (Titz and Jeraj 2008) was modified to a sampling of pO2 values from non-normal distributions. Analogous to the approach taken by Petit et al (2009), these distributions were estimated by calculating the oxygenation levels around the cross sections of capillaries positioned on a virtual 2D slice of tissue. However, in order to obtain more realistic oxygen distributions and vascular representations (Kelly and Brady 2006), both non-perpendicular capillary sectioning angles (i.e., non-parallel capillaries) and vessels of varying diameter were modelled in this work. This was implemented by sampling capillary diameters characteristic for HNSCC tumours (Tsuji et al 2002) and by sampling different capillary sectioning angles from a published probability density function (Krasnoperov and Gerasimov 2009). The simulation procedure to generate the pO2 distributions from which cellular values are sampled is illustrated in figure 5; model parameters are summarized in table 1.
Figure 5. Illustration of the intra-voxel heterogeneity simulation process.
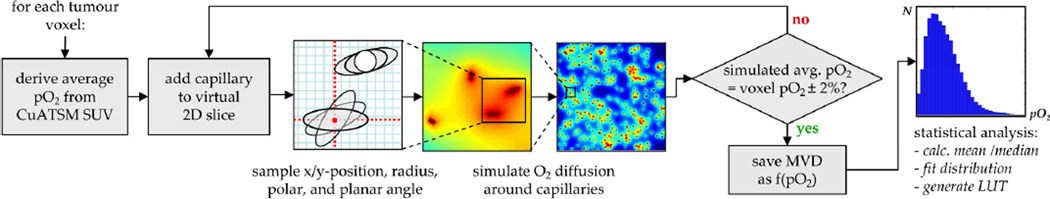
After deriving the average voxel pO2 value, capillaries are placed onto a virtual 2D tissue slice consisting of 1000 × 1000 cells in a self-avoiding, random fashion. The diameter as well as the polar and planar angles θcap and φcap of the capillaries relative to the 2D plane are sampled from realistic PDFs (Tsuji et al 2002, Krasnoperov and Gerasimov 2009). Subsequently, the oxygen diffusion around the capillary pattern is calculated in order to generate a voxel-specific pO2 histogram. This procedure is being repeated until the average pO2 of the simulated slice matches the imaging-based pO2 to within ± 2%. Results are stored in a look-up-table (LUT) based on which the cellular pO2 values are being sampled as a function of the MVD during the simulations of anti-angiogenic therapy.
2.4. Summary of model input parameters
The majority of model parameters used in here correspond to those used in a previous work (Titz and Jeraj 2008); only model parameters required for the bevacizumab PK/PD modelling were added. A summary of all model input parameters is given in table 1, below.
3. Materials and methods
3.1 Clinical protocol and image processing
Eight HNSCC patients underwent baseline [18F]FDG, [18F]FLT, and [61Cu]Cu-ATSM PET/CT imaging on a GE Discovery LS scanner (GE, Waukesha, WI). After baseline imaging, a single induction dose of bevacizumab (intravenous infusion over 90±15 minutes at a dose of 15 mg/kg) was administered. Approximately three weeks after treatment, follow-up [18F]FLT and [61Cu]Cu-ATSM PET/CT scans were performed to assess changes in proliferation and hypoxia. Further details of the clinical trial have been described elsewhere (Harari et al 2011). Attenuation-corrected PET images were reconstructed using a vendor-provided ordered-subset expectation maximization algorithm with a reconstruction voxel size of 0.391 cm × 0.391 cm × 0.425 cm. Regions of interest were delineated by a radiation oncologist. PET images were then imported into Amira (Visage Imaging, Inc., San Diego, CA), converted to standardized uptake value (SUV) images, and co-registered. Subsequently, PET images were imported into MATLAB (The MathWorks, Natick, MA) to run simulations.
3.2. Imaging-based input parameters
CT data were used to define the gross tumour volume. In areas of low CT contrast, the segmentation process was aided by [18F]FDG PET data to identify cancerous tissue. [18F]FLT and [61Cu]Cu-ATSM data were used analogously to the previous radiation response model (Titz and Jeraj 2008) to quantify voxel-based proliferation and oxygenation levels, respectively. The incorporation of these imaging-based components (summarized in table 1) into the model is illustrated in figure 1.
3.3. Literature-based model parameter values
3.3.1. Parameter initialization
Model parameters governing the growth, quiescence, necrosis, and lysis of tumour cells were identical to those described in a previous publication (Titz and Jeraj 2008). Additional model parameters regulating angiogenesis and the response to anti-angiogenic therapy that could not be derived from imaging data directly were either derived by fitting published pharmacodynamic data (such as ϕbVEGF, VGFmax, and VRFmax) or adapted from literature (such as Tcc). Simulated PET follow-up data based on the literature-based parameter values were then compared qualitatively to the imaged follow-up data in order to evaluate whether therapeutic response was under- or overestimated.
3.3.2. Model parameter tuning to patient-specific values
Due to the limited nonspecificity of some of the literature-based model parameters, values for the cell cycle time (Tcc) and the maximum vascular growth fraction (VGFmax) were optimized in a second simulation step. This was done by finding the set of parameters that was required to reproduce the follow-up PET images when using the pre-therapy data as input. VRFmax was assumed to be constant since it is not VEGF-dependent (by definition, VRFmax occurs at 100% VEGF inhibition), while VGFmax strongly depends on the VEGF expression level. Accordingly, and since VEGF expression levels are not assessed by imaging, the inter-patient variability of this parameter is of special interest
Patient-specific Tcc and VRFmax parameter values were determined as follows: Simulations were run using the pre-therapy [18F]FLT and [61Cu]Cu-ATSM data as input in order to reproduce the corresponding post-treatment [18F]FLT and [61Cu]Cu-ATSM scans. Simulation results were analyzed on a region-of-interest (ROI) basis by constructing relative difference histograms (RDH) between imaged and simulated response, representing the error of the simulations: First, SUV histograms of both imaged and simulated post-treatment scans were generated. RDHs were then constructed by normalizing the difference between the two histograms according to the number of tumour voxels per SUV bin (0.1 bin width). Simulations were terminated once the error in each SUV bin was at or below 5%, at which point the overall error was quantified via the residual sum of squares (RSS) over all bins. This ROI-based histogram method was chosen to allow for the assessment of the entire tumour volume (rather than just a subset) as well as for the identification of SUV regions that were either well or poorly simulated.
3.4. Sensitivity study
To analyse the sensitivity of the model to patient-specific input parameters, changes in proliferation and hypoxia after a single dose of bevacizumab (15 mg/kg) were simulated for a range of different hypoxia, proliferation, and VEGF expression levels and monitored over 8 weeks. After each simulation time step, the mean SUV of the tumor ROI (SUVmean) was calculated for both [61Cu]Cu-ATSM and [18F]FLT. The VEGF expression level is of special interest since the VEGF-dependent vascular growth fraction VGFmax was found to exhibit the highest degrees of interpatient variability and was not directly assessed via in vivo imaging in this study.
3.5. Example application: simulation of different treatment scenarios
In order to explore how the model could be applied when investigating clinically relevant scenarios (e.g., choosing or modifying a treatment regimen), six cycles of biweekly (q2w schedule) bevacizumab were simulated for low (2-fold), intermediate (4-fold), and high (6-fold) hypoxia-induced VEGF expression levels using an example patient data set. The simulated dose level was 10 mg/kg, which is the manufacturer recommended dose for a q2w regimen, and mean [18F]FLT and [61Cu]Cu-ATSM SUVs (SUVmean) were calculated for each patient and recorded over time. For the low VEGF expression level scenario, an additional dose level (q2w*) featuring a 30% dose reduction was investigated. The latter was motivated by the hypothesis that, if a tumour increases VEGF secretion under hypoxia to a lesser degree, continued administration of an anti-VEGF agent might lead to increasing levels of hypoxia, which would be an undesirable scenario from a therapeutic point of view.
4. Results
4.1 Comparison between average and patient-specific model parameter values
The comparison between simulations based on average and patient-individual parameter values is shown in figure 6.
Figure 6. Comparison of imaged PET data, simulations based on parameter values from literature, and ‘best fit’ simulations using patient-specific parameter values for VGFmax and VRFmax.

Symbols represent imaged hypoxia (red) and proliferation (green) PET data (SUVmean ± SD), while solid lines represent simulated PET data using literature-based (grey) and patient-specific (red, green) parameter values, respectively. Shaded areas show the standard deviation.
Good qualitative agreement can be seen between the simulated levels of hypoxia (left column) based on the average parameter (grey) values and the imaged SUVmean values (symbols). All simulated values fall within the standard deviation of the actual patient data. In general, cases of higher levels of hypoxia (patients 2, 3, 4, and 7) show better agreement. 1–2 days after the administration of bevacizumab, a transient increase in hypoxia can be observed, which peaks at around 7–10 days post-injection. In contrast, the literature-based cell cycle time (grey) leads to an ‘overresponse’ in proliferation, showing a significant reduction in both SUVmean and the spread of the SUVs (shown by the standard deviation). Differences between simulated hypoxia and proliferation levels and actual PET data were further improved by adjusting the literature-based values for Tcc and VGFmax (table 2) until the RDH error was minimized, yielding a good quantitative agreement in all patients (green curves and areas). Histogram errors and differences between imaged and simulated follow-up data of an example patient are illustrated in figure 7.
Table 2.
Patient-individual simulation parameters.
| Patient # | Tcc [hrs] | VGFmax [%/hr] |
|---|---|---|
| 1 | 99.00 | 0.53 |
| 2 | 103.00 | 0.55 |
| 3 | 106.00 | 0.60 |
| 4 | 64.00 | 0.81 |
| 5 | 71.00 | 0.54 |
| 6 | 113.00 | 0.43 |
| 7 | 88.00 | 0.78 |
| 8 | 97.00 | 0.55 |
| Mean ± SD | 92.63 ± 17.20 | 0.60 ± 0.13 |
| CV | 0.18 | 0.22 |
| Literature value | 69.00 | 0.60 |
Compared to the cell cycle time, the VEGF-regulated vascular growth fraction governing angiogenesis showed the greatest coefficient of variation (CV) among patients (22%).
Figure 7. Comparison of baseline, follow-up, and simulated follow-up PET data of an example patient.

Top: simulated and imaged temporal development of the mean (±SD) tracer SUVs following the single induction dose of bevacizumab (left) and corresponding histograms (middle, right). Relative difference histograms (panels h and d) show the relative error of the simulated PET data. Bottom: Sagittal slices through the tumour volume illustrating levels of hypoxia and proliferation in the baseline, follow-up, and simulated follow-up data sets (colorbars represent SUVs).
In both the [61Cu]Cu-ATSM and the [18F]FLT case, the decrease in the standard deviation of uptake values in response to bevacizumab was reproduced, yielding good quantitative agreement with imaged follow-up data (figure 7, top left). Histograms of the simulated [61Cu]Cu-ATSM and [18F]FLT data sets feature a shift towards lower SUVs and a reduction of the interquartile range (IQR) as observed in the actual follow-up images (see panels b and c and f and g, respectively). Histogram errors do not exhibit a systematic bias, but generally show the highest mismatch (on the order of 2%) in the lower SUV range (SUV<2).
The extracted parameter values for Tcc and VGFmax that were required to achieve good quantitative agreement between simulated and actual follow-up data are summarized for all patients in table 2.
4.2. Sensitivity of the model to input variables
Simulated changes in the mean [61Cu]Cu-ATSM and the [18F]FLT SUV after a single dose of bevacizumab (15 mg/kg) for variable levels of hypoxia, proliferation, and VEGF expression is shown in figure 8.
Figure 8. Sensitivity of the model to input parameter values.

Simulations were based on an example set of baseline [61Cu]Cu-ATSM and [18F]FLT PET images. Two different levels of hypoxia (columns) and average cell cycle times (rows) were simulated. Maximum VGF levels under hypoxia were simulated as either low (green, 2-fold increase), medium (orange, 4-fold increase), or high (red, 6-fold increase).
A transient increase in hypoxia due to bevacizumab can be observed, which peaks during the second week after treatment and decreases with increasing baseline levels of hypoxia (columns) and increasing cell cycle times (rows). In oxic tumours (panels a, c), the magnitude of this transient increase varies less among the different levels of VEGF expression than it does in hypoxic ones. This also results in more pronounced differences in tumour cell proliferation for different VEGF expression levels.
For decreasing levels of tumour cell proliferation, the difference between hypoxia levels is further decreased, which also reduces the difference between proliferation levels for tumours featuring low hypoxia (left column). In a very hypoxic environment (panels b, d), levels of proliferation slightly increase with decreasing proliferative activity towards the end of the simulated timeframe. At the same time, the magnitude of proliferative response (the decrease in FLT SUVmean) following the administration of bevacizumab is reduced with decreasing levels of proliferation.
In general, tumours featuring low VEGF expression levels (grey) feature the highest increases in bevacizumab-induced hypoxia and the lowest levels of proliferation after five weeks. In a scenario of a very hypoxic and slowly proliferating tumour (panel d), different VEGF expression levels have the least effect on [61Cu]Cu-ATSM and [18F]FLT uptake values. In contrast, this effect is maximized in an oxic and rapidly proliferating tumour (panel a). In the latter case, the dynamics in hypoxia and proliferation between day 14 and 21 illustrate the potential relevance when choosing between a clinical treatment regimen in which bevacizumab is administered every two (q2w) or every three weeks (q3w).
4.3. Example model application: simulation of different treatment scenarios
Simulated hypoxic and proliferative responses to six cycles of biweekly (q2w) bevacizumab using an example data set are shown in figure 9. Since the exact intratumoural VEGF levels under hypoxia are unknown, three different levels of VEGF expression were simulated (see figure 3). For the low VEGF scenario, an additional 30% dose reduction (7 mg/kg instead of 10 mg/kg) was simulated.
Figure 9. Hypoxic and proliferative responses to six cycles of bevacizumab.

PET tracer uptake values were simulated for low (green), intermediate (orange), and high (red) hypoxia-induced VEGF expression levels (panels a and c). Histograms of the simulated [61Cu]Cu-ATSM SUVs after 6 fractions (fx) and example coronal slices through the tumour ROI are shown in panel b and d, respectively. Note that the dose reduction led to a significant reduction in tumour hypoxia (panels a, b, and d) while proliferative response could be maintained (panel c, dashed line).
A significant reduction in tumour proliferation can be seen for low and intermediate VEGF levels (figure 9c). Mean hypoxia SUVs decreased (1.7 to 1.4) for high VEGF and increased (1.7 to 2.7) for intermediate VEGF levels (figure 9a). Conversely, while a reduction in tumour hypoxia was achieved for the high VEGF expression case, an increase in proliferation can be observed between treatment weeks 3 and 8. In this case, prolonged treatment is necessary to reduce tumour proliferation. In the low VEGF expression case, mean hypoxia SUV increased from 1.7 to 6.9. However, when the dose is reduced by 30%, this increase can be lowered to an SUVmean of 3.3. This significant reduction can also be seen in the corresponding SUV histograms (panel b) and sagittal views through the tumour volume (panel d).
5. Discussion
5.1. Model parameter values and model sensitivity
The model developed in this work was able to reproduce clinical PET data of proliferation and hypoxia acquired after a single dose of bevacizumab with good quantitative agreement (figure 7). However, this agreement could not be achieved by using patient image data and literature-based parameter values only, but required adjustments of the cell cycle time and the vascular growth fraction parameter values. The fact that these adjustments are required seem reasonable as the [61Cu]Cu-ATSM and [18F]FLT PET data do not carry biological information about these parameters per se, and accordingly, ‘extracting’ these parameters from the available image data would not be adequate. The vascular growth fraction, for example, will depend on local levels of VEGF, which is imaged neither by [61Cu]Cu-ATSM nor by FLT PET. The implications of this and possible ways to quantify these parameters in patients are discussed in the following section.
In our study, simulated levels of tumour hypoxia transiently increase during the first week after treatment, which is consistent with reported pre-clinical (Rapisarda et al 2009) and clinical findings (Hattingen et al 2011, Van der Veldt et al 2012), before falling to levels below baseline (figures 6, 7). In the model, the observed delay between the increase in tumour hypoxia and the decrease in proliferation is due to tumour cells entering the G0 cell cycle phase before undergoing hypoxia-induced apoptosis, which is in accordance with pre-clinical findings (Hasan et al 2011). The dynamic character of the proliferative and hypoxic changes and the interplay between them underline the importance of adequate ‘timing’ of anti-angiogenic therapies. This aspect becomes more prominent in the parameter sensitivity study, where the scenario of a rapidly proliferating tumour featuring low oxygenation levels (figure 8a) showed the most drastic therapeutic response with the highest fluctuations of hypoxia and proliferation over time. In contrast, a very hypoxic, slowly proliferating tumour (figure 8d) shows a proliferative response pattern that is least sensitive to VEGF expression levels and a hypoxic response pattern that approaches baseline levels much faster than in rapidly proliferating tumours. Accordingly, tumours featuring higher levels of pre-treatment hypoxia might be most sensitive to changes in the anti-angiogenic fractionation pattern (i.e., q2w or q3w), due to the rapid changes in tumour oxygenation between weeks 2 and 3.
A continuous increase in hypoxia due to anti-angiogenic therapy was shown in the simulation of different treatment scenarios; here, 6 cycles of bevacizumab q2w led to a more than 2-fold increase of the [61Cu]Cu-ATSM SUVmean in the low VEGF expression case (figure 9, panels a and b). Since hypoxic microenvironments are associated with increased metastatic potential and resistance to therapies, this effect is undesirable. However, this effect has been observed in clinical studies (Hattingen et al 2011, Keunen et al 2011), confirming that continuous treatment with bevacizumab might lead to increased tumour hypoxia (de Groot et al 2010). In contrast, a 30% dose reduction decreased the [61Cu]Cu-ATSM SUVmean (and thus the average level of hypoxia) by almost 50% while maintaining a significant proliferative response. For levels of high VEGF expression, the hypoxic stimulus due to bevacizumab further increases the angiogenic potential of the tumour, resulting in decreased levels of hypoxia and continued tumour proliferation until week 7. In this scenario, therapeutic response might be maximized by administering bevacizumab with concurrent chemo- or radiation therapy. These scenarios further underline the importance of intratumoural VEGF expression levels, which are generally assessed based on blood serum levels that can be ‘contaminated’ by normal tissue response, thus masking fluctuations of tumour VEGF levels (Diamandis 2010). Potential ways to include this factor are discussed below.
5.2. Limitations of the current model implementation
At the current stage, the model incorporates the interplay between tumour cells, vasculature, and diffusible angiogenic factors, which proved sufficient to describe the therapeutic responses observed with molecular imaging; however, due to several simplifications, our approach may lack key biological characteristics and suffer from model parameter values that are not patient-specific.
First, the pharmacodynamics of bevacizumab are reduced and limited to a change in the MVD, which is the primary clinically observed effect (Willett et al 2004, Escudier et al 2007, Motzer et al 2007). In future applications, the pharmacodynamics could be further extended by exploring the hypothesis of vasculature normalization (Jain 2005), i.e., the remodelling of tumour vasculature due to anti-angiogenic therapy such that leaky vessels become stabilized. This could be implemented by including expression levels of additional protein growth factors regulating vessel maturity (such as angiopoietin-1 and angiopoietin-2) (Gevertz 2011). An imbalance of these factors has been shown to affect both vascular permeability and interstitial fluid pressure (Jain 2005, Jain et al 2007), which in turn would impact the oxygen diffusion range in our model. In the current study, angiopoietin levels were not accounted for since they cannot be assessed by imaging. Accordingly, their inclusion would be based on assumption-based parameter values and thus contribute to additional model uncertainty.
Second, the vascular regression parameter (VRFmax) currently relies on xenograft data. Due to potential differences in iso-effect doses across species, the value determined for the VRFmax parameter might be different in humans; however, it serves as a reasonable estimate. Changes in MVD due to bevacizumab have been determined in humans (Willett et al 2004), but given the heterogeneous tumour environment, MVD values determined based on a biopsy cannot fully represent the response characteristics of the entire tumour due to their point-sample character. In future work, more clinically relevant measures of both VRFmax and VGFmax could be derived from PET imaging: For example, integrin alpha-v beta-3 (αvβ3) expression could be assessed using [18F]RGD, which has been used to quantify tumour angiogenesis (Cai et al 2006). αvβ3 is highly expressed by endothelial cells during angiogenesis (Brooks et al 1994), so that imaging before, during, and after therapy could yield quantitative information on angiogenic activity that complements the biological parameters currently included. Similarly, intra-tumoural VEGF expression levels could be assessed via PET imaging using 89Zr-ranibizumab (a 89Zr-labelled fragment derivative of bevacizumab), which has been shown to allow monitoring of angiogenic changes during anti-angiogenic therapy with the tyrosine kinase inhibitor sunitinib (Nagengast et al 2011). In addition, PET imaging using 18F-labelled annexin-V (Murakami et al 2004) has been shown to be an excellent tool for the detection and quantification of cellular apoptosis induced by chemotherapy (Blankenberg et al 1999). Accordingly, this tracer could further complement the patient-specific data utilized in the model, providing independent verification of simulated levels of tumour cell death.
Third, the model is currently built upon the premise of a uniform drug distribution within the tumour. While the pharmacokinetics of bevacizumab are well characterized and can be modelled fairly accurately, additional knowledge of tumour tissue perfusion and drug diffusion across the capillary walls is needed. One approach is to conduct voxel-based kinetic analysis of dynamic [18F]FLT PET scans (Simoncic and Jeraj 2009), which would yield quantitative measures of blood flow and vascular volume (Muzi et al 2005). These parameters could then be utilized to estimate a perfusion-corrected drug exposure for each voxel. Extracted changes in the vascular volume during treatment with bevacizumab (Van der Veldt et al 2012) could be used to verify the simulated changes in MVD. In addition, [18F]FLT kinetic analysis also yields the kinetic transfer constant Ki, which has been shown to correlate better with proliferative activity than the SUV (Ullrich et al 2008) and might thus offer a better estimate of the cell cycle time Tcc.
Accordingly, the use of voxel-based kinetic parameters would allow for the integration of more accurate model parameter estimates and a more rigorous model benchmarking.
Ideally, one would image each patient at least three times: Pre-therapy, early into the treatment, and at a later time point during or after treatment. This way, model parameters can be tuned to patient-specific values based upon the first two scans, before attempting to predict therapeutic responses observed in the third scan. This application of the model to longitudinal studies spanning over the course of multiple months will also require the addition of a reliable deformation module that is able to describe macroscopic growth and shrinkage of the tumour. The successful validation of this biologically-based deformation algorithm is a rather challenging task, but will ultimately allow for additional tuning and benchmarking of the model over longer time scales.
5.3. Potential model applications
We have shown that modelling of proliferative and hypoxic response to anti-angiogenic therapy based on patient-specific, molecular imaging data is feasible and a very promising area for future exploration. While several assumptions were made in this work, future efforts must attempt to minimize these limitations by establishing calibrations between available patient imaging data and corresponding biological parameters, thus enabling a clinical validation of the models. Upon successful validation, this model may improve understanding of the changes in the tumour microenvironment in the context of mono- and combination therapy. If required patient data sets are available, future modelling approaches could be used to support clinical decision making processes, to optimize dosing patterns, and to explore how to best integrate different treatment modalities. Which imaging biomarkers are necessary, how many of them are sufficient, and which might even prove to be unnecessary to fulfil this long term goal are just some of the key questions our modelling approach aims to answer.
More specific applications of the model would be to answer questions arising from clinical “What if…?” scenarios. For example, is a particular patient better suited for bi- or triweekly bevacizumab, or should the patient receive a single induction dose prior to, e.g., radiation therapy? Or, as illustrated in figure 9, is it possible to achieve proliferative response while maintaining acceptable levels of tumour hypoxia? Which variations in biological parameters is the therapeutic response most robust to? Which biological parameters is the therapeutic response most sensitive to, and do these parameters offer opportunities for further therapeutic manipulation?
The targeting of tumor vasculature also has a strong biological rationale in radiation therapy as preclinical studies have shown an increase in radiosensitization with combined treatments (Senan and Smit 2007). Accordingly, there is great interest in combining these two modalities to potentially improve the clinical outcome in advanced malignancies. Here, concurrent or sequential combination therapies including both anti-angiogenic and radiation therapy could be simulated by combining the model presented here with our previous radiation response model (Titz and Jeraj 2008). In this case, a potential optimization goal might be to minimize tumor cell proliferation while at the same time minimizing or at least limiting the degree of tumor hypoxia (see section 4.3). The importance of drug scheduling and its potential implications in a combination therapy setting has recently been shown by Van der Veldt and colleagues (2012), underlining the need for future optimization tools.
Ultimately, the optimization of dose levels and fractionation patterns on a patient-individual basis using imaging-based models might constitute a stepping-stone towards the paradigm shift from population-based treatments to treatment strategies that are tailored to individual patient’s needs.
6. Conclusion
Anti-angiogenic therapy has demonstrated efficacy in various human cancers; however, in order to exploit its full potential, additional investigations of both the exact mechanisms of action of anti-angiogenic drugs and confounding factors influencing therapeutic response are necessary.
In this work, we introduced a unique molecular imaging-based tumour simulation framework that is able to reproduce therapeutic response observed in patients, suggesting potential for the application in a clinical setting. Molecular imaging data, which provide imaging surrogates of tumour biology, allow for the inclusion of patient-specific data that originate from the tumour tissue directly. Accordingly, our model does not rely on systemic biomarkers, which are frequently used to assess therapeutic response to anti-angiogenic therapy, despite their ‘contamination’ by normal tissue response.
We further illustrated the potential use of the model to modify anti-angiogenic treatment regimens given that patient-specific VEGF expression levels are known. After successful validation, this model may serve as a tool to investigate the effects of anti-angiogenic drugs on tumour growth and response dynamics. Ultimately, validated image-driven tumour models may allow for the optimization of anti-angiogenic and combination therapies based upon patient-specific tumour biology.
Acknowledgements
We would like to thank Dr. Paul Harari (UW-Madison Carbone Cancer Center) for providing clinical expertise and Vikram Adhikarla (UW Medical Physics) for fruitful discussions and valuable comments on the manuscript. This work was supported in part by a University of Wisconsin-Madison Richard B. Mazess fellowship award (BT).
References
- Allegra CJ, Yothers G, O'Connell MJ, Sharif S, Petrelli NJ, Colangelo LH, Atkins JN, Seay TE, Fehrenbacher L, Goldberg RM, O0027Reilly S, Chu L, Azar CA, Lopa S, Wolmark N. Phase III trial assessing bevacizumab in stages II and III carcinoma of the colon: results of NSABP protocol C-08. J Clin Oncol. 2011;29:11–16. doi: 10.1200/JCO.2010.30.0855. [DOI] [PMC free article] [PubMed] [Google Scholar]
- Andre F, McShane LM, Michiels S, Ransohoff DF, Altman DG, Reis-Filho JS, Hayes DF, Pusztai L. Biomarker studies: a call for a comprehensive biomarker study registry. Nat Rev Clin Oncol. 2011;8:171–176. doi: 10.1038/nrclinonc.2011.4. [DOI] [PubMed] [Google Scholar]
- Azoitei N, Pusapati GV, Kleger A, Moller P, Kufer R, Genze F, Wagner M, van Lint J, Carmeliet P, Adler G, Seufferlein T. Protein kinase D2 is a crucial regulator of tumour cell-endothelial cell communication in gastrointestinal tumours. Gut. 2010;59:1316–1330. doi: 10.1136/gut.2009.206813. [DOI] [PubMed] [Google Scholar]
- Beasley NJ, Wykoff CC, Watson PH, Leek R, Turley H, Gatter K, Pastorek J, Cox GJ, Ratcliffe P, Harris AL. Carbonic anhydrase IX, an endogenous hypoxia marker, expression in head and neck squamous cell carcinoma and its relationship to hypoxia, necrosis, and microvessel density. Cancer Res. 2001;61:5262–5267. [PubMed] [Google Scholar]
- Billy F, Ribba B, Saut O, Morre-Trouilhet H, Colin T, Bresch D, Boissel JP, Grenier E, Flandrois JP. A pharmacologically based multiscale mathematical model of angiogenesis and its use in investigating the efficacy of a new cancer treatment strategy. J Theor Biol. 2009;260:545–562. doi: 10.1016/j.jtbi.2009.06.026. [DOI] [PubMed] [Google Scholar]
- Blancher C, Moore JW, Talks KL, Houlbrook S, Harris AL. Relationship of hypoxia-inducible factor (HIF)-1alpha and HIF-2alpha expression to vascular endothelial growth factor induction and hypoxia survival in human breast cancer cell lines. Cancer Res. 2000;60:7106–7113. [PubMed] [Google Scholar]
- Blankenberg FG, Katsikis PD, Tait JF, Davis RE, Naumovski L, Ohtsuki K, Kopiwoda S, Abrams MJ, Strauss HW. Imaging of apoptosis (programmed cell death) with 99mTc annexin V. J Nucl Med. 1999;40:184–191. [PubMed] [Google Scholar]
- Bock F, Onderka J, Dietrich T, Bachmann B, Kruse FE, Paschke M, Zahn G, Cursiefen C. Bevacizumab as a potent inhibitor of inflammatory corneal angiogenesis and lymphangiogenesis. Invest Ophthalmol Vis Sci. 2007;48:2545–2552. doi: 10.1167/iovs.06-0570. [DOI] [PubMed] [Google Scholar]
- Brooks PC, Clark RA, Cheresh DA. Requirement of vascular integrin alpha v beta 3 for angiogenesis. Science. 1994;264:569–571. doi: 10.1126/science.7512751. [DOI] [PubMed] [Google Scholar]
- Cai W, Zhang X, Wu Y, Chen X. A thiol-reactive 18F-labeling agent, N-[2-(4-18F-fluorobenzamido)ethyl]maleimide, and synthesis of RGD peptide-based tracer for PET imaging of alpha v beta 3 integrin expression. J Nucl Med. 2006;47:1172–1180. [PMC free article] [PubMed] [Google Scholar]
- Carmeliet P. Angiogenesis in health and disease. Nat Med. 2003;9:653–660. doi: 10.1038/nm0603-653. [DOI] [PubMed] [Google Scholar]
- Christian N, Lee JA, Bol A, De Bast M, Jordan B, Gregoire V. The limitation of PET imaging for biological adaptive-IMRT assessed in animal models. Radiother Oncol. 2009;91:101–106. doi: 10.1016/j.radonc.2008.11.014. [DOI] [PubMed] [Google Scholar]
- de Groot JF, Fuller G, Kumar AJ, Piao Y, Eterovic K, Ji Y, Conrad CA. Tumor invasion after treatment of glioblastoma with bevacizumab: radiographic and pathologic correlation in humans and mice. Neuro Oncol. 2010;12:233–242. doi: 10.1093/neuonc/nop027. [DOI] [PMC free article] [PubMed] [Google Scholar]
- De Los Santos JF, Thomas GM. Anemia correction in malignancy management: threat or opportunity? Gynecol Oncol. 2007;105:517–529. doi: 10.1016/j.ygyno.2006.12.037. [DOI] [PubMed] [Google Scholar]
- Deisboeck TS, Zhang L, Yoon J, Costa J. In silico cancer modeling: is it ready for prime time? Nat Clin Pract Oncol. 2009;6:34–42. doi: 10.1038/ncponc1237. [DOI] [PMC free article] [PubMed] [Google Scholar]
- Desar IM, van Herpen CM, van Laarhoven HW, Barentsz JO, Oyen WJ, van der Graaf WT. Beyond RECIST: molecular and functional imaging techniques for evaluation of response to targeted therapy. Cancer Treat Rev. 2009;35:309–321. doi: 10.1016/j.ctrv.2008.12.001. [DOI] [PubMed] [Google Scholar]
- Diamandis EP. Cancer Biomarkers: Can We Turn Recent Failures into Success? J Natl Cancer Inst. 2010 doi: 10.1093/jnci/djq306. [DOI] [PMC free article] [PubMed] [Google Scholar]
- Du J, Li FH, Fang H, Xia JG, Zhu CX. Correlation of real-time gray scale contrast-enhanced ultrasonography with microvessel density and vascular endothelial growth factor expression for assessment of angiogenesis in breast lesions. J Ultrasound Med. 2008;27:821–831. doi: 10.7863/jum.2008.27.6.821. [DOI] [PubMed] [Google Scholar]
- Duda DG, Batchelor TT, Willett CG, Jain RK. VEGF-targeted cancer therapy strategies: current progress, hurdles and future prospects. Trends Mol Med. 2007;13:223–230. doi: 10.1016/j.molmed.2007.04.001. [DOI] [PMC free article] [PubMed] [Google Scholar]
- Dvorak HF. Vascular permeability factor/vascular endothelial growth factor: a critical cytokine in tumor angiogenesis and a potential target for diagnosis and therapy. J Clin Oncol. 2002;20:4368–4380. doi: 10.1200/JCO.2002.10.088. [DOI] [PubMed] [Google Scholar]
- Escudier B, Pluzanska A, Koralewski P, Ravaud A, Bracarda S, Szczylik C, Chevreau C, Filipek M, Melichar B, Bajetta E, Gorbunova V, Bay JO, Bodrogi I, Jagiello-Gruszfeld A, Moore N. Bevacizumab plus interferon alfa-2a for treatment of metastatic renal cell carcinoma: a randomised, double-blind phase III trial. Lancet. 2007;370:2103–2111. doi: 10.1016/S0140-6736(07)61904-7. [DOI] [PubMed] [Google Scholar]
- Ferrara N, Davis-Smyth T. The biology of vascular endothelial growth factor. Endocr Rev. 1997;18:4–25. doi: 10.1210/edrv.18.1.0287. [DOI] [PubMed] [Google Scholar]
- Ferrara N, Hillan KJ, Gerber HP, Novotny W. Discovery and development of bevacizumab, an anti-VEGF antibody for treating cancer. Nat Rev Drug Discov. 2004;3:391–400. doi: 10.1038/nrd1381. [DOI] [PubMed] [Google Scholar]
- Folkman J. Tumor angiogenesis: therapeutic implications. N Engl J Med. 1971;285:1182–1186. doi: 10.1056/NEJM197111182852108. [DOI] [PubMed] [Google Scholar]
- Folkman J. Proceedings: Tumor angiogenesis factor. Cancer Res. 1974;34:2109–2113. [PubMed] [Google Scholar]
- Forsythe JA, Jiang BH, Iyer NV, Agani F, Leung SW, Koos RD, Semenza GL. Activation of vascular endothelial growth factor gene transcription by hypoxia-inducible factor 1. Mol Cell Biol. 1996;16:4604–4613. doi: 10.1128/mcb.16.9.4604. [DOI] [PMC free article] [PubMed] [Google Scholar]
- Fujita K, Sano D, Kimura M, Yamashita Y, Kawakami M, Ishiguro Y, Nishimura G, Matsuda H, Tsukuda M. Anti-tumor effects of bevacizumab in combination with paclitaxel on head and neck squamous cell carcinoma. Oncol Rep. 2007;18:47–51. [PubMed] [Google Scholar]
- Gerber HP, Ferrara N. Pharmacology and pharmacodynamics of bevacizumab as monotherapy or in combination with cytotoxic therapy in preclinical studies. Cancer Res. 2005;65:671–680. [PubMed] [Google Scholar]
- Gevertz JL. Computational modeling of tumor response to vascular-targeting therapies--part I: validation. Comput Math Methods Med. 2011;2011:830515. doi: 10.1155/2011/830515. [DOI] [PMC free article] [PubMed] [Google Scholar]
- Gordon MS, Margolin K, Talpaz M, Sledge GW, Jr, Holmgren E, Benjamin R, Stalter S, Shak S, Adelman D. Phase I safety and pharmacokinetic study of recombinant human anti-vascular endothelial growth factor in patients with advanced cancer. J Clin Oncol. 2001;19:843–850. doi: 10.1200/JCO.2001.19.3.843. [DOI] [PubMed] [Google Scholar]
- Gorelik B, Ziv I, Shohat R, Wick M, Hankins WD, Sidransky D, Agur Z. Efficacy of weekly docetaxel and bevacizumab in mesenchymal chondrosarcoma: a new theranostic method combining xenografted biopsies with a mathematical model. Cancer Res. 2008;68:9033–9040. doi: 10.1158/0008-5472.CAN-08-1723. [DOI] [PMC free article] [PubMed] [Google Scholar]
- Grothey A, Galanis E. Targeting angiogenesis: progress with anti-VEGF treatment with large molecules. Nat Rev Clin Oncol. 2009;6:507–518. doi: 10.1038/nrclinonc.2009.110. [DOI] [PubMed] [Google Scholar]
- Hanahan D, Weinberg RA. Hallmarks of cancer: the next generation. Cell. 2011;144:646–674. doi: 10.1016/j.cell.2011.02.013. [DOI] [PubMed] [Google Scholar]
- Harari PM, Khuntia D, Traynor AM, Hoang T, Yang DT, Hartig GK, McCulloch TM, Jeraj R, Nyflot MJ, Wiederholt PA, Gentry LR. Phase I trial of bevacizumab combined with concurrent chemoradiation for squamous cell carcinoma of the head and neck: Preliminary outcome results. J Clin Oncol. 2011;29:5518. [Google Scholar]
- Hasan MR, Ho SH, Owen DA, Tai IT. Inhibition of VEGF induces cellular senescence in colorectal cancer cells. Int J Cancer. 2011 doi: 10.1002/ijc.26179. [DOI] [PubMed] [Google Scholar]
- Hattingen E, Jurcoane A, Bahr O, Rieger J, Magerkurth J, Anti S, Steinbach JP, Pilatus U. Bevacizumab impairs oxidative energy metabolism and shows antitumoral effects in recurrent glioblastomas: a 31P/1H MRSI and quantitative magnetic resonance imaging study. Neuro Oncol. 2011 doi: 10.1093/neuonc/nor132. [DOI] [PMC free article] [PubMed] [Google Scholar]
- Helmlinger G, Endo M, Ferrara N, Hlatky L, Jain RK. Formation of endothelial cell networks. Nature. 2000;405:139–141. doi: 10.1038/35012132. [DOI] [PubMed] [Google Scholar]
- Hicklin DJ, Ellis LM. Role of the vascular endothelial growth factor pathway in tumor growth and angiogenesis. J Clin Oncol. 2005;23:1011–1027. doi: 10.1200/JCO.2005.06.081. [DOI] [PubMed] [Google Scholar]
- Huang SM, et al. Modulation of radiation response and tumor-induced angiogenesis after epidermal growth factor receptor inhibition by ZD1839 (Iressa) Cancer Res. 2002;62(15):4300–4306. [PubMed] [Google Scholar]
- Jain RK. Normalization of tumor vasculature: an emerging concept in antiangiogenic therapy. Science. 2005;307:58–62. doi: 10.1126/science.1104819. [DOI] [PubMed] [Google Scholar]
- Jain RK, Duda DG, Clark JW, Loeffler JS. Lessons from phase III clinical trials on anti-VEGF therapy for cancer. Nat Clin Pract Oncol. 2006;3:24–40. doi: 10.1038/ncponc0403. [DOI] [PubMed] [Google Scholar]
- Jiang BH, Semenza GL, Bauer C, Marti HH. Hypoxia-inducible factor 1 levels vary exponentially over a physiologically relevant range of O2 tension. Am J Physiol. 1996;271:C1172–C1180. doi: 10.1152/ajpcell.1996.271.4.C1172. [DOI] [PubMed] [Google Scholar]
- Johnson NF, et al. DNA damage-inducible genes as biomarkers for exposures to environmental agents. Environ Health Perspect. 1997;105(Suppl 4):913–918. doi: 10.1289/ehp.97105s4913. [DOI] [PMC free article] [PubMed] [Google Scholar]
- Kelly CJ, Brady M. A model to simulate tumour oxygenation and dynamic [18F]-Fmiso PET data. Phys Med Biol. 2006;51:5859–5873. doi: 10.1088/0031-9155/51/22/009. [DOI] [PubMed] [Google Scholar]
- Keunen O, Johansson M, Oudin A, Sanzey M, Rahim SA, Fack F, Thorsen F, Taxt T, Bartos M, Jirik R, Miletic H, Wang J, Stieber D, Stuhr L, Moen I, Rygh CB, Bjerkvig R, Niclou SP. Anti-VEGF treatment reduces blood supply and increases tumor cell invasion in glioblastoma. Proc Natl Acad Sci U S A. 2011;108:3749–3754. doi: 10.1073/pnas.1014480108. [DOI] [PMC free article] [PubMed] [Google Scholar]
- Kim KJ, Li B, Winer J, Armanini M, Gillett N, Phillips HS, Ferrara N. Inhibition of vascular endothelial growth factor-induced angiogenesis suppresses tumour growth in vivo. Nature. 1993;362:841–844. doi: 10.1038/362841a0. [DOI] [PubMed] [Google Scholar]
- Kindler HL, Niedzwiecki D, Hollis D, Sutherland S, Schrag D, Hurwitz H, Innocenti F, Mulcahy MF, O'Reilly E, Wozniak TF, Picus J, Bhargava P, Mayer RJ, Schilsky RL, Goldberg RM. Gemcitabine plus bevacizumab compared with gemcitabine plus placebo in patients with advanced pancreatic cancer: phase III trial of the Cancer and Leukemia Group B (CALGB 80303) J Clin Oncol. 2010;28:3617–3622. doi: 10.1200/JCO.2010.28.1386. [DOI] [PMC free article] [PubMed] [Google Scholar]
- Kohandel M, Kardar M, Milosevic M, Sivaloganathan S. Dynamics of tumor growth and combination of anti-angiogenic and cytotoxic therapies. Phys Med Biol. 2007;52:3665–3677. doi: 10.1088/0031-9155/52/13/001. [DOI] [PubMed] [Google Scholar]
- Koukourakis MI, et al. Early antivascular effects of bevacizumab anti-VEGF monoclonal antibody on colorectal carcinomas assessed with functional CT imaging. Am J Clin Oncol. 2007;30(3):315–318. doi: 10.1097/01.coc.0000258119.90805.ca. [DOI] [PubMed] [Google Scholar]
- Krasnoperov RA, Gerasimov AN. Probability density functions for axial ratios of sectioning profiles of anisotropically arranged elliptical microvessels. Math Biosci. 2009;219:97–103. doi: 10.1016/j.mbs.2009.03.001. [DOI] [PubMed] [Google Scholar]
- Liu W, Ahmad SA, Reinmuth N, Shaheen RM, Jung YD, Fan F, Ellis LM. Endothelial cell survival and apoptosis in the tumor vasculature. Apoptosis. 2000;5:323–328. doi: 10.1023/a:1009679307513. [DOI] [PubMed] [Google Scholar]
- Loggini B, Boldrini L, Gisfredi S, Ursino S, Camacci T, De Jeso K, Cervadoro G, Pingitore R, Barachini P, Leocata P, Fontanini G. CD34 microvessel density and VEGF expression in basal and squamous cell carcinoma. Pathol Res Pract. 2003;199:705–712. doi: 10.1078/0344-0338-00486. [DOI] [PubMed] [Google Scholar]
- Lu JF, Bruno R, Eppler S, Novotny W, Lum B, Gaudreault J. Clinical pharmacokinetics of bevacizumab in patients with solid tumors. Cancer Chemother Pharmacol. 2008;62:779–786. doi: 10.1007/s00280-007-0664-8. [DOI] [PubMed] [Google Scholar]
- Mac Gabhann F, Ji JW, Popel AS. VEGF gradients, receptor activation, and sprout guidance in resting and exercising skeletal muscle. J Appl Physiol. 2007;102:722–734. doi: 10.1152/japplphysiol.00800.2006. [DOI] [PubMed] [Google Scholar]
- May D, Itin A, Gal O, Kalinski H, Feinstein E, Keshet E. Ero1-L alpha plays a key role in a HIF-1-mediated pathway to improve disulfide bond formation and VEGF secretion under hypoxia: implication for cancer. Oncogene. 2005;24:1011–1020. doi: 10.1038/sj.onc.1208325. [DOI] [PubMed] [Google Scholar]
- Motzer RJ, Hutson TE, Tomczak P, Michaelson MD, Bukowski RM, Rixe O, Oudard S, Negrier S, Szczylik C, Kim ST, Chen I, Bycott PW, Baum CM, Figlin RA. Sunitinib versus interferon alfa in metastatic renal-cell carcinoma. N Engl J Med. 2007;356:115–124. doi: 10.1056/NEJMoa065044. [DOI] [PubMed] [Google Scholar]
- Murakami Y, Takamatsu H, Taki J, Tatsumi M, Noda A, Ichise R, Tait JF, Nishimura S. 18F-labelled annexin V: a PET tracer for apoptosis imaging. Eur J Nucl Med Mol Imaging. 2004;31:469–474. doi: 10.1007/s00259-003-1378-8. [DOI] [PubMed] [Google Scholar]
- Muzi M, et al. Kinetic analysis of 3'-deoxy-3'-fluorothymidine PET studies: validation studies in patients with lung cancer. J Nucl Med. 2005;46(2):274–282. [PubMed] [Google Scholar]
- Nagengast WB, Lub-de Hooge MN, Oosting SF, den Dunnen WF, Warnders FJ, Brouwers AH, de Jong JR, Price PM, Hollema H, Hospers GA, Elsinga PH, Hesselink JW, Gietema JA, de Vries EG. VEGF-PET imaging is a noninvasive biomarker showing differential changes in the tumor during sunitinib treatment. Cancer Res. 2011;71:143–153. doi: 10.1158/0008-5472.CAN-10-1088. [DOI] [PubMed] [Google Scholar]
- Nakasaki T, Wada H, Shigemori C, Miki C, Gabazza EC, Nobori T, Nakamura S, Shiku H. Expression of tissue factor and vascular endothelial growth factor is associated with angiogenesis in colorectal cancer. Am J Hematol. 2002;69:247–254. doi: 10.1002/ajh.10061. [DOI] [PubMed] [Google Scholar]
- Ou G, Itasaka S, Zeng L, Shibuya K, Yi J, Harada H, Hiraoka M. Usefulness of HIF-1 imaging for determining optimal timing of combining bevacizumab and radiotherapy. Int J Radiat Oncol Biol Phys. 2009;75:463–467. doi: 10.1016/j.ijrobp.2009.02.083. [DOI] [PubMed] [Google Scholar]
- Petit SF, Dekker AL, Seigneuric R, Murrer L, van Riel NA, Nordsmark M, Overgaard J, Lambin P, Wouters BG. Intra-voxel heterogeneity influences the dose prescription for dose-painting with radiotherapy: a modelling study. Phys Med Biol. 2009;54:2179–2196. doi: 10.1088/0031-9155/54/7/022. [DOI] [PubMed] [Google Scholar]
- Presta LG, Chen H, O'Connor SJ, Chisholm V, Meng YG, Krummen L, Winkler M, Ferrara N. Humanization of an anti-vascular endothelial growth factor monoclonal antibody for the therapy of solid tumors and other disorders. Cancer Res. 1997;57:4593–4599. [PubMed] [Google Scholar]
- Rapisarda A, Hollingshead M, Uranchimeg B, Bonomi CA, Borgel SD, Carter JP, Gehrs B, Raffeld M, Kinders RJ, Parchment R, Anver MR, Shoemaker RH, Melillo G. Increased antitumor activity of bevacizumab in combination with hypoxia inducible factor-1 inhibition. Mol Cancer Ther. 2009;8:1867–1877. doi: 10.1158/1535-7163.MCT-09-0274. [DOI] [PMC free article] [PubMed] [Google Scholar]
- Ribba B, Watkin E, Tod M, Girard P, Grenier E, You B, Giraudo E, Freyer G. A model of vascular tumour growth in mice combining longitudinal tumour size data with histological biomarkers. Eur J Cancer. 2010 doi: 10.1016/j.ejca.2010.10.003. [DOI] [PubMed] [Google Scholar]
- Rofstad EK, Henriksen K, Galappathi K, Mathiesen B. Antiangiogenic treatment with thrombospondin-1 enhances primary tumor radiation response and prevents growth of dormant pulmonary micrometastases after curative radiation therapy in human melanoma xenografts. Cancer Res. 2003;63:4055–4061. [PubMed] [Google Scholar]
- Schlageter KE, Molnar P, Lapin GD, Groothuis DR. Microvessel organization and structure in experimental brain tumors: microvessel populations with distinctive structural and functional properties. Microvasc Res. 1999;58:312–328. doi: 10.1006/mvre.1999.2188. [DOI] [PubMed] [Google Scholar]
- Schoch HJ, Fischer S, Marti HH. Hypoxia-induced vascular endothelial growth factor expression causes vascular leakage in the brain. Brain. 2002;125:2549–2557. doi: 10.1093/brain/awf257. [DOI] [PubMed] [Google Scholar]
- Secomb TW, Hsu R, Park EY, Dewhirst MW. Green's function methods for analysis of oxygen delivery to tissue by microvascular networks. Ann Biomed Eng. 2004;32:1519–1529. doi: 10.1114/b:abme.0000049036.08817.44. [DOI] [PubMed] [Google Scholar]
- Semenza GL. Hypoxia-inducible factor 1: oxygen homeostasis and disease pathophysiology. Trends Mol Med. 2001;7:345–350. doi: 10.1016/s1471-4914(01)02090-1. [DOI] [PubMed] [Google Scholar]
- Senan S, Smit EF. Design of clinical trials of radiation combined with antiangiogenic therapy. Oncologist. 2007;12:465–477. doi: 10.1634/theoncologist.12-4-465. [DOI] [PubMed] [Google Scholar]
- Shah C, Miller TW, Wyatt SK, McKinley ET, Olivares MG, Sanchez V, Nolting DD, Buck JR, Zhao P, Ansari MS, Baldwin RM, Gore JC, Schiff R, Arteaga CL, Manning HC. Imaging biomarkers predict response to anti-HER2 (ErbB2) therapy in preclinical models of breast cancer. Clin Cancer Res. 2009;15:4712–4721. doi: 10.1158/1078-0432.CCR-08-2635. [DOI] [PMC free article] [PubMed] [Google Scholar]
- Shweiki D, Itin A, Soffer D, Keshet E. Vascular endothelial growth factor induced by hypoxia may mediate hypoxia-initiated angiogenesis. Nature. 1992;359:843–845. doi: 10.1038/359843a0. [DOI] [PubMed] [Google Scholar]
- Simoncic U, Jeraj R. Voxel-based kinetic analysis method utilizing ROI fragmentation. Medical Physics. 2009;36:2817. [Google Scholar]
- Sinor AD, Irvin SM, Cobbs CS, Chen J, Graham SH, Greenberg DA. Hypoxic induction of vascular endothelial growth factor (VEGF) protein in astroglial cultures. Brain Res. 1998;812:289–291. doi: 10.1016/s0006-8993(98)00976-7. [DOI] [PubMed] [Google Scholar]
- Stroobants S, Goeminne J, Seegers M, Dimitrijevic S, Dupont P, Nuyts J, Martens M, van den Borne B, Cole P, Sciot R, Dumez H, Silberman S, Mortelmans L, van Oosterom A. 18FDG-Positron emission tomography for the early prediction of response in advanced soft tissue sarcoma treated with imatinib mesylate (Glivec) Eur J Cancer. 2003;39:2012–2020. doi: 10.1016/s0959-8049(03)00073-x. [DOI] [PubMed] [Google Scholar]
- Tanaka F, et al. Evaluation of angiogenesis in non-small cell lung cancer: comparison between anti-CD34 antibody and anti-CD105 antibody. Clin Cancer Res. 2001;7(11):3410–3415. [PubMed] [Google Scholar]
- Tannock IF. Oxygen diffusion and the distribution of cellular radiosensitivity in tumours. British Journal of Radiology. 1972;45:515–524. doi: 10.1259/0007-1285-45-535-515. [DOI] [PubMed] [Google Scholar]
- Titz B, Jeraj R. An imaging-based tumour growth and treatment response model: investigating the effect of tumour oxygenation on radiation therapy response. Phys Med Biol. 2008;53:4471–4488. doi: 10.1088/0031-9155/53/17/001. [DOI] [PMC free article] [PubMed] [Google Scholar]
- Toi M, Inada K, Suzuki H, Tominaga T. Tumor angiogenesis in breast cancer: its importance as a prognostic indicator and the association with vascular endothelial growth factor expression. Breast Cancer Res Treat. 1995;36:193–204. doi: 10.1007/BF00666040. [DOI] [PubMed] [Google Scholar]
- Tsuji T, Sasaki Y, Tanaka M, Hanabata N, Hada R, Munakata A. Microvessel morphology and vascular endothelial growth factor expression in human colonic carcinoma with or without metastasis. Lab Invest. 2002;82:555–562. doi: 10.1038/labinvest.3780450. [DOI] [PubMed] [Google Scholar]
- Ullrich R, et al. Glioma proliferation as assessed by 3'-fluoro-3'-deoxy-L-thymidine positron emission tomography in patients with newly diagnosed high-grade glioma. Clin Cancer Res. 2008;14(7):2049–2055. doi: 10.1158/1078-0432.CCR-07-1553. [DOI] [PubMed] [Google Scholar]
- Van der Veldt AA, Lubberink M, Bahce I, Walraven M, de Boer MP, Greuter HN, Hendrikse NH, Eriksson J, Windhorst AD, Postmus PE, Verheul HM, Serne EH, Lammertsma AA, Smit EF. Rapid decrease in delivery of chemotherapy to tumors after anti-VEGF therapy: implications for scheduling of anti-angiogenic drugs. Cancer Cell. 2012;21:82–91. doi: 10.1016/j.ccr.2011.11.023. [DOI] [PubMed] [Google Scholar]
- Wang Y, Fei D, Vanderlaan M, Song A. Biological activity of bevacizumab, a humanized anti-VEGF antibody in vitro. Angiogenesis. 2004;7:335–345. doi: 10.1007/s10456-004-8272-2. [DOI] [PubMed] [Google Scholar]
- Wedam SB, Low JA, Yang SX, Chow CK, Choyke P, Danforth D, Hewitt SM, Berman A, Steinberg SM, Liewehr DJ, Plehn J, Doshi A, Thomasson D, McCarthy N, Koeppen H, Sherman M, Zujewski J, Camphausen K, Chen H, Swain SM. Antiangiogenic and antitumor effects of bevacizumab in patients with inflammatory and locally advanced breast cancer. J Clin Oncol. 2006;24:769–777. doi: 10.1200/JCO.2005.03.4645. [DOI] [PubMed] [Google Scholar]
- Willett CG, Boucher Y, di Tomaso E, Duda DG, Munn LL, Tong RT, Chung DC, Sahani DV, Kalva SP, Kozin SV, Mino M, Cohen KS, Scadden DT, Hartford AC, Fischman AJ, Clark JW, Ryan DP, Zhu AX, Blaszkowsky LS, Chen HX, Shellito PC, Lauwers GY, Jain RK. Direct evidence that the VEGF-specific antibody bevacizumab has antivascular effects in human rectal cancer. Nat Med. 2004;10:145–147. doi: 10.1038/nm988. [DOI] [PMC free article] [PubMed] [Google Scholar]
- Zatterstrom UK, Kallen A, Wennerberg J. Cell cycle time, growth fraction and cell loss in xenografted head and neck cancer. In Vivo. 1991;5:137–142. [PubMed] [Google Scholar]
- Zhou Q, Guo P, Gallo JM. Impact of angiogenesis inhibition by sunitinib on tumor distribution of temozolomide. Clin Cancer Res. 2008;14:1540–1549. doi: 10.1158/1078-0432.CCR-07-4544. [DOI] [PubMed] [Google Scholar]
- Zhu X, Wu S, Dahut WL, Parikh CR. Risks of proteinuria and hypertension with bevacizumab, an antibody against vascular endothelial growth factor: systematic review and meta-analysis. Am J Kidney Dis. 2007;49:186–193. doi: 10.1053/j.ajkd.2006.11.039. [DOI] [PubMed] [Google Scholar]
- Zips D, Krause M, Hessel F, Westphal J, Bruchner K, Eicheler W, Dorfler A, Grenman R, Petersen C, Haberey M, Baumann M. Experimental study on different combination schedules of VEGF-receptor inhibitor PTK787/ZK222584 and fractionated irradiation. Anticancer Res. 2003;23:3869–3876. [PubMed] [Google Scholar]