

Abstract
Disruption of regulatory protein phosphorylation can lead to disease, and is particularly prevalent in cancers. Inhibitors that target deregulated kinases are therefore a major focus of chemotherapeutic development. Achieving sensitivity and specificity in high-throughput compatible kinase assays is key to successful inhibitor development. Here we describe the application of time-resolved luminescence detection to the direct sensing of Syk kinase activity and inhibition using a novel peptide substrate. Chelation and luminescence sensitization of Tb3+ allowed the direct detection of peptide phosphorylation without any antibodies or other labeling reagents. Characterizing the Tb3+ coordination properties of the phosphorylated vs. unphosphorylated form of the peptide revealed that an inner-sphere water was displaced upon phosphorylation, which likely was responsible for both enhancing the luminescence intensity and also extending the lifetime, which enabled gating of the luminescence signal to improve the dynamic range. Furthermore, a shift in the optimal absorbance maximum for excitation was observed, from 275 nm (for the unphosphorylated tyrosine peptide) to 266 nm (for the phosphorylated tyrosine peptide). Accordingly, time-resolved measurements with excitation at 266 nm via a monochromator enabled a 16-fold improvement in base signal to noise for distinguishing phosphopeptide from unphosphorylated peptide. This led to a high degree of sensitivity and quantitative reproducibility, demonstrating the amenability of this method to both research laboratory and high-throughput applications.
Keywords: Spleen tyrosine kinase, kinase assay, terbium, time-resolved luminescence probe, peptide biosensor
Introduction
Protein kinases play a critical role in multiple cellular processes including growth, proliferation and apoptosis. The deregulation of this mechanism can cause an imbalance between proliferation and death leading to a number of disease states including cancer. Kinase inhibitor drug development is often confounded by the complexity of protein kinase signalling pathways, leading to advancement of inhibitors with substantial off-target effects (which may or may not be beneficial to efficacy) into clinical trials. (1–2) Spleen tyrosine kinase (Syk) has recently become an attractive therapeutic target due to its role in multiple diseases, including rheumatoid arthritis, non-Hodgkin’s lymphomas and chronic lymphocytic leukaemia. (3–5) However, the development of small molecule inhibitors specifically and selectively targeting Syk has been challenging, (6–7) with the inhibitor fostamatinib (previously described as ‘specific’ for Syk) found to bind to at least 100 other targets with affinity better than that for Syk. (6) Therefore, sensitive and specific tools for monitoring Syk activity are needed to assist in the development of Syk specific inhibitors through the rapid screening of therapeutic agents as well as for monitoring therapeutic response as a companion diagnostic in the clinic.
Peptide-based approaches can be used for measuring kinase activity either in vitro or in intact cells with a variety of detection strategies. (8–11) Because they enable the screening of many samples and conditions at once with high sensitivity using commonly available instrumentation, multi-well plate-based detection methods using fluorescence or luminescence are most compatible with drug discovery and clinical applications. (12–13) Phosphorylation-sensitized lanthanide luminescence has been used as a high-throughput-compatible probe for kinase activity. Lanthanides have unique optical properties including large stokes shifts, long luminescent life times and narrow emission bands. (14) Additionally, lanthanides are hard acids giving them preferred coordination with negatively charged species such as phosphate, carboxylate and carbonyl groups. (15–16) However, lanthanides are poor absorbers and require a sensitizing chromophore to achieve luminescence as well as a coordination environment that excludes water to prevent solvent luminescence quenching. (17) Accordingly, highly acidic peptides that contain appropriate chromophores can provide the necessary coordination environment and sensitization for luminescence.
Several approaches have been developed for the detection of tyrosine phosphorylation using terbium (Tb3+) based on these properties. Phosphorylation of a peptide can dramatically increase the peptide’s affinity for terbium. (18–24) Sensitization of luminescence is achieved either through a chromophore label or through the phosphorylated tyrosine itself. (13, 18–20, 22, 25–26) Previously reported approaches provide approximately a 2 to 10-fold increase in steady-state luminescence upon phosphorylation, depending on the peptide sequence involved—however, since the unphosphorylated forms of most acidic peptides also bind Tb3+ and exhibit luminescence to some degree, signal to noise and background can be a challenge for distinguishing phosphorylated from unphosphorylated peptide.
Recently, we developed a Syk specific artificial substrate peptide (SAStide) consisting of an acidic motif with a central tyrosine capable of detecting intracellular Syk activity in response to physiologically relevant stimuli and pharmacological inhibition (27). Based on the similarity of the arrangement of carboxylate groups and the central tyrosine in this sequence with the motif found in the atypical phosphorylation dependent terbium sensitizing peptide of α-synuclein (Fig. 1A), we chose to explore the use of this peptide as a probe for the detection of Syk activity through terbium-sensitized luminescence. Because (as with all fluorophores) lanthanide luminescent lifetimes are sensitive to the chemical environment of the metal ion, (28) we also tested whether chelation of Tb3+ with the phosphorylated vs. unphosphorylated peptide could be more easily distinguished using time-resolved luminescence detection. In a time-resolved luminescence measurement, the short-lived background luminescence is allowed to decay before measuring the luminescence of the chelated Tb3+ (Scheme 1). While the overall sensitivity for a time-resolved vs. a steady state measurement is usually lower because of the gating of the highest intensity initial signal, this can be mitigated to some degree by optimizing the integration times. The long luminescent lifetime of terbium enables use of longer integration times, and provides an opportunity to eliminate any interference from autofluorescence and other background within the sample increasing the specificity and signal to noise for detection. Here we describe the testing and characterization of this strategy as a method for detecting Syk kinase activity and inhibition.
Figure 1.
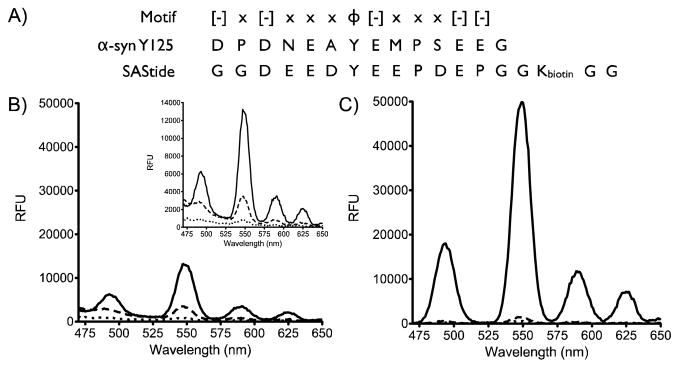
Detection of phosphorylation of SAStide through terbium luminescence. A) Sequence alignment of a peptide from α-synuclein, an atypical terbium sensitizing peptide, and SAStide. B) Steady-state luminescence and C) time-resolved luminescence emission plots for SAStide and pSAStide. pSAStide (—) SAStide (---) and Tb (· · ·). Spectra were collected from 15 μM peptide in the presence of 100 μM Tb3+ in 10mM HEPES, 100mM NaCl, pH 7.0, λex=266nm, 1000ms collection time, 50 μsec delay time and sensitivity 180. Data represent the average of experiments performed in triplicate.
Scheme 1.

Time-resolved luminescence detection of Syk activity using SAStide (GGDEEDYEEPDEPGGKbGG).
Materials and Methods
Peptide Synthesis and Purification
Peptides were synthesized at a 50 μmol scale using a Protein Technologies Prelude Parallel peptide synthesizer on CLEAR-amide resin (Peptides International). Coupling of standard Fmoc (9-fluorenylmethoxy-carbonyl)-protected amino acids (Peptides International) were achieved with HCTU in the presence of NMM in DMF for two 10 min couplings. Fmoc deprotection was achieved in 20% piperidine in DMF for two 2.5 min cycles. Side-chain deprotection and peptide cleavage from the resin was performed in 5 ml cocktail of trifluoroacetic acid (TFA): water: ethane dithiol (EDT): triisopropylsilane (TIS) (94:2.5:2.5:1). Peptides were precipitated and washed three times with cold diethyl ether. The peptides were dissolved in acetonitrile: water: TFA (50:50:0.1), flash frozen and lyophilized. The peptides were purified by preparative reverse-phase HPLC (Agilent Technologies 1200 Series) a using C18 reverse-phase column.
Luminescence Emission Measurements
Emission spectra (both steady-state and time-resolved) were collected on a Biotek Synergy4 plate reader equipped with a monochromator at 23°C in black 384-well plates (Greiner Fluortrac 200). For time-resolved measurements, spectra were collected after excitation at either 266 nm or 280 nm (as denoted in specific experiments) with a Xenon flash lamp followed by a delay of 50 μsec. A luminescence scan between 450–650 nm was collected in 1 nm increments with 1 msec collection time and 10 readings per data point. Sensitivity (an instrument parameter similar to gain) was adjusted as necessary and is reported where relevant.
Job’s Plot
The molar fraction of the pSAStide biosensor and Tb3+ were continuously varied inversely of each other while maintaining a total molar concentration of 16 μM (i.e. 1 μM pSAStide and 15 μM Tb3+, 2 μM pSAStide with 14 μM Tb3+, …, 15 μM pSAStide and 1 μM Tb3+) for each data point. Luminescent emission spectra were collected as described above and the area under the emission spectra was used as the parameter for quantification of complex formation as luminescent increases with complex formation.
Binding Affinity
Tb3+ binding to SAStide and pSAStide was measured using Tb3+ luminescence sensitized by the central tyrosine or phosphotyrosine residue of SAStide and pSAStide respectively. Tb3+ was added to 100 nM of either peptide at final concentrations ranging from 0 to 20 μM. All experiments were carried out in 10 mM HEPES and 100 mM NaCl (pH 7.5) at a volume of 100 μL. After excitation of the samples at 266nm (pSAStide) or 280nm (SAStide), Tb3+ luminescence emission spectra between 450 to 650 nm were collected for 1 ms following a 50 μs delay and 30 readings per data point. Background luminescence emission was subtracted from the peptide in the absence of terbium. The area under each spectrum was integrated and used as the metric for quantification. The data were fit to Eq. 1 by using KaleidaGraph nonlinear curve-fitting software, where I is the Tb3+ luminescence at a given concentration, Imax corresponds to the maximum Tb3+ emission, [Tb3+]T is the total Tb3+ concentration, [P]T is the total peptide concentration and Kd is the equilibrium dissociation constant.
| (1) |
In vitro kinase assay
EGFP-conjugated Syk was isolated from DT40 chicken B cells stably expressing Syk-EGFP. Cells were lysed using a solution containing 1% Nonidet P-40, 50 mM Tris-HCl pH 8.0, 100 mM NaCl, 5 mM EDTA, 1 mM sodium orthovanadate, 2mM NaF and 1X mammalian protease inhibitor cocktail (Sigma). Syk-EGFP was immunoprecipitated using GFP-Trap_A beads (Chromotek). Lysates were incubated with the beads for 1 h at 4°C. The kinase-bound beads were washed and then used in the in vitro kinase assay (0.4 μg/μL). Syk-EGFP was incubated with the kinase reaction buffer (3.4 μg Syk-EGFP, 100 μM ATP, 10mM MgCl2, 1μM Na3VO4, leupeptin, aprotinin, 125 ng/μL BSA and 25 mM HEPES pH 7.5, total volume 170 μL) containing SAStide at 37.5 μM at 30°C. Aliquots (20 μL) were taken at designated time points (0.5, 5, 10, 15, 30, 45, 60 and 90 min) and quenched in 6 M urea (20 μL). The quenched samples were then treated with the luminescence buffer (500 μM Tb3+ and 500 mM NaCl, 10 μL) for a total volume of 50 μL (final concentrations of sample components: 2.4 M urea, 40 μM ATP, 4 mM MgCl2, 0.4 μM Na3VO4, leupeptin, aprotinin, 50 ng/μL BSA and 10 mM HEPES pH 7.5). Luminescence emission spectra were collected as described above and the area under each spectrum was integrated using GraphPad Prism. An additional aliquot (1 μL) of the kinase reaction mixture was taken at each time point for validation of phosphorylation using an ELISA-based chemifluorescent assay as previously described. (27) Briefly, each aliquot was quenched with 0.5 M EDTA and incubated in a 96-well Neutravidin coated plate (15 pmol biotin binding capacity per well, Thermo Scientific) in Tris-buffer saline (TBS) containing 0.1% BSA and 0.05% Tween 20 for 1h. Following incubation, each well was washed with the TBS buffer and the incubated with mouse anti-phosphotyrosine monoclonal antibody 4G10 (Millipore, 1:10,000 dilution in TBS buffer) for 1h. Following incubation, each well was washed with TBS buffer and incubated with horseradish peroxidase-conjugated goat anti-mouse immunoglobulin G (IgG) secondary antibody (Abcam) (1:1000 dilution) for 1h. Wells were then washed and treated with Amplex Red reaction buffer (Amplex Red reagent, Invitrogen, 20 mM H2O2 and sodium phosphate buffer) for 30 min. Fluorescence was measured using a Synergy4 multiwell plate reader (Biotek) with an excitation wavelength of 532 nm and emission wavelength of 590 nm.
Dose-Response Inhibition Assay
Syk-EGFP (0.4 μg/reaction) was incubated with the kinase reaction buffer described above before adding SAStide in the presence of DMSO (vehicle) or varying concentrations of piceatannol at 30°C for 10 min prior to the start of the reaction. The reaction was started with the addition of SAStide (37.5 μM, total reaction volume 20 μL). Each reaction was quenched after 30 min in 6 M urea (20 μL). The samples were then treated with the luminescence buffer (500 μM Tb3+ and 500 mM NaCl, 10 μL) for a total volume of 50 μL.
High-Throughput Screening Calculations
The Z′ factor was calculated according to Eq. 2.
| (2) |
And the signal window was calculated according to Eq. 3
| (3) |
Where n is the number of replicates, μpos and μneg are the average luminescence of the positive (pSAStide or uninhibited) and negative (SAStide or inhibitor treated EGFP-Syk) controls respectively; σpos and σneg are the standard deviation of the positive and negative controls.
Results and discussion
Time-resolved luminescence measurements increase signal to noise
Phosphorylated (pSAStide) and unphosphorylated (SAStide) forms of the peptide were synthesized and steady-state luminescence of each 1:1 Tb3+ complex with excitation at 266 nm through a monochromator (for highly resolved excitation energy control) was measured (Fig. 1B). The optimal excitation energy was determined to be 266 nm for pSAStide and 275 nm for SAStide and were used for characterizing each species in complex with terbium (Figure S1). At 266 nm excitation energy, pSAStide exhibited strong Tb3+ sensitization and SAStide displayed weaker luminescence. Based on this we used 266 nm for all further analyses. While SAStide signal was somewhat mitigated by using 266 nm excitation energy, there was still weak but significant luminescence from SAStide so the signal to noise (comparing pSAStide and SAStide luminescence) was low (2:1). However, time-resolved measurements significantly improved the signal to noise to 32:1 (Fig. 1C), demonstrating that taking advantage of the increase in Tb3+ luminescence lifetime in the presence of phosphotyrosine vs. unphosphorylated tyrosine improved the ability to detect phosphorylation of SAStide. The improvement in the signal to noise ratio was accomplished by allowing the short-lived signal of the unphosphorylated peptide to decay prior to collection.
Physical characterization of SAStide-lanthanide binding and luminescence
Binding studies were performed to determine the stoichiometry and affinity of pSAStide-terbium complexation. The binding stoichiometry of the highest affinity complex was established using the Jobs method of continuous variations. (29) The area under the emission spectrum was used as the metric to quantify the pSAStide-Tb3+ binding ratios. pSAStide and terbium individually displayed no detectable luminescence; therefore, any changes in luminescence could then be attributed the formation of the pSAStide-Tb3+ complex. The Jobs plot displayed an increase in total area as the mole fraction of terbium increased to 0.5 followed by a linear decrease with further increases in the mole fraction (Fig. 2A). These data indicated that the preferred binding stoichiometry of pSAStide-Tb3+ binding is 1:1.
Figure 2.
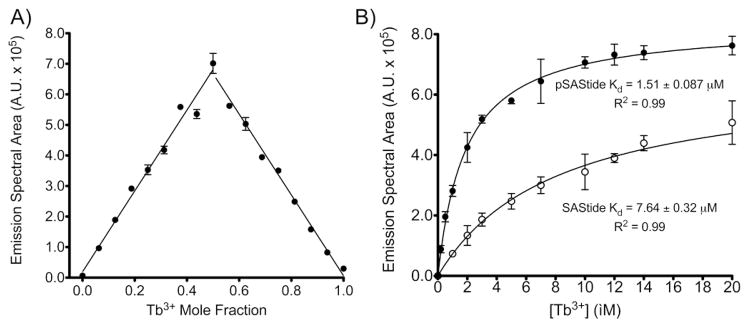
Characterization of the SAStide/Tb3+ physical interaction. A) Jobs Plot of continuous variation. The mole fraction of Tb3+ and pSAStide were inversely varied relative to each to maintain a total molar concentration of the two species at 16 μM. Luminescence spectra were collected in 10mM HEPES, λex = 266 nm, 1000ms collection time, 50 μsec delay time and sensitivity 180. Data represent averages ± SEM of experiment performed in triplicate. B) Binding affinity of SAStide-terbium complexation. Spectra were collected using 100 nM pSAStide (●) or SAStide (○) in the presence of varying concentrations of Tb3+ in 10mM HEPES, 100mM NaCl, pH 7.5, λex = 266 nm for pSAStide and λex = 275 nm for SAStide, 1000ms collection time, 50 μsec delay time and sensitivity 180. Note that the excitation wavelength used for unphosphorylated SAStide was selected for its own optimal signal sensitivity; therefore the ratio of pSAStide-terbium to SAStide-terbium signals looks less dramatic than when the 266 nm excitation is used for both complexes. Data represent averages ± SEM of experiment performed in triplicate.
Binding affinities were also determined using Tb3+ luminescence as a measure of complexation. Terbium was titrated in the presence of 100 nM pSAStide or SAStide and luminescence emission spectra were collected and integrated. The binding curves displayed a hyperbolic increase in luminescence with increasing terbium concentrations from 0–20 μM (representing a large excess of terbium), with saturation between at 20 μM characteristic of one site binding (Fig. 2B). Additional increases in luminescence, ranging up to three fold, were observed with increasing terbium concentrations (Supporting Information Figure S2), which mass spectrometry analysis suggested were likely due to complexes containing multiple terbium ions (Figure S3). However, for the remainder of this work detection of pSAStide was carried out with 6.67 equivalents of terbium relative to peptide, thus the 1:1 binding mode characterized by the initial hyperbolic increase was the most relevant to detection under conditions used subsequently for assays. The calculated Kd for the 1:1 pSAStide-terbium complex represented by the hyperbolic curve was 1.51 ± 0.087 μM, which is comparable to the affinities reported for other terbium binding peptides. (15, 20) The unphosphorylated SAStide-terbium complexation displayed significantly weaker binding; the 1:1 complex exhibited a Kd of 7.64 ± 0.32 μM (5-fold weaker than for the phosphorylated peptide). These results demonstrate that phosphorylation increased the affinity of SAStide for Tb3+. Also, since the greatest fold change in signal for pSAStide-terbium vs. SAStide-terbium was observed for the 1:1 complex, this represented the best ratio to maintain in subsequent kinase assays.
Measurements of the terbium luminescence lifetime were performed to characterize the photophysical properties of pSAStide-terbium and SAStide-terbium complexation. The hydration number (i.e. the number of water ligands (q) in the terbium coordination sphere) can be determined via the luminescence lifetime of the complex in H2O vs. D2O, since the terbium excited state is quenched by the –OH vibrational overtones of H2O but not D2O. Luminescence spectra for the pSAStide:Tb3+ and SAStide:Tb3+ complexes were collected in various ratios of H2O/D2O. The luminescence lifetimes were fitted to a single exponential decay and were determined to be 2.02 ms and 2.48 ms in H2O and D2O respectively for pSAStide:Tb3+ (Supporting Information Figure S4). These lifetimes lead to a q value of 0.12 for the phosphopeptide complex, indicating nearly an absence of H2O in the inner coordination sphere of terbium at equilibrium. The unphosphorylated SAStide:Tb3+ had a comparably shorter lifetime in H2O at 1.88 ms and a longer lifetime D2O of 2.92 ms resulting in a q value of 0.66. These data suggest the SAStide:Tb3+ contain closer to one H2O in the coordination sphere at equilibrium, resulting in more quenching of the terbium excited state, which manifested as a shorter lifetime. These differences are likely related to the greater luminescence intensity observed for the phosphorylated vs. unphosphorylated peptide, and also to the longer lifetime of the phosphopeptide that enabled gating of the signal for better dynamic range for discriminating the phosphorylated from unphosphorylated species using time-resolved signal collection.
The quantum yield for the pSAStide-terbium complex was determined using diffusion-enhanced energy transfer from the complex to fluorescein isothiocyanate (FITC). (30) Luminescence emission spectra were collected in the presence of varying concentrations of FITC with increasing delay times. The time-resolved emission spectra and corresponding lifetime plots display an increase in emission intensity and a simultaneous decrease in the lifetime with increasing concentrations of FITC, and the quantum yield calculated from these data was 0.34 (Supporting Information Figure S5).
Quantitative detection of Syk kinase activity using Tb3+ sensitization
To demonstrate the use of SAStide:Tb3+ as a biosensor for quantitative detection of Syk activity, a calibration curve was established using mixed ratios of SAStide and pSAStide in the presence of the kinase assay components and quenching buffer conditions (MgCl2, BSA, ATP, NaVO4, protease inhibitors, piceatannol, DMSO, urea) at concentrations sufficient to mimic an appropriate background matrix for a kinase assay measurement (Fig. 3A). Luminescence emission spectra were collected for the various SAStide/pSAStide ratios and the area under the curves were integrated. Controls showed limited interference from the components of the kinase assay and quenching conditions (Supporting Information Figure S6–8). The calibration curve demonstrated that the emission spectral area increased linearly and was well correlated with increasing percent phosphorylation (Fig. 3B). However, there was an increase in the basal signal in the absence of pSAStide (relative to mixtures of just peptide and simple buffers) that was likely due to complexation of terbium with ATP. The three phosphate groups of ATP can provide an appropriate coordination environment and adenosine provides the appropriate chromophore for excitation (λex=259 nm), giving rise to some background even with time-resolved measurements. Compared to detection of pSAStide vs. SAStide in HEPES buffer alone, this increase in background signal reduced the signal to noise ratio (S/N) by half (Figure 1C compared to Figure 3B). However, despite this decrease excellent S/N (15.3:1) was still achieved.
Figure 3.

Calibration and detection of phosphorylation of SAStide. A) pSAStide-Tb3+ luminescence emission spectra in the presence of the quenched Syk in vitro kinase assay buffer (2.4 M urea, 40 μM ATP, 4 mM MgCl2, 0.4 μM Na3VO4, leupeptin, aprotinin, 50 ng/μL BSA and 10 mM HEPES pH 7.5). Spectra were collected from 15 μM peptide in the presence of 100 μM Tb3+ (representing a ratio of 6.7 Tb3+:peptide, which corresponds to the saturated range for 1:1 binding) in 10mM HEPES, 100mM NaCl, pH 7.0, λex=266nm, 1000ms collection time, 50 μsec delay time and sensitivity 180. B) Emission spectral area calibration curve based on percent phosphorylation in vitro. C) in vitro Syk kinase assay luminescence emission spectra. D) Interpolated percent phosphorylation from Syk in vitro kinase assay. Data indicate averages ± SEM of experiments performed in triplicate.
The limit of detection (LOD) for phosphorylation was 3.8 ± 0.51%, defined as the percentage of pSAStide that gave a signal area corresponding to 3X the standard deviation greater than the baseline for unphosphorylated SAStide in the quenched kinase reaction buffer (the negative control). The limit of quantification (LOQ) for phosphorylation was 7.4 ± 0.52 %, defined as the percentage of pSAStide that gave a signal area 10X the standard deviation greater than the signal in the negative control. (31) We also calculated the Z′ factor and the signal window (SW) to determine if this sensor would be appropriate for use in a high throughput screening (HTS) assay. The Z′ factor should be between 0.5 and 1 for an assay to be considered appropriated for HTS, as assays with a Z′ factor in this range exhibit a large dynamic ranges and wide separation of positive and negative results. (32–33) Assays with a SW greater than 2 are also considered appropriate for HTS assays. (32–33) Both parameters were calculated from the mean emission and standard deviation of the spectral area from triplicate measurements of the negative control SAStide in the in vitro assay buffer and the positive control pSAStide in the same conditions. The Z′ factor and SW were determined to be 0.82 and 14.63, respectively, indicating that time-resolved terbium luminescence detection of SAStide phosphorylation is an appropriate method for HTS assays.
Detection of Syk activity in vitro was accomplished using Syk-EGFP immunoprecipitated from engineered DT40 chicken B-cells with the kinase reaction buffer and quenching conditions described above. After pre-incubation of the enzyme with the kinase reaction mixture, SAStide substrate was added and aliquots of the reaction were quenched at various time points in urea (to denature the enzyme). Tb3+ was added and time-resolved luminescence was measured (Fig. 3C). The areas under the emission spectra were calculated, the percent phosphorylation was interpolated from the calibration curve and plotted against time (Fig. 3D). These data show that enzymatic phosphorylation of SAStide can be detected using time-resolved Tb3+ luminescence. As a control to verify phosphorylation, an additional aliquot was used for detection of phosphorylation using an ELISA-based chemifluorescent assay (Supporting Information Figure S9).
We also examined the potential of this strategy to be used for inhibitor screening. The effect of the Syk inhibitor piceatannol (34) was assayed in a dilution series from 10 nM to 10 mM. Luminescence emission spectra were collected and integrated (Fig. 4A). The areas were normalized to the DMSO control and reported as percent activity. The observed IC50 for piceatannol was 178±1.4 μM (Fig. 4B), consistent with that found in the literature. (35) The Z′ factor and SW were determined in the context of the dose-response inhibition assay, calculated from the standard deviation and mean from the normalized percent activity from triplicate measurements of the negative control (10 μM piceatannol) and the positive controls (10 nM – 500 GM piceatannol). Over all the positive controls the Z′ factor was greater than 0.5 and the SW was greater than 2 demonstrating that the application of pSAStide:Tb3+ maintains its appropriateness as a HTS tool in practice (Supporting Information Table S2).
Figure 4.
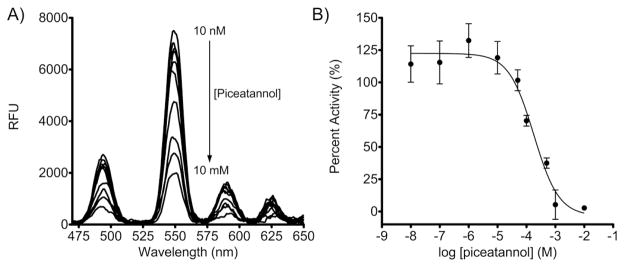
Detection of dose-dependent Syk inhibition. A) in vitro Syk kinase assay luminescence emission spectra. Spectra were collected from 15 μM peptide in the presence of 100 μM Tb3+ in the presence of the quenched kinase reaction buffer (2.4 M urea, 40 μM ATP, 4 mM MgCl2, 0.4 μM Na3VO4, leupeptin, aprotinin, 50 ng/μL BSA and 10 mM HEPES pH 7.5), λex=266nm, 1000ms collection time, 50 μsec delay time and sensitivity 180. B) Dose-response inhibition of Syk by the inhibitor piceatannol. The extent of biosensor phosphorylation was interpolated from the calibration curve and normalized to the uninhibited DMSO control. Data indicate averages ± SEM of experiments performed in triplicate.
In summary, we have demonstrated that time-resolved Tb3+ luminescence measurements substantially increase signal to noise and thus dynamic range for quantitative analysis of peptide phosphorylation. Time-resolved luminescence detection has been employed in FRET-based assays for kinase activity (e.g. the LanthaScreen® assay from Life Technologies), (36) however these assays rely on Tb3+ chelation by a macrocyclic carrier conjugated to an anti-phosphosite antibody coupled with a fluorescently labeled substrate, and Tb3+ itself is not involved in binding to the phosphorylated product of the kinase reaction—therefore the LanthaScreen® technique depends on antibody availability and is an indirect, “off-line” measure of substrate phosphorylation. Exploiting the binding and sensitization of Tb3+ directly with a phosphorylated substrate is essentially “label-free,” since neither antibodies nor fluorophore labels are required. In our studies, time-resolved measurements significantly improved the signal to noise of detection compared to steady-state measurements by minimizing background signal. The ability to discriminate between the coordination environments for Tb3+ binding to the unphosphorylated vs. phosphorylated peptides based on luminescence lifetime facilitated the improvement we observed in distinguishing between species. Accordingly, phosphorylation of the Syk substrate peptide SAStide could be applied for rapid, quantitative and sensitive detection of Syk kinase activity and inhibition by small molecule inhibitors with little to no interference from the components of the kinase reaction.
Besides the specific application to Syk kinase described here, this strategy has broad significance for detecting phosphorylation using lanthanide sensitization. Time-resolved detection should expand the possibilities for other peptide- and protein-based lanthanide sensitization approaches to achieve better dynamic range and sensitivity. This will enable us and others to leverage existing Tb3+-sensitizing substrates for other kinases, as well as open a new avenue for development of novel substrates to achieve high-throughput compatibility for other kinase targets important in therapeutic development, that otherwise may not have provided sufficient signal to noise with steady-state measurements.
Supplementary Material
Table 1.
Photophysical properties of the pSAStide-terbium and SAStide-terbium complexes.
| Peptide | λEx | τH2O | τD2O | q | φ |
|---|---|---|---|---|---|
| pSAStide | 266 | 2.02 | 2.44 | 0.12 | 0.34 |
| SAStide | 275 | 1.88 | 2.92 | 0.66 | N.D. |
λ Ex = maximum excitation wavelength; τH2O−1 = luminescence decay in the presence of H2O; τD2O−1 = luminescence decay in the presence of D2O; q = number of H2O ligands in inner coordination sphere at equilibrium; φ = quantum yield.
Acknowledgments
Funding Sources
This work was supported by the National Institutes of Health, National Cancer Institute: R25CA128770 (D. Teegarden) Cancer Prevention Internship Program (A.M.L) administered by the Oncological Sciences Center and the Discovery Learning Research Center at Purdue University; as well as a K99/R00 Pathway to Independence award (R00CA127161) and a grant from the Innovative Molecular Analysis Technologies program (R21CA160129) (L.L.P).
We thank Chiwook Park (Department of Medicinal Chemistry and Molecular Pharmacology, Purdue University) for helpful discussions on accurate measurement of the binding affinity for Tb3+ to the peptides.
ABBREVIATIONS
- Syk
spleen tyrosine kinase
- Tb3+
terbium ion
- SAStide
Syk specific artificial substrate peptide
- pSAStide
phosphorylated SAStide
- Fmoc
9-fluorenylmethoxy-carbonyl
- HCTU
2-(6-Chloro-1H-benzotriazole-1-yl)-1,1,3,3-tetramethylaminium hexafluorophosphate
- NMM
N-methylmorpholine
- DMF
dimethylformamide
- TFA
trifluoroacetic acid
- EDT
ethane dithiol
- TIS
triisopropylsilane
- HPLC
high performance liquid chromatography
- Tris
2-Amino-2-hydroxymethyl-propane-1,3-diol
- EDTA
ethylenediamine tetraacetic acid
- BSA
bovine serum albumin
- HEPES
2-[4-(2-hydroxyethyl)piperazin-1-yl]ethanesulfonic acid
- ATP
adenosine triphosphate
- EGFP
enhanced green fluorescent protein
- SEM
standard error of the mean
- FITC
fluorescein isothiocyanate
- DMSO
dimethylsulfoxide
- PBS
phosphate-buffered saline
- LOD
lower limit of detection
- LOQ
lower limit of quantitation
- SW
signal window
- HTS
high throughput screening
- ELISA
enzyme-linked immunosorbent assay
- FRET
Förster resonance energy transfer
Footnotes
Author Contributions
The manuscript was written through contributions of all authors. All authors have given approval to the final version of the manuscript.
Supporting Information. Details for determination of photophysical parameters, assay metrics, and validation of in vitro phosphorylation are given in the supporting information. This material is available free of charge via the Internet at http://pubs.acs.org.
References
- 1.Hantschel O, Warsch W, Eckelhart E, Kaupe I, Grebien F, Wagner KU, Superti-Furga G, Sexl V. BCR-ABL uncouples canonical JAK2-STAT5 signaling in chronic myeloid leukemia. Nature chemical biology. 2012;8(3):285–93. doi: 10.1038/nchembio.775. [DOI] [PubMed] [Google Scholar]
- 2.Alcolea MP, Casado P, Rodriguez-Prados JC, Vanhaesebroeck B, Cutillas PR. Phosphoproteomic analysis of leukemia cells under basal and drug-treated conditions identifies markers of kinase pathway activation and mechanisms of resistance. Mol Cell Proteomics. 2012 doi: 10.1074/mcp.M112.017483. [DOI] [PMC free article] [PubMed] [Google Scholar]
- 3.Friedberg JW, Sharman J, Sweetenham J, Johnston PB, Vose JM, Lacasce A, Schaefer-Cutillo J, De Vos S, Sinha R, Leonard JP, Cripe LD, Gregory SA, Sterba MP, Lowe AM, Levy R, Shipp MA. Inhibition of Syk with fostamatinib disodium has significant clinical activity in non-Hodgkin lymphoma and chronic lymphocytic leukemia. Blood. 2010;115(13):2578–2585. doi: 10.1182/blood-2009-08-236471. [DOI] [PMC free article] [PubMed] [Google Scholar]
- 4.Mahadevan D, Fisher RI. Novel therapeutics for aggressive non-Hodgkin’s lymphoma. J Clin Oncol. 2011;29(14):1876–84. doi: 10.1200/JCO.2010.32.7171. [DOI] [PMC free article] [PubMed] [Google Scholar]
- 5.Coffey G, DeGuzman F, Inagaki M, Pak Y, Delaney SM, Ives D, Betz A, Jia ZJ, Pandey A, Baker D, Hollenbach SJ, Phillips DR, Sinha U. Specific inhibition of spleen tyrosine kinase suppresses leukocyte immune function and inflammation in animal models of rheumatoid arthritis. The Journal of pharmacology and experimental therapeutics. 2012;340(2):350–359. doi: 10.1124/jpet.111.188441. [DOI] [PubMed] [Google Scholar]
- 6.Davis MI, Hunt JP, Herrgard S, Ciceri P, Wodicka LM, Pallares G, Hocker M, Treiber DK, Zarrinkar PP. Comprehensive analysis of kinase inhibitor selectivity. Nat Biotechnol. 2011;29(11):1046–1051. doi: 10.1038/nbt.1990. [DOI] [PubMed] [Google Scholar]
- 7.Hoellenriegel J, Coffey GP, Sinha U, Pandey A, Sivina M, Ferrajoli A, Ravandi F, Wierda WG, O’Brien S, Keating MJ, Burger JA. Selective, novel spleen tyrosine kinase (Syk) inhibitors suppress chronic lymphocytic leukemia B-cell activation and migration. Leukemia. 2012 doi: 10.1038/leu.2012.24. [DOI] [PMC free article] [PubMed] [Google Scholar]
- 8.Kubota K, Anjum R, Yu Y, Kunz RC, Andersen JN, Kraus M, Keilhack H, Nagashima K, Krauss S, Paweletz C, Hendrickson RC, Feldman AS, Wu CL, Rush J, Villen J, Gygi SP. Sensitive multiplexed analysis of kinase activities and activity-based kinase identification. Nat Biotechnol. 2009;27(10):933–40. doi: 10.1038/nbt.1566. [DOI] [PMC free article] [PubMed] [Google Scholar]
- 9.Sims CE, Allbritton NL. Single-cell kinase assays: opening a window onto cell behavior. Curr Opin Biotechnol. 2003;14(1):23–8. doi: 10.1016/s0958-1669(02)00002-2. [DOI] [PubMed] [Google Scholar]
- 10.Placzek EA, Plebanek MP, Lipchik AM, Kidd SR, Parker LL. A peptide biosensor for detecting intracellular Abl kinase activity using matrix-assisted laser desorption/ionization time-of-flight mass spectrometry. Anal Biochem. 2010;397(1):73–78. doi: 10.1016/j.ab.2009.09.048. [DOI] [PMC free article] [PubMed] [Google Scholar]
- 11.Tang J, Wang JY, Parker LL. Detection of early Abl kinase activation after ionizing radiation by using a peptide biosensor. Chembiochem. 2012;13(5):665–73. doi: 10.1002/cbic.201100763. [DOI] [PMC free article] [PubMed] [Google Scholar]
- 12.Lukovic E, Gonzalez-Vera JA, Imperiali B. Recognition-domain focused chemosensors: versatile and efficient reporters of protein kinase activity. J Am Chem Soc. 2008;130(38):12821–7. doi: 10.1021/ja8046188. [DOI] [PMC free article] [PubMed] [Google Scholar]
- 13.Tremblay MS, Lee M, Sames D. A luminescent sensor for tyrosine phosphorylation. Org Lett. 2008;10(1):5–8. doi: 10.1021/ol701920x. [DOI] [PubMed] [Google Scholar]
- 14.Bunzli JC. Lanthanide luminescence for biomedical analyses and imaging. Chem Rev. 2010;110(5):2729–55. doi: 10.1021/cr900362e. [DOI] [PubMed] [Google Scholar]
- 15.Nitz M, Franz KJ, Maglathlin RL, Imperiali B. A powerful combinatorial screen to identify high-affinity terbium(III)-binding peptides. Chembiochem. 2003;4(4):272–6. doi: 10.1002/cbic.200390047. [DOI] [PubMed] [Google Scholar]
- 16.Bruce JI, Dickins RS, Govenlock LJ, Gunnlaugsson T, Lopinski S, Lowe MP, Parker D, Peacock RD, Perry JJB, Aime S, Botta M. The selectivity of reversible oxy-anion binding in aqueous solution at a chiral europium and terbium center: Signaling of carbonate chelation by changes in the form and circular polarization of luminescence emission. J Am Chem Soc. 2000;122(40):9674–9684. [Google Scholar]
- 17.Richardson FS. Terbium(Iii) and Europium(Iii) Ions as Luminescent Probes and Stains for Biomolecular Systems. Chemical reviews. 1982;82(5):541–552. [Google Scholar]
- 18.Akiba H, Sumaoka J, Komiyama M. Binuclear terbium(III) complex as a probe for tyrosine phosphorylation. Chemistry. 2010;16(17):5018–25. doi: 10.1002/chem.200903379. [DOI] [PubMed] [Google Scholar]
- 19.Liu LL, Franz KJ. Phosphorylation-dependent metal binding by alpha-synuclein peptide fragments. J Biol Inorg Chem. 2007;12(2):234–47. doi: 10.1007/s00775-006-0181-y. [DOI] [PubMed] [Google Scholar]
- 20.Liu LL, Franz KJ. Phosphorylation of an alpha-synuclein peptide fragment enhances metal binding. J Am Chem Soc. 2005;127(27):9662–3. doi: 10.1021/ja043247v. [DOI] [PubMed] [Google Scholar]
- 21.Balakrishnan S, Zondlo NJ. Design of a protein kinase-inducible domain. Journal Of The American Chemical Society. 2006;128(17):5590–5591. doi: 10.1021/ja057692h. [DOI] [PubMed] [Google Scholar]
- 22.Zondlo SC, Gao F, Zondlo NJ. Design of an encodable tyrosine kinase-inducible domain: detection of tyrosine kinase activity by terbium luminescence. J Am Chem Soc. 2010;132(16):5619–21. doi: 10.1021/ja100862u. [DOI] [PubMed] [Google Scholar]
- 23.Pazos E, Golicnik M, Mascarenas JL, Eugenio Vazquez M. Detection of phosphorylation states by intermolecular sensitization of lanthanide-peptide conjugates. Chem Commun (Camb) 2012;48(76):9534–6. doi: 10.1039/c2cc34958b. [DOI] [PubMed] [Google Scholar]
- 24.Atkinson P, Murray BS, Parker D. A cationic lanthanide complex binds selectively to phosphorylated tyrosine sites, aiding NMR analysis of the phosphorylated insulin receptor peptide fragment. Organic & biomolecular chemistry. 2006;4(16):3166–71. doi: 10.1039/b608528h. [DOI] [PubMed] [Google Scholar]
- 25.Tremblay MS, Zhu Q, Marti AA, Dyer J, Halim M, Jockusch S, Turro NJ, Sames D. Phosphorylation state-responsive lanthanide peptide conjugates: a luminescence switch based on reversible complex reorganization. Org Lett. 2006;8(13):2723–6. doi: 10.1021/ol060614u. [DOI] [PubMed] [Google Scholar]
- 26.Balakrishnan S, Zondlo NJ. Design of a protein kinase-inducible domain. Journal of the American Chemical Society. 2006;128(17):5590–1. doi: 10.1021/ja057692h. [DOI] [PubMed] [Google Scholar]
- 27.Lipchik AM, Killins RL, Geahlen RL, Parker LL. A Peptide-Based Biosensor Assay To Detect Intracellular Syk Kinase Activation and Inhibition. Biochemistry. 2012;51(38):7515–7524. doi: 10.1021/bi300970h. [DOI] [PMC free article] [PubMed] [Google Scholar]
- 28.Cline Love LJ, Shaver LA. Time correlated single photon technique: Fluorescence lifetime measurements. Analytical Chemistry. 1976;48:364–371. [Google Scholar]
- 29.Huang CY. Determination of binding stoichiometry by the continuous variation method: the Job plot. Methods Enzymol. 1982;87:509–25. doi: 10.1016/s0076-6879(82)87029-8. [DOI] [PubMed] [Google Scholar]
- 30.Xiao M, Selvin PR. Quantum yields of luminescent lanthanide chelates and far-red dyes measured by resonance energy transfer. J Am Chem Soc. 2001;123(29):7067–73. doi: 10.1021/ja0031669. [DOI] [PubMed] [Google Scholar]
- 31.Armbruster DA, Pry T. Limit of blank, limit of detection and limit of quantitation. The Clinical biochemist Reviews / Australian Association of Clinical Biochemists. 2008;29(Suppl 1):S49–52. [PMC free article] [PubMed] [Google Scholar]
- 32.Zhang JH, Chung TD, Oldenburg KR. A Simple Statistical Parameter for Use in Evaluation and Validation of High Throughput Screening Assays. Journal of biomolecular screening. 1999;4(2):67–73. doi: 10.1177/108705719900400206. [DOI] [PubMed] [Google Scholar]
- 33.Iversen P, Beck B, Chen YF, Dere W, Devanarayan V, Eastwood BJ, Farmen MW, Iturria SJ, Iversen PW, Montrose C, Moore RA, Weidner JR. HTS Assay Validation. In: Sittampalam GS, Weidner J, Auld D, Glicksman M, Arkin M, Napper A, Inglese J, editors. Assay Guidance Manual. Bethesda (MD): 2004. [Google Scholar]
- 34.Geahlen RL, McLaughlin JL. Piceatannol (3,4,3′,5′-tetrahydroxy-trans-stilbene) is a naturally occurring protein-tyrosine kinase inhibitor. Biochem Biophys Res Commun. 1989;165(1):241–245. doi: 10.1016/0006-291x(89)91060-7. [DOI] [PubMed] [Google Scholar]
- 35.Oliver JM, Burg DL, Wilson BS, McLaughlin JL, Geahlen RL. Inhibition of mast cell Fc epsilon R1-mediated signaling and effector function by the Syk-selective inhibitor, piceatannol. J Biol Chem. 1994;269(47):29697–703. [PubMed] [Google Scholar]
- 36.Kupcho KR, Bruinsma R, Hallis TM, Lasky DA, Somberg RL, Turek-Etienne T, Vogel KW, Huwiler KG. Fluorescent cascade and direct assays for characterization of RAF signaling pathway inhibitors. Current chemical genomics. 2008;1:43–53. doi: 10.2174/1875397300801010043. [DOI] [PMC free article] [PubMed] [Google Scholar]
Associated Data
This section collects any data citations, data availability statements, or supplementary materials included in this article.