

Abstract
Background
Circulating concentrations of 25-hydroxyvitamin D [25-(OH)D] are used to define vitamin D deficiency. Current clinical 25-(OH)D targets based on associations with intermediate markers of bone metabolism may not reflect optimal levels for other chronic diseases and do not account for known seasonal variation in 25-(OH)D concentration.
Objective
To evaluate the relationship of 25-(OH)D concentration with the incidence of major clinical disease events that are pathophysiologically relevant to vitamin D.
Design
Cohort study.
Setting
The Cardiovascular Health Study conducted in 4 U.S. communities. Data from 1992 to 2006 were included in this analysis.
Participants
1621 white older adults.
Measurements
Serum 25-(OH)D concentration (using a high-performance liquid chromatography–tandem mass spectrometry assay that conforms to National Institute of Standards and Technology reference standards) and associations with time to a composite outcome of incident hip fracture, myocardial infarction, cancer, or death.
Results
Over a median 11-year follow-up, the composite outcome occurred in 1018 participants (63%). Defining events included 137 hip fractures, 186 myocardial infarctions, 335 incidences of cancer, and 360 deaths. The association of low 25-(OH)D concentration with risk for the composite outcome varied by season (P = 0.057). A concentration lower than a season-specific Z score of −0.54 best discriminated risk for the composite outcome and was associated with a 24% higher risk in adjusted analyses (95% CI, 9% to 42%). Corresponding season-specific 25-(OH)D concentrations were 43, 50, 61, and 55 nmol/L (17, 20, 24, and 22 ng/mL) in winter, spring, summer, and autumn, respectively.
Limitation
The observational study was restricted to white participants.
Conclusion
Threshold concentrations of 25-(OH)D associated with increased risk for relevant clinical disease events center near 50 nmol/L (20 ng/mL). Season-specific targets for 25-(OH)D concentration may be more appropriate than static targets when evaluating health risk.
Primary Funding Source
National Institutes of Health.
Vitamin D has attracted increasing attention in clinical medicine and research, in part because of its pleiotropic effects on biological processes other than calcium and bone homeostasis (1–3). Animal experimental studies demonstrate that 1,25-dihydroxyvitamin D, the active vitamin D hormone, suppresses the renin–angiotensin–aldosterone system, modulates immune cell function, and suppresses abnormal cell proliferation (4). Epidemiologic studies suggest that these actions may have clinical relevance, demonstrating that, in addition to fracture, vitamin D deficiency is associated with increased risks for coronary heart disease, cancer, and all-cause mortality (5–11).
Circulating concentrations of 25-hydroxyvitamin D [25-(OH)D], which reflect total vitamin D intake from cutaneous synthesis and dietary consumption, are used to define vitamin D deficiency (1–3). Biological 25-(OH)D thresholds below which adequate conversion to 1,25-dihydroxyvitamin D cannot be maintained may exist.
Optimal concentrations of 25-(OH)D have been proposed on the basis of cross-sectional correlations with intermediate measures of bone and mineral metabolism, such as parathyroid hormone concentration, bone mineral density, and intestinal calcium absorption (1, 12–15). This approach relates biomarker levels to biological function, an important strength, but it also has several limitations. First, 25-(OH)D concentrations that are optimal for bone and mineral metabolism may not equal those for nonbone vitamin D activities. Second, current recommendations for target 25-(OH)D concentrations do not account for known seasonal variation in 25-(OH)D concentration (16–19). Third, existing recommendations are based on divergent 25-(OH)D assays, and Standard Reference Materials released by the National Institute of Standards and Technology (NIST) now permit reproducible 25-(OH)D testing to enhance external validity (20). In addition, 25-(OH)D targets are highly controversial—the Institute of Medicine (IOM) recently recommended a threshold of 50 nmol/L (20 ng/mL), substantially less than the 75-nmol/L (30-ng/mL) threshold recommended by other professional societies and expert panels (1, 12–15).
The goal of this study was to examine the relationship of serum 25-(OH)D concentration to vitamin D in terms of risk for major clinical disease events of global pathophysiologic relevance, focusing on threshold concentrations associated with disease risk.
Methods
Study Population
The CHS (Cardiovascular Health Study) is a prospective, community-based cohort study designed to examine risk factors for the development and progression of cardiovascular disease in people aged 65 years or older (21). Participants were recruited from 4 U.S. communities: Forsyth County, North Carolina; Sacramento County, California; Washington County, Maryland; and Pittsburgh, Pennsylvania. Eligible participants were sampled by using Medicare eligibility lists, were not institutionalized, and were expected to remain in the area for at least 3 years. Persons who were wheelchair-bound in the home or receiving hospice treatment, radiation therapy, or chemotherapy were excluded. The original CHS cohort of 5201 participants was enrolled between 1989 and 1990, with an additional 687 predominantly black participants enrolled between 1992 and 1993.
We measured serum 25-(OH)D concentration at the 1992–1993 study visit for 2312 CHS participants who had no clinical evidence of cardiovascular disease at that time and who had available frozen serum (11). To expand our focus to incident cancer and hip fracture for this study, we additionally excluded 328 participants with a history of cancer and 13 participants with a previous hip fracture. We also excluded 45 participants with missing data on smoking and physical activity (Supplement 1, available at www.annals.org). Because 25-(OH)D concentrations and possibly their associations with health outcomes vary by race, we focused on the 1621 white persons meeting these criteria.
25-(OH)D Concentration
Fasting serum was collected from CHS participants at the 1992–1993 study visit and stored at −70 °C. We measured total 25-(OH)D [25-(OH)D2 and 25-(OH)D3] by using high-performance liquid chromatography–tandem mass spectrometry on a Waters Quattro micro mass spectrometer (Waters Corporation, Milford, Massachusetts) in 2008. The interassay coefficient of variation was less than 3.4%. The assay was validated by using NIST Standard Reference Material 972 (accuracy within 5%) (20). 25-Hydroxyvitamin D is known to be stable for long periods at −70 °C (22).
Composite Clinical Outcome
The primary study outcome was time to first occurrence of incident hip fracture, incident myocardial infarction (MI), incident cancer, or death from any cause. This composite outcome was chosen before analysis to capture previously described associations of 25-(OH)D with disease outcomes. We defined hip fracture by the International Classification of Diseases, Ninth Revision, codes 820.xx without a concomitant code for motor vehicle accident (E810–E819) or pathologic fracture (733.1x) (6). The CHS Events Committee adjudicated cases of MI by using available hospital discharge summaries, diagnostic test records, and consultation reports (23). Investigators for the CHS identified incident cancer cases by linking CHS records with population-based cancer registries serving the 4 CHS regions (24). We omitted outcomes that may be causally related to low 25-(OH)D concentration but have a diagnosis that is imprecisely ascertained or is made largely on the basis of physical measurements, such as diabetes, hypertension, and impaired muscle function. We defined time to composite outcome as the time elapsed between the 1992–1993 examination, when serum 25-(OH)D concentrations were measured (baseline), and either the earliest event or the end of follow-up for cancer ascertainment (31 December 2005 for the California, Pennsylvania, and North Carolina sites, and 31 December 2006 for the Maryland site).
Covariates
Covariates were ascertained at the 1992–1993 CHS study visit and were selected on the basis of their suspected confounding influence on associations of 25-(OH)D with study outcomes. Total physical activity was estimated by using the Minnesota Leisure Time Physical Activity Questionnaire, which assesses a range of common activities, such as walking for exercise, jogging, biking, aerobics, golf, tennis, swimming, weight training, mowing the lawn, strenuous household chores, and use of a treadmill or aerobic machine (25, 26). Current smoking was ascertained by questionnaire. Time of blood collection was categorized in 3-month blocks to reflect the 4 seasons and the observed pattern of seasonal variation in 25-(OH)D concentration in our population.
Statistical Analysis
We tested associations of 25-(OH)D concentration with study outcomes by using Cox proportional hazards models with robust SEs, adjusted for age, sex, clinical site, smoking (current or not current), body mass index (in categories), and physical activity (kilocalories per week in categories). This set of covariates was chosen before analysis to include important demographic characteristics and potential strong confounders while also maintaining a relatively parsimonious model. We censored participants at the time of death in analyses of nonfatal outcomes.
We evaluated 25-(OH)D as a dichotomous variable to address the clinical utility of a 25-(OH)D threshold for risk assessment and because we and others have seen threshold associations of 25-(OH)D concentration with risks for fracture, MI, and death (6–10). Given known seasonal variability in 25-(OH)D concentration (16–19) and its associated effect on modeling (27), we planned before analysis to assess the effect of season on the relationship of 25-(OH)D concentration and the composite outcome. We compared nested models with and without interaction terms for 25-(OH)D concentration by season by using a multivariate Wald test. When we saw significant heterogeneity, we examined season-specific 25-(OH)D concentrations as exposures. This approach has been applied previously and reduces bias (27, 28).
To describe the functional form of the association of 25-(OH)D concentration with the composite outcome, we first calculated unadjusted incidence rates by season-specific decile of 25-(OH)D concentration. Second, we created an adjusted penalized spline model with season-specific 25-(OH)D Z score as the flexibly modeled exposure variable and graphically displayed the spline at the mean values of adjustment covariates (29). The penalized spline was computed by using the default algorithm of the survival package in R 2.12.1 (R Foundation for Statistical Computing, Vienna, Austria), which uses evenly spaced knots, cubic polynomials, and a penalty to restrict the overall flexibility of the fitted curve (30). Third, we used a simple statistical approach similar to the Contal–O’Quigley method to estimate an “optimal” season-specific 25-(OH)D Z score cut-point (31). For each possible threshold from the inner 90% of the season-specific 25-(OH)D Z score distribution (0.01 unit increments), we computed the Wald statistic with robust SE to describe the strength of the adjusted association between 25-(OH)D deficiency (using that candidate cut-point) and rates of the composite outcome. The Z score cut-point that produced the largest Wald statistic was defined as “optimal” in the sense that it best discriminated between low- and high-risk participants with these statistical criteria. We quantified the uncertainty in our estimated optimal threshold by computing approximate CIs based on the observed quantiles of the distribution of estimates across 2000 nonparametric bootstrap samples (32). Because an optimal cut-point with high statistical precision is difficult to estimate, we present both standard 95% CIs and the narrower 75% CIs. We computed net reclassification improvement to assess whether season-specific 25-(OH)D concentration improved prediction of the primary composite outcome (cumulative incidence at 10 years, through which follow-up was 100% complete) compared with static 25-(OH)D concentration (50 nmol/L [20 ng/mL] regardless of season) (33).
All P values are 2-sided. Statistical analyses were completed using R 2.12.1 and STATA 10.1 (Stata Corp, College Station, Texas).
Role of the Funding Source
The National Institutes of Health provided funding for this study. The funding source had no role in the design, conduct, or analysis of this study or the decision to submit the manuscript for publication.
Results
Baseline Characteristics
Baseline 25-(OH)D concentration varied strongly by season (Figure 1). It was lowest in January through March (“winter”), highest in July through September (“summer”), and intermediate in April through June (“spring”) and October through December (“autumn”). Low season-specific 25-(OH)D concentration, defined as less than the season-specific 29th percentile, was more common among women and participants at more northerly study sites and was associated with higher body mass index, hypertension, reduced physical activity, and higher circulating concentrations of parathyroid hormone (Table 1).
Figure 1. Box plot of 25-(OH)D concentration by season, showing the 25th, 50th, and 75th percentiles of distributions, with outliers not shown.

Mean 25-(OH)D was 56 nmol/L (SD, 24), 63 nmol/L (SD, 24), 74 nmol/L (SD, 25), and 69 nmol/L (SD, 26) (22 ng/mL [SD, 10], 25 ng/mL [SD, 10], 30 ng/mL [SD, 10], and 28 ng/mL [SD, 11]) in winter (January–March), spring (April–June), summer (July–September), and autumn (October–December), respectively. 25-(OH)D = 25-hydroxyvitamin D.
Table 1.
Characteristics of Participants in 1992 to 1993*
| Characteristic | Overall (n = 1621) | Normal 25-(OH)D (n = 1126) | Low 25-(OH)D (n = 495)† |
|---|---|---|---|
| Demographic data | |||
| Age, y | 74.0 (4.6) | 73.7 (4.5) | 74.5 (4.7) |
| Men | 491 (30) | 406 (36) | 85 (17) |
| Site | |||
| Forsythe County, North Carolina | 450 (28) | 330 (29) | 120 (24) |
| Sacramento County, California | 370 (23) | 277 (25) | 93 (19) |
| Washington County, Maryland | 457 (28) | 295 (26) | 162 (33) |
| Pittsburgh, Pennsylvania | 344 (21) | 224 (20) | 120 (24) |
| Medical history and lifestyle | |||
| Diabetes‡ | 162 (10) | 90 (8) | 72 (15) |
| Hypertension‡ | 906 (56) | 609 (54) | 297 (60) |
| Current smoking | 151 (9) | 93 (8) | 58 (12) |
| Current alcohol use | 740 (46) | 521 (46) | 219 (44) |
| Physical activity category | |||
| <500 kcal/wk | 453 (28) | 261 (23) | 192 (39) |
| 500–1000 kcal/wk | 329 (20) | 214 (19) | 115 (23) |
| 1000–2000 kcal/wk | 393 (24) | 298 (26) | 95 (19) |
| >2000 kcal/wk | 446 (28) | 353 (31) | 93 (19) |
| Physical examination | |||
| BMI category | |||
| <25 kg/m2 | 664 (41) | 484 (43) | 180 (36) |
| 25–30 kg/m2 | 660 (41) | 466 (41) | 194 (39) |
| 30–35 kg/m2 | 229 (14) | 143 (13) | 86 (17) |
| >35 kg/m2 | 68 (4) | 33 (3) | 35 (7) |
| Laboratory data | |||
| Estimated GFR, mL/min per 1.73 m2‡ | 75.3 (17.8) | 75.9 (17.7) | 74.0 (17.8) |
| Parathyroid hormone, ng/L | 54.7 (27.3) | 50.9 (25.4) | 63.1 (31.1) |
| Bone alkaline phosphate, μg/L | 14.6 (6.9) | 14.1 (6.7) | 15.8 (7.1) |
| Calcium | |||
| mg/dL | 9.5 (0.4) | 9.5 (0.4) | 9.5 (0.4) |
| mmol/L | 2.4 (0.1) | 2.4 (0.1) | 2.4 (0.1) |
| Phosphate, mmol/L | 1.2 (0.2) | 1.2 (0.2) | 1.2 (0.2) |
| Total 25-(OH)D | |||
| nmol/L | 66.2 (25.8) | 77.8 (21.5) | 39.8 (11.1) |
| ng/mL | 26.5 (10.3) | 31.2 (8.6) | 15.9 (4.5) |
25-(OH)D = 25-hydroxyvitamin D; BMI = body mass index; GFR = glomerular filtration rate.
Values are means (SDs) for continuous variables or numbers (percentages) for categorical variables.
Defined as less than the lowest season-specific 29th percentile (43, 50, 61, and 55 nmol/L [17, 20, 24, and 22 ng/mL] in winter, spring, summer, and fall, respectively).
Diabetes was defined as use of insulin or oral hypoglycemic agents or fasting blood glucose level ≥6.99 mmol/L (≥126 mg/dL). Hypertension was defined as systolic blood pressure ≥140 mm Hg, diastolic blood pressure ≥90 mm Hg, or use of an antihypertensive medication. Serum cystatin C was measured by using a BNII nephelometer (N Latex Cystatin C; Dade Behring, Deerfield, Illinois) and used to estimate GFR with the following equation: GFR = 76.7 × [cystatin C]−1.18.
Events
Median follow-up for the 1621 participants was 11 years (interquartile range, 6 to 13 years). The composite clinical outcome occurred in 1018 participants (63%) (Supplement 2, available at www.annals.org). The qualifying event was hip fracture for 137 participants (8%), MI for 186 participants (11%), cancer for 335 participants (21%), and death for 360 participants (22%). Qualifying events are tabulated by cause in Supplement 3 available at www.annals.org).
Associations of 25-(OH)D With Events
We first evaluated the association of 25-(OH)D with the composite outcome by using the previously published 25-(OH)D threshold of 50 nmol/L (20 ng/mL) (1, 3). Using this approach, we saw borderline statistical evidence of heterogeneity by season (P = 0.057). Deviations from strong associations occurred in winter and summer, the extremes of seasonal variation in 25-(OH)D (Supplement 4, available at www.annals.org).
We next evaluated the associations of 25-(OH)D with the composite outcome by season. Participants in the lowest 2 to 3 deciles of 25-(OH)D concentration (lowest 20% to 30%) tended to have increased risk for the composite clinical outcome, compared with those in the highest 7 to 8 deciles (Supplement 5, available at www.annals.org). Evaluation of a season-based 25-(OH)D Z score similarly suggested that elevated risk for the composite outcome was greatest below a Z score of approximately −0.5 (near 30% of the normal distribution) (Figure 2).
Figure 2. Association of season-specific 25-(OH)D Z score with the risk for incident myocardial infarction, cancer, hip fracture, or death (composite outcome) among 1621 participants in the Cardiovascular Health Study, evaluated using a penalized spline.
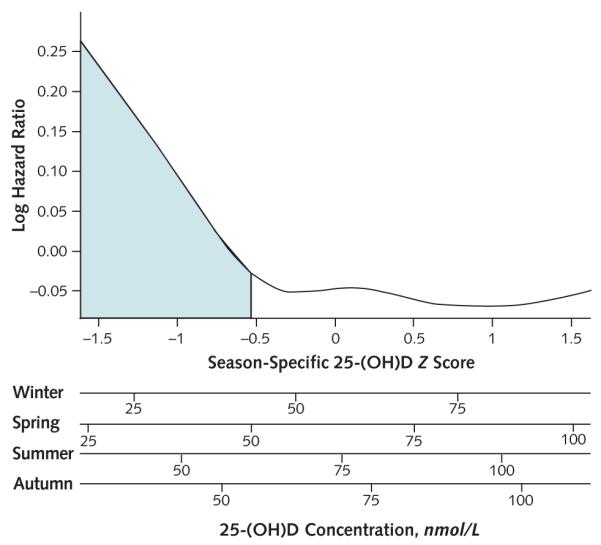
Proportional hazards model adjusts for age, sex, clinical site, body mass index, physical activity, and smoking. The shaded area represents Z score less than −0.54 (29th percentile of the normal distribution), which best discriminated risk for the composite outcome. The x-axis is displayed as season-specific Z score (uppermost x-axis, reflecting the primary method of analysis) and as corresponding season-specific absolute 25-(OH)D concentrations (lower 4 axes). 25-(OH)D = 25-hydroxyvitamin D.
Based on a simple statistical approach, the season-specific 25-(OH)D Z score that best separated low- and high-risk 25-(OH)D groups with respect to the composite outcome was −0.54 (29th percentile of the normal distribution). This threshold corresponded to season-specific cut-points of 43, 50, 61, and 55 nmol/L (17, 20, 24, and 22 ng/mL) under the normal approximation to the distribution of 25-(OH)D concentration for winter, spring, summer, and autumn, respectively (mean threshold of 52 nmol/L [21 ng/mL]). The observed season-specific distributions of 25-(OH)D concentrations in this population, although slightly right-skewed, suggested that the normal approximation was reasonable. A 25-(OH)D concentration below the season-specific 29th percentile was associated with a 24% increased risk for the composite outcome in the adjusted model (95% CI, 9% to 42%) and with similarly increased risks for each component of the composite outcome (Table 2).
Table 2.
Associations of Low Season-Specific 25-(OH)D Concentration With Rates of the Composite Outcome of MI, Cancer, Hip Fracture, or Death Among Participants
| Outcome | Events (Incidence Rate), n* |
Hazard Ratio (95% CI)† |
|
|---|---|---|---|
| Normal 25-(OH)D |
Low 25-(OH)D‡ |
||
| Composite | 681 (6.4) | 337 (7.7) | 1.24 (1.09–1.42) |
| MI | 154 (1.2) | 67 (1.3) | 1.24 (0.91–1.70) |
| Cancer | 259 (2.3) | 111 (2.3) | 1.13 (0.90–1.42) |
| Hip fracture | 118 (0.9) | 72 (1.4) | 1.34 (0.97–1.84) |
| Death | 539 (4.0) | 287 (5.3) | 1.32 (1.14–1.53) |
25-(OH)D = 25-hydroxyvitamin D; MI = myocardial infarction.
Participants may be included in more than 1 event category, but only the first event for each participant was used in analysis of the composite outcome. Incidence rates are unadjusted event rates per 100 person-years of follow-up.
Adjusted for age, sex, clinical site, smoking, body mass index, and physical activity.
Defined as less than the lowest season-specific 29th percentile (43, 50, 61, and 55 nmol/L [17, 20, 24, and 22 ng/mL] in winter, spring, summer, and autumn, respectively).
We did several analyses to evaluate whether the identified optimal threshold was robust. Statistical significance of the association of low season-specific 25-(OH)D concentration with risk for the composite outcomes decreased markedly when a threshold Z score above −0.44 was used; this corresponds to season-specific cut-points of 45, 52, 63, and 57 nmol/L (18, 21, 24, and 23 ng/mL) for winter, spring, summer, and autumn, respectively (mean threshold of 54 nmol/L [22 ng/mL]) (Supplement 6, available at www.annals.org). In bootstrap analyses, 95% of optimal 25-(OH)D Z score thresholds fell between −1.48 and 0.13 (mean season-specific thresholds of 29 and 69 nmol/L [12 and 28 ng/mL], respectively), whereas 75% fell between −1.38 and −0.40 (mean thresholds of 31 and 55 nmol/L [12 and 22 ng/mL], respectively).
Reclassification
Nine percent of participants were reclassified comparing low 25-(OH)D concentration defined by season-specific thresholds (29th percentile) versus the static threshold of 50 nmol/L (20 ng/mL) (Table 3). When low season-specific 25-(OH)D concentration was compared with a concentration less than 50 nmol/L (20 ng/mL), net reclassification improvement was 2.4% (95% CI, −0.6% to 5.3%; P = 0.118).
Table 3.
Classification of 10-Year Risk for Composite Outcome of MI, Cancer, Hip Fracture, or Death Among Participants
| Static 25-(OH)D* | Season-Specific 25-(OH)D |
||
|---|---|---|---|
| Normal, n (%) |
Low, n (%)† |
Total, n |
|
| Participants who have an event | |||
| ≥50 nmol/L (≥20 ng/mL) | 484 (90) | 55 (10) | 539 |
| <50 nmol/L (<20 ng/mL) | 18 (8) | 199 (92) | 217 |
| Total | 502 | 254 | 756 |
| Participants who do not have an event | |||
| ≥50 nmol/L (≥20 ng/mL) | 598 (93) | 48 (7) | 646 |
| <50 nmol/L (<20 ng/mL) | 26 (12) | 193 (88) | 219 |
| Total | 624 | 241 | 865 |
25-(OH)D = 25-hydroxyvitamin D.
Year-long static threshold of 50 nmol/L (20 ng/mL).
Defined as less than the lowest season-specific 29th percentile (43, 50, 61, and 55 nmol/L [17, 20, 24, and 22 ng/mL] in winter, spring, summer, and autumn, respectively).
Discussion
We characterized associations of NIST-verified serum 25-(OH)D concentration with risk for adverse clinical events that are pathophysiologically relevant to pleiotropic vitamin D actions in a community-based population. The association of 25-(OH)D with a composite clinical outcome of hip fracture, MI, cancer, and death varied by season, supporting use of season-specific 25-(OH)D thresholds. In our study population, threshold 25-(OH)D concentrations optimally associated with risk for the composite outcome were 43 nmol/L (17 ng/mL) in winter months, 50 nmol/L (20 ng/mL) in spring months, 61 nmol/L (24 ng/mL) in summer months, and 55 nmol/L (22 ng/mL) in autumn months.
The IOM recently evaluated the clinical application of 25-(OH)D testing in the context of vitamin D supplementation (1). In reviewing available data, it concluded that inadequate vitamin D can contribute to bone disease, vitamin D supplementation can decrease risk for bone disease in at-risk populations, and 25-(OH)D concentration less than 50 nmol/L (20 ng/mL) identifies persons at increased risk. The proposed threshold of 50 nmol/L (20 ng/mL) was lower than that of 75 nmol/L (30 ng/mL) recommended by many professional societies and vitamin D researchers (12–15). The IOM noted a lack of high-quality data about the effects of vitamin D supplementation on risk for nonbone health outcomes, including MI, cancer, and death, and it did not, therefore, base its estimate of target 25-(OH)D concentration on these outcomes. These findings were echoed in an updated clinical practice summary on vitamin D deficiency (3).
In comparison with existing literature and recommendations, we have 2 principal findings. First, 25-(OH)D thresholds associated with risk for diverse major clinical disease events in our work center close to the 50 nmol/L (20 ng/mL) recommended by the IOM for bone health. We agree with the IOM’s conclusions that high-quality intervention studies are needed to test whether vitamin D deficiency is causally related to nonbone outcomes in humans. Until these data are available, the finding of a similar 25-(OH)D threshold for risk for major clinical disease events to that recommended by the IOM for bone health is reassuring and supports generally targeting 50 nmol/L (20 ng/mL) over 75 nmol/L (30 ng/mL) when 25-(OH)D testing is clinically indicated.
In our study, 30.5% of participants had a 25-(OH)D concentration less than the season-specific threshold centered near 50 nmol/L (20 ng/mL). This proportion is congruent with the prevalence of 25-(OH)D concentrations less than 50 nmol/L (20 ng/mL) in other populations and emphasizes the large number of people at risk for potential complications of low 25-(OH)D concentration (34). However, the distinction between 50 and 75 nmol/L (20 and 30 ng/mL) is important because more than 40% of the U.S. population has concentrations between 50 and 75 nmol/L (20 and 30 ng/mL) (34). Our estimate of the 25-(OH)D threshold that best discriminates risk for clinical disease events was generated with some statistical uncertainty, but a threshold as high as 75 nmol/L (30 ng/mL) was unlikely to be congruent with our data.
Second, our data suggest that season-specific targets are most appropriate for 25-(OH)D concentration. Variation in 25-(OH)D concentration within persons and populations over the calendar year is well-known to be large relative to mean concentration (16–19). This is probably due to seasonal variation in exposure to ultraviolet light. As a result, clinical decisions about initiation and dose of year-long vitamin D supplementation are likely to be heavily influenced by time of ascertainment, which is often arbitrary. Combined with this background knowledge, our results that demonstrated heterogeneity of the 25-(OH)D–composite outcome association by season and a trend toward improved classification of risk using season-specific 25-(OH)D thresholds suggest that season-specific targets for 25-(OH)D concentration are more appropriate than the static targets previously recommended when the need for year-long vitamin D supplementation is being considered (1, 12–15).
We examined a composite end point of clinical disease events that plausibly reflect net pleiotropic vitamin D actions, are supported by existing literature, and have a quantifiable time of onset, understanding that this may include 1 or more outcomes that are not causally related to 25-(OH)D and may omit some important vitamin D–related effects. Associations of low season-specific 25-(OH)D concentration with the composite outcome and each of its components were of similar magnitude, enabling this approach. Statistical significance using the standard α level of 0.05 was achieved only for the composite outcome and for death. However, this study was not powered to detect associations with individual composite outcome components, and statistical confidence is likely to be inflated by testing inference in the same data set in which threshold 25-(OH)D concentrations were derived. Moreover, the primary goal of this study was to study the pattern of the 25-(OH)D–composite outcome relationship, not its existence, which has been demonstrated in previous studies (5–11).
Strengths of this study include the use of a community-based population of older adults, who are often targeted for 25-(OH)D testing; the use of NIST-verified 25-(OH)D concentration, which has not, to our knowledge, been previously applied to large epidemiologic studies; and the ascertainment of clinical outcomes directly relevant to both bone and nonbone vitamin D actions over long-term follow-up. Limitations include the inclusion of only older adults; the availability of only white participants in sufficient numbers to rigorously evaluate relationships of 25-(OH)D with study outcomes; the availability of only one 25-(OH)D measurement per participant, which may bias magnitudes of association toward the null; and the inability of available statistical methods to precisely determine optimal threshold concentrations with statistical confidence. Most important, this study is observational. Ultimately, optimal 25-(OH)D concentrations should be defined as the baseline 25-(OH)D concentrations above which vitamin D supplementation does not improve relevant clinical outcomes in large, diverse, randomized clinical trials.
In conclusion, we found that “optimal” concentrations of 25-(OH)D, gauged by associations with major clinical disease events, centered near 50 nmol/L (20 ng/mL), the level recently recommended by the IOM for bone health. We further report that the association of 25-(OH)D with clinical health events varies by season and suggest that season-specific targets for 25-(OH)D concentration are more appropriate than static targets when considering potential implications for long-term health.
Supplementary Material
Acknowledgments
Grant Support: By the National Heart, Lung, and Blood Institute (contracts N01-HC-85239, N01-HC-85079 through N01-HC-85086, N01-HC-35129, N01 HC-15103, N01 HC-55222, N01-HC-75150, and N01-HC-45133 and grant HL080295), with additional contribution from the National Institute of Neurologic Disorders and Stroke. Additional support was provided by the National Institute on Aging (AG-023629, AG-15928, AG-20098, and AG-027058); the National Heart, Lung, and Blood Institute (grants R01HL084443 and R01HL096875); and the National Institute of Diabetes and Digestive and Kidney Diseases (grant R01DK088762). A full list of principal CHS investigators and institutions can be found at www.chs-nhlbi.org/pi.htm.
Footnotes
Potential Conflicts of Interest: Disclosures can be viewed at www.acponline.org/authors/icmje/ConflictOfInterestForms.do?msNum=M11-2074.
Reproducible Research Statement: Study protocol and statistical code: Available from Dr. de Boer (deboer@u.washington.edu). Data set: Not available.
Current author addresses and author contributions are available at www.annals.org.
Author Contributions: Conception and design: I.H. de Boer, G. Levin, B. Kestenbaum.
Analysis and interpretation of the data: I.H. de Boer, G. Levin, C. Robinson-Cohen, A.N. Hoofnagle, D.S. Siscovick, B. Kestenbaum. Drafting of the article: I.H. de Boer, G. Levin, C. Robinson-Cohen. Critical revision of the article for important intellectual content: G. Levin, C. Robinson-Cohen, M.L. Biggs, A.N. Hoofnagle, D.S. Siscovick, B. Kestenbaum.
Final approval of the article: I.H. de Boer, C. Robinson-Cohen, M.L. Biggs, A.N. Hoofnagle, D.S. Siscovick, B. Kestenbaum. Statistical expertise: G. Levin, C. Robinson-Cohen, A.N. Hoofnagle. Obtaining of funding: I.H. de Boer, B. Kestenbaum.
Collection and assembly of data: G. Levin, M.L. Biggs, A.N. Hoofnagle, D.S. Siscovick.
Web-Only Supplements Conversion of graphics into slides
Context Vitamin D deficiency is defined by its association with markers of bone metabolism, not by its association with clinical outcomes.
Contribution This study followed elderly people and found that baseline levels of 25-hydroxyvitamin D less than 50 nmol/L (20 ng/mL) were associated with a composite outcome that included hip fracture, myocardial infarction, incident cancer, and death.
Caution This was an observational study of white persons.
Implication The threshold identified in this study is closer to the value recently recommended by the Institute of Medicine than to the value recommended by most other professional societies and expert panels (75 nmol/L [30 ng/mL]).
References
- 1.Committee to Review Dietary Reference Intakes for Vitamin D and Calcium. Institute of Medicine . In: Dietary Reference Intakes for Calcium and Vitamin D. Ross AC, Taylor CL, Yaktine AL, Del Valle HB, editors. The National Academies Press; Washington, DC: 2011. [PubMed] [Google Scholar]
- 2.Holick MF. Vitamin D deficiency. N Engl J Med. 2007;357:266–81. doi: 10.1056/NEJMra070553. [PMID: 17634462] [DOI] [PubMed] [Google Scholar]
- 3.Rosen CJ. Clinical practice. Vitamin D insufficiency. N Engl J Med. 2011;364:248–54. doi: 10.1056/NEJMcp1009570. [PMID: 21247315] [DOI] [PubMed] [Google Scholar]
- 4.Dusso AS, Brown AJ, Slatopolsky E, Vitamin D. Am J Physiol Renal Physiol. 2005;289:F8–28. doi: 10.1152/ajprenal.00336.2004. [PMID: 15951480] [DOI] [PubMed] [Google Scholar]
- 5.Cauley JA, Lacroix AZ, Wu L, Horwitz M, Danielson ME, Bauer DC, et al. Serum 25-hydroxyvitamin D concentrations and risk for hip fractures. Ann Intern Med. 2008;149:242–50. doi: 10.7326/0003-4819-149-4-200808190-00005. [PMID: 18711154] [DOI] [PMC free article] [PubMed] [Google Scholar]
- 6.Robinson-Cohen C, Katz R, Hoofnagle AN, Cauley JA, Furberg CD, Robbins JA, et al. Mineral metabolism markers and the long-term risk of hip fracture: the cardiovascular health study. J Clin Endocrinol Metab. 2011;96:2186–93. doi: 10.1210/jc.2010-2878. [PMID: 21508146] [DOI] [PMC free article] [PubMed] [Google Scholar]
- 7.Wang TJ, Pencina MJ, Booth SL, Jacques PF, Ingelsson E, Lanier K, et al. Vitamin D deficiency and risk of cardiovascular disease. Circulation. 2008;117:503–11. doi: 10.1161/CIRCULATIONAHA.107.706127. [PMID: 18180395] [DOI] [PMC free article] [PubMed] [Google Scholar]
- 8.de Boer IH, Kestenbaum B, Shoben AB, Michos ED, Sarnak MJ, Siscovick DS. 25-hydroxyvitamin D levels inversely associate with risk for developing coronary artery calcification. J Am Soc Nephrol. 2009;20:1805–12. doi: 10.1681/ASN.2008111157. [PMID: 19443637] [DOI] [PMC free article] [PubMed] [Google Scholar]
- 9.Giovannucci E, Liu Y, Hollis BW, Rimm EB. 25-hydroxyvitamin D and risk of myocardial infarction in men: a prospective study. Arch Intern Med. 2008;168:1174–80. doi: 10.1001/archinte.168.11.1174. [PMID: 18541825] [DOI] [PMC free article] [PubMed] [Google Scholar]
- 10.Melamed ML, Michos ED, Post W, Astor B. 25-hydroxyvitamin D levels and the risk of mortality in the general population. Arch Intern Med. 2008;168:1629–37. doi: 10.1001/archinte.168.15.1629. [PMID: 18695076] [DOI] [PMC free article] [PubMed] [Google Scholar]
- 11.Kestenbaum B, Katz R, de Boer I, Hoofnagle A, Sarnak MJ, Shlipak MG, et al. Vitamin D, parathyroid hormone, and cardiovascular events among older adults. J Am Coll Cardiol. 2011;58:1433–41. doi: 10.1016/j.jacc.2011.03.069. [PMID: 21939825] [DOI] [PMC free article] [PubMed] [Google Scholar]
- 12.Dawson-Hughes B, Heaney RP, Holick MF, Lips P, Meunier PJ, Vieth R. Estimates of optimal vitamin D status [Editorial] Osteoporos Int. 2005;16:713–6. doi: 10.1007/s00198-005-1867-7. [PMID: 15776217] [DOI] [PubMed] [Google Scholar]
- 13.Vieth R. What is the optimal vitamin D status for health? Prog Biophys Mol Biol. 2006;92:26–32. doi: 10.1016/j.pbiomolbio.2006.02.003. [PMID: 16766239] [DOI] [PubMed] [Google Scholar]
- 14.Dawson-Hughes B, Mithal A, Bonjour JP, Boonen S, Burckhardt P, Fuleihan GE, et al. IOF position statement: vitamin D recommendations for older adults. Osteoporos Int. 2010;21:1151–4. doi: 10.1007/s00198-010-1285-3. [PMID: 20422154] [DOI] [PubMed] [Google Scholar]
- 15.Holick MF, Binkley NC, Bischoff-Ferrari HA, Gordon CM, Hanley DA, Heaney RP, et al. Endocrine Society Evaluation, treatment, and prevention of vitamin D deficiency: an Endocrine Society clinical practice guideline. J Clin Endocrinol Metab. 2011;96:1911–30. doi: 10.1210/jc.2011-0385. [PMID: 21646368] [DOI] [PubMed] [Google Scholar]
- 16.Bolland MJ, Grey AB, Ames RW, Mason BH, Horne AM, Gamble GD, et al. The effects of seasonal variation of 25-hydroxyvitamin D and fat mass on a diagnosis of vitamin D sufficiency. Am J Clin Nutr. 2007;86:959–64. doi: 10.1093/ajcn/86.4.959. [PMID: 17921371] [DOI] [PubMed] [Google Scholar]
- 17.Sherman SS, Hollis BW, Tobin JD. Vitamin D status and related parameters in a healthy population: the effects of age, sex, and season. J Clin Endocrinol Metab. 1990;71:405–13. doi: 10.1210/jcem-71-2-405. [PMID: 2380336] [DOI] [PubMed] [Google Scholar]
- 18.Jorde R, Sneve M, Hutchinson M, Emaus N, Figenschau Y, Grimnes G. Tracking of serum 25-hydroxyvitamin D levels during 14 years in a population-based study and during 12 months in an intervention study. Am J Epidemiol. 2010;171:903–8. doi: 10.1093/aje/kwq005. [PMID: 20219763] [DOI] [PubMed] [Google Scholar]
- 19.Shoben AB, Kestenbaum B, Levin G, Hoofnagle AN, Psaty BM, Siscovick DS, et al. Seasonal variation in 25-hydroxyvitamin D concentrations in the cardiovascular health study. Am J Epidemiol. 2011;174:1363–72. doi: 10.1093/aje/kwr258. [PMID: 22112344] [DOI] [PMC free article] [PubMed] [Google Scholar]
- 20.Phinney KW. Development of a standard reference material for vitamin D in serum. Am J Clin Nutr. 2008;88:511S–512S. doi: 10.1093/ajcn/88.2.511S. [PMID: 18689392] [DOI] [PubMed] [Google Scholar]
- 21.Fried LP, Borhani NO, Enright P, Furberg CD, Gardin JM, Kronmal RA, et al. The Cardiovascular Health Study: design and rationale. Ann Epidemiol. 1991;1:263–76. doi: 10.1016/1047-2797(91)90005-w. [PMID: 1669507] [DOI] [PubMed] [Google Scholar]
- 22.Agborsangaya C, Toriola AT, Grankvist K, Surcel HM, Holl K, Parkkila S, et al. The effects of storage time and sampling season on the stability of serum 25-hydroxy vitamin D and androstenedione. Nutr Cancer. 2010;62:51–7. doi: 10.1080/01635580903191460. [PMID: 20043259] [DOI] [PubMed] [Google Scholar]
- 23.Ives DG, Fitzpatrick AL, Bild DE, Psaty BM, Kuller LH, Crowley PM, et al. Surveillance and ascertainment of cardiovascular events. The Cardiovascular Health Study. Ann Epidemiol. 1995;5:278–85. doi: 10.1016/1047-2797(94)00093-9. [PMID: 8520709] [DOI] [PubMed] [Google Scholar]
- 24.Chen C, Lewis SK, Voigt L, Fitzpatrick A, Plymate SR, Weiss NS. Prostate carcinoma incidence in relation to prediagnostic circulating levels of insulin-like growth factor I, insulin-like growth factor binding protein 3, and insulin. Cancer. 2005;103:76–84. doi: 10.1002/cncr.20727. [PMID: 15540247] [DOI] [PubMed] [Google Scholar]
- 25.Taylor HL, Jacobs DR, Jr, Schucker B, Knudsen J, Leon AS, Debacker G. A questionnaire for the assessment of leisure time physical activities. J Chronic Dis. 1978;31:741–55. doi: 10.1016/0021-9681(78)90058-9. [PMID: 748370] [DOI] [PubMed] [Google Scholar]
- 26.Robinson-Cohen C, Katz R, Mozaffarian D, Dalrymple LS, de Boer I, Sarnak M, et al. Physical activity and rapid decline in kidney function among older adults. Arch Intern Med. 2009;169:2116–23. doi: 10.1001/archinternmed.2009.438. [PMID: 20008696] [DOI] [PMC free article] [PubMed] [Google Scholar]
- 27.Wang Y, Jacobs EJ, McCullough ML, Rodriguez C, Thun MJ, Calle EE, et al. Comparing methods for accounting for seasonal variability in a biomarker when only a single sample is available: insights from simulations based on serum 25-hydroxyvitamin d. Am J Epidemiol. 2009;170:88–94. doi: 10.1093/aje/kwp086. [PMID: 19406919] [DOI] [PubMed] [Google Scholar]
- 28.Dobnig H, Pilz S, Scharnagl H, Renner W, Seelhorst U, Wellnitz B, et al. Independent association of low serum 25-hydroxyvitamin d and 1,25-dihydroxyvitamin d levels with all-cause and cardiovascular mortality. Arch Intern Med. 2008;168:1340–9. doi: 10.1001/archinte.168.12.1340. [PMID: 18574092] [DOI] [PubMed] [Google Scholar]
- 29.Eilers PHC, Marx BD. Flexible smoothing with B-splines and penalties. Stat Sci. 1996;11:89–121. [Google Scholar]
- 30.Therneau T. [on 1 July 2011];A package for survival analysis in R. R package version 2.36-0. Accessed at http://cran.r-project.org/web/packages/survival/citation.html.
- 31.Contal C, O’Quigley J. An application of changepoint methods in studying the effect of age on survival in breast cancer. Comput Stat Data Anal. 1999;30:253–70. [Google Scholar]
- 32.Efron B, Tibshirani R. An Introduction to the Bootstrap. Chapman & Hall; New York: 1994. [Google Scholar]
- 33.Pencina MJ, D’Agostino RB, Sr, D’Agostino RB, Jr, Vasan RS. Evaluating the added predictive ability of a new marker: from area under the ROC curve to reclassification and beyond. Stat Med. 2008;27:157–72. doi: 10.1002/sim.2929. [PMID: 17569110] [DOI] [PubMed] [Google Scholar]
- 34.Looker AC, Pfeiffer CM, Lacher DA, Schleicher RL, Picciano MF, Yetley EA. Serum 25-hydroxyvitamin D status of the US population: 1988-1994 compared with 2000-2004. Am J Clin Nutr. 2008;88:1519–27. doi: 10.3945/ajcn.2008.26182. [PMID: 19064511] [DOI] [PMC free article] [PubMed] [Google Scholar]
Associated Data
This section collects any data citations, data availability statements, or supplementary materials included in this article.