Abstract
Echogenic liposomes (ELIP) encapsulate gas bubbles and drugs within lipid vesicles, but the mechanisms of ultrasound-mediated drug release from ELIP are not well understood. The effect of cavitation activity on drug release from ELIP was investigated in flowing solutions using two fluorescent molecules: a lipophilic drug (rosiglitazone) and a hydrophilic drug substitute (calcein). ELIP samples were exposed to pulsed Doppler ultrasound from a clinical diagnostic ultrasound scanner at pressures above and below the inertial and stable cavitation thresholds. Control samples were exposed to a surfactant, Triton X-100 (positive control), or to flow alone (negative control). Fluorescence techniques were used to detect release. Encapsulated microbubbles reduced the measured fluorescence intensity and this effect should be considered when assessing drug release from ELIP. The origin of this effect is not specific to ELIP. Release of rosiglitazone or calcein compared to the negative control was only observed with detergent treatment, but not with ultrasound exposure, despite the presence of stable and inertial cavitation activity. Release of rosiglitazone or calcein from ELIP exposed to diagnostic ultrasound was not observed, even in the presence of cavitation activity. Ultrasound-mediated drug delivery strategies with ELIP will thus rely on passage of the drug-loaded liposomes to target tissues.
Keywords: Echogenic liposomes, pulsed Doppler ultrasound, drug release, cavitation, rosiglitazone, spectrofluorometric techniques
1. Introduction
Cardiovascular disease, which includes coronary and peripheral arterial disease, heart failure, and stroke, is the leading cause of death in the United States [1,2]. Cardiovascular disease is caused by the development of atheromatous plaques within arteries [2]. Atheromas contain peroxisome proliferator-activated receptor gamma (PPARγ), which when activated can inhibit atheroma progression [3–5]. Rosiglitazone is a PPARγ agonist that has demonstrated anti-atherosclerotic activity in pre-clinical studies [6–8]. Systemic doses at concentrations required for therapeutic efficacy have resulted in serious and sometimes fatal side effects, including myocardial infarction and heart failure [9,10]. Thus, there is a need for more targeted delivery of this drug.
Targeted drug delivery may be achieved using echogenic liposomes (ELIP). ELIP solutions contain vesicles composed of one or more lipid bilayers that surround an aqueous core and encapsulated bubbles. Thus, ELIP can potentially serve as ultrasound contrast agents and drug delivery vehicles simultaneously [11,12]. In addition, antibodies can be conjugated to the ELIP surface and have been successfully targeted to vessels in vivo [13,14]. Kopechek, et al., found that greater than 99% of the number of ELIP are less than 100 nm in diameter. The remaining 1% range up to several microns in diameter, with a median diameter between 0.5 and 1 µm for the particle population above 0.4 µm [15]. Furthermore, ultrasound backscatter and attenuation at high frequencies (>20 MHz) of solutions of ELIP only matched theoretical models when microbubbles less than 100 nm were included. Although bubbles smaller than 100 nm could play a role in high frequency ultrasound applications, it is expected that they do not contribute substantially to the echogenicity observed from ELIP using clinical diagnostic ultrasound frequencies (1–10 MHz) due to their small scattering cross-sections at these frequencies. Though the location of the bubbles in ELIP solutions remains uncertain, it is possible that some bubbles exist in solution external to the liposomes. However, TEM and freeze fracture microscopic images provide evidence for the existence of a population of nanometer and micron-sized bubbles that exist within liposomes in ELIP solutions [12,15]. Several therapeutic agents have been loaded into ELIP, including a thrombolytic enzyme (recombinant tissue-plasminogen activator), a vasodilator (papaverine), and an oligonucleotide (NF-κB decoy) [16–18]. Ultrasound-mediated release of these agents from ELIP has been previously investigated [18–22]. However, the mechanisms of ultrasound-mediated drug release from ELIP are not well understood.
Acoustic cavitation has been associated with ultrasound-mediated drug release from micelles and liposomes [23–25]. Under certain conditions, bubbles oscillate in a non-linear manner and can expand rapidly before collapsing violently. This phenomenon is known as “inertial” or “transient” cavitation [26]. “Stable” cavitation, occurs when bubbles oscillate non-linearly without the associated sudden expansion or violent collapse [27]. Cavitation can be detected by analyzing the acoustic emissions scattered from oscillating bubbles in response to acoustic exposure. Inertial cavitation is associated with an increase in broadband emissions as a result of rapid bubble collapse [28,29]. Stable cavitation, however, is detected by the presence of subharmonics of the insonation frequency and corresponding ultraharmonics [28,30]. Cavitation can cause microstreaming or microjetting along with associated bioeffects [31–37]. Although these effects are undesirable for diagnostic applications, they can potentially be advantageous for therapeutic treatments. Stable cavitation has been associated with enhanced clot lysis and blood-brain barrier opening [38–41]. Inertial cavitation has been associated with ultrasound-mediated drug release from liposomes, enhanced gene transfection, and sonoporation of cells [24,42–44]. In light of these results, it seems plausible that cavitation plays a role in ultrasound-mediated drug release from ELIP. However, cavitation nucleated from echogenic liposomes has not been previously investigated.
In this study, two fluorescent molecules were separately loaded into ELIP and exposed to pulsed Doppler ultrasound pulses: a lipophilic drug with anti-atherogenic properties (rosiglitazone) and a water-soluble dye used as a hydrophilic drug substitute (calcein). Drug release from liposomes can be detected using a self-quenching assay. Self-quenching can occur as a result of molecular interactions between the fluorophores that renders them non-fluorescent (e.g. dimerization or collisional self-quenching) or due to the inner filter effect where absorption at the excitation or emission wavelengths occurs along the optical path [45,46]. Encapsulation of molecules at a concentration sufficiently high to render the fluorophores non-fluorescent, i.e. molecular interaction quenching, can result in little or no detected fluorescence emissions from the sample. The liposome solution can be diluted such that the concentration of unencapsulated molecules in solution drops below the self-quenching threshold and fluorescence emissions from these molecules can be detected. However, molecules encapsulated within the liposomes are not diluted and the concentration remains above the molecular interaction self-quenching threshold. Release of encapsulated contents into the diluted solution can cause relief of self-quenching, resulting in an increase in the fluorescence signal. Relief of fluorescence self-quenching has also been used to detect ultrasound-mediated calcein release from liposomes [25,47,48].
Chemical quenching is another technique used to detect drug release from liposomes. In some cases, a quenching agent can be added to the sample, which binds to the unencapsulated drug and quenches its fluorescence, while encapsulated molecules continue to fluoresce. For example, cobalt ions quench calcein fluorescence. Thus cobalt chloride has been used to detect calcein release from ELIP [45,49,50].
The objective of this study was to determine whether inertial or stable cavitation causes drug release from flowing ELIP exposed to pulsed Doppler ultrasound from a clinical diagnostic system. Rosiglitazone release was detected using a self-quenching assay and calcein release was detected using a cobalt quenching assay. The long-term goal is to improve the therapeutic treatment of cardiovascular disease by achieving image-guided targeted drug delivery in vivo.
2. Material and Methods
2.1 ELIP Preparation
The lipids L-α-phosphatidylcholine (chicken egg; EPC), 1,2-dipalmitoyl-sn-glycero-3-phosphocholine (DPPC), 1,2-dipalmitoyl-sn-glycero-3-[phosphor-rac-1-glycerol] (DPPG), 1,2-dipalmitoyl-sn-glycero-3-phosphoethanolamine (DPPE), 1,2-diheptanoyl-sn-glycero-3-phosphocholine (DHPC), and cholesterol (CH) were purchased from Avanti Polar Lipids (Alabaster, AL, USA). Bovine serum albumin (BSA), calcein, and cobalt chloride were purchased from Sigma-Aldrich (St. Louis, MO, USA), and rosiglitazone was purchased from Cayman Chemical (Ann Arbor, MI, USA).
Rosiglitazone-loaded ELIP (R-ELIP) were prepared at the University of Texas Health Science Center following a process previously described [51–53]. The lipids were dissolved in chloroform at molar ratios of 27:42:8:8:15, EPC:DPPC:DPPG:DPPE:CH, and evaporated under argon while rotating in a 50 °C water bath. This lipid composition has been shown to maintain echogenicity for a longer time at physiologic temperature than other compositions [51]. After desiccation for 8 hours, the lipid film was rehydrated at room temperature with a 0.32 M mannitol solution containing 1 mg/ml rosiglitazone to a final lipid concentration of 10 mg/ml. The resulting liposomes were sonicated in a water bath for 5 minutes. The free rosiglitazone was separated from rosiglitazone-loaded liposomes by centrifugation at 13,000 g for 20 minutes and indicated greater than 90% encapsulation efficiency [54]. The resulting pellet was resuspended in a 0.32 M mannitol solution, frozen at -80 °C for 1 hour and lyophilized for 24 hours. The final loading amount of rosiglitazone in each vial was 200 µg in 2 mg lipid. R-ELIP vials were reconstituted with 200 µl of 0.2-µm filtered, deionized, and air-saturated water (dissolved oxygen concentration of 105 ± 2.5% relative to the dissolved oxygen concentration in air) to form an R-ELIP stock solution. Encapsulated nanobubbles are formed during reconstitution. Thus, lyophilization conditions prior to that point, including vacuum applied during lyophilization, do not diminish the echogenicity of the reconstituted suspension. However, vacuum applied after reconstitution immediately reduces echogenicity. For drug release experiments, the R-ELIP stock solution was diluted with 0.5% BSA (w/v) in a phosphate buffered saline (PBS) solution (Sigma) to final concentrations of 0.032 mg/ml lipid and 3.2 µg/ml (9 µM) rosiglitazone.
Calcein-loaded ELIP (C-ELIP) were prepared and reconstituted in a similar manner as previously described [50]. The lipid formulation was EPC:DPPG:DPPE:DHPC:CH in molar ratios of 69:8:8:4:15. This formulation is identical to the formulation used in a previous study by the authors, allowing for direct comparison between studies [50]. The lipid film was rehydrated at room temperature with a 0.32 M mannitol solution containing 62 µg/ml (100 µM) calcein. After three freeze-thaw cycles the C-ELIP solution was lyophilized for 24 hours. Unencapsulated calcein did not need to be separated from liposomes because the cobalt quenching technique that was used blocks fluorescence from unencapsulated calcein. C-ELIP vials were reconstituted with 0.2-µm filtered, deionized, and air-saturated water to a lipid concentration of 10 mg/ml to form a stock solution. For drug release experiments, the C-ELIP stock solution was diluted in 50 mM MOPS buffer and 110 mM NaCl to a final lipid concentration of 0.33 mg/ml, which corresponded to 2.1 µg/ml (3.4 µM) total calcein. The solution containing 50 mM MOPS buffer and 110 mM NaCl was used in previous C-ELIP experiments to maintain isosmolarity with mannitol and calcein [50]. The final concentrations of unencapsulated rosiglitazone and calcein were below the fluorescence inner-filter effect self-quenching thresholds, as shown in Figure 1.
Figure 1.
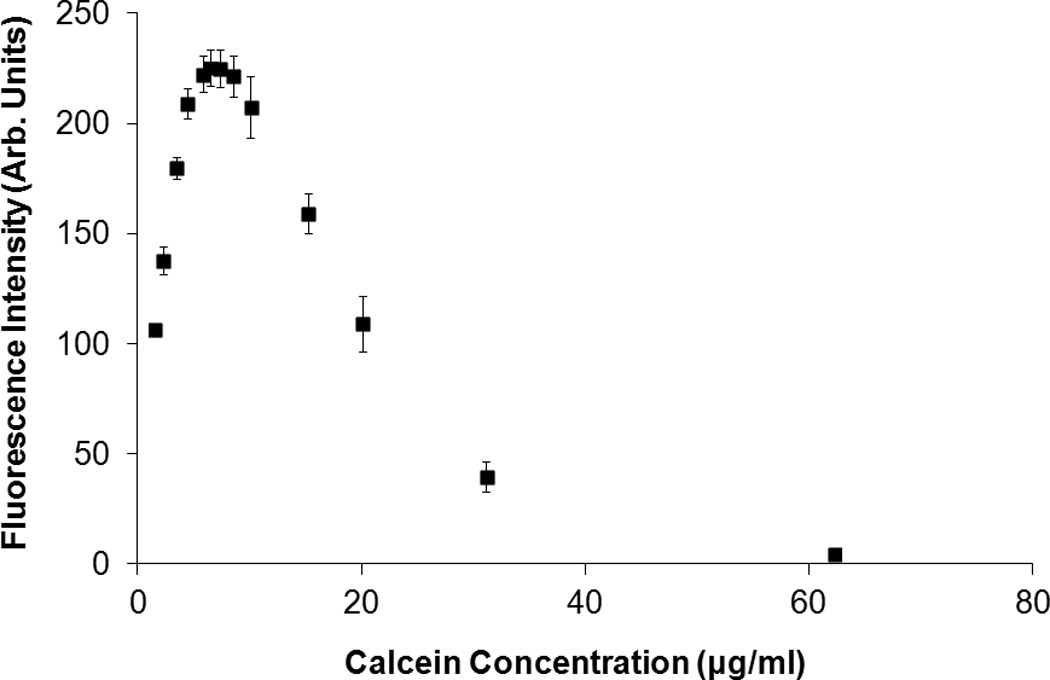
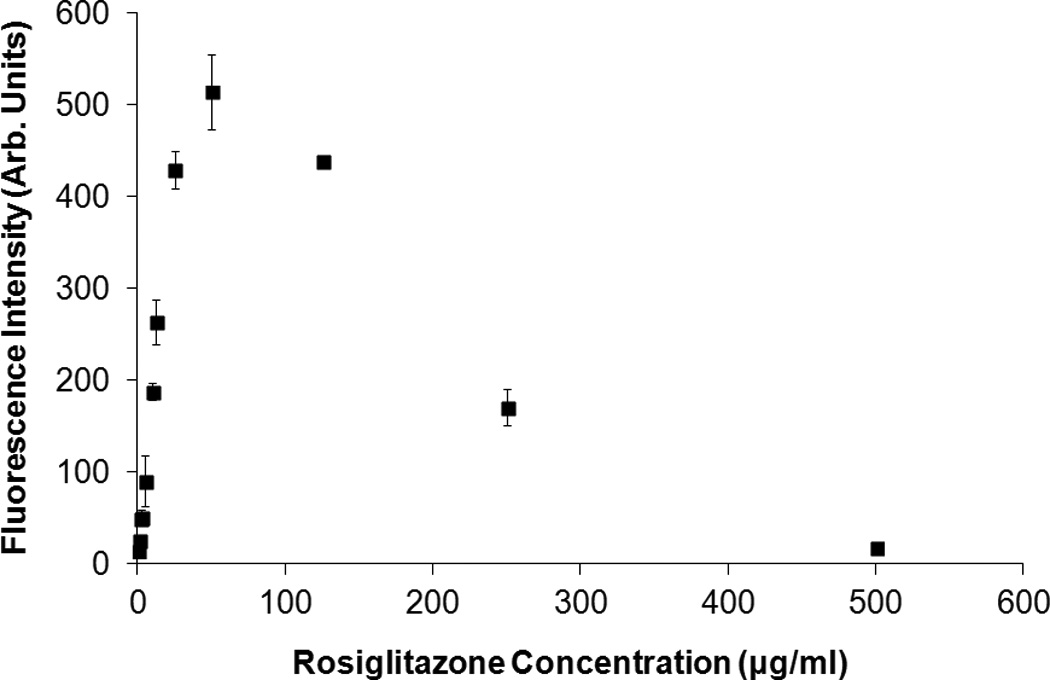
Fluorescence intensity of (A) calcein and (B) rosiglitazone as a function of concentration. Calcein fluorescence self-quenched due to the inner filter effect at concentrations above 6 µg/ml, which agrees with the 10 mm cuvette results obtained by Memoli et al. [46]. Rosiglitazone fluorescence self-quenched at concentrations above 75 µg/ml. Error bars represent the mean ± standard deviation of three measurements. For this figure only, the slit widths were changed to 1.5 nm (excitation and emission) for rosiglitazone and 3 nm (excitation and emission) for calcein in order to avoid saturating the detector at peak fluorescence concentrations.
2.2 Spectrofluorometric Analysis
A Shimadzu spectrofluorometer (RF5301-PC, Shimadzu, Kyoto, Japan) was used to measure fluorescence intensity and a Shimadzu spectrophotometer (UV-1700, Shimadzu) was used for absorbance measurements. For ultrasound-mediated drug release studies, rosiglitazone fluorescence was detected with an excitation wavelength of 317 nm and an emission wavelength of 372 nm. Calcein fluorescence was detected at an excitation wavelength of 496 nm and an emission wavelength of 520 nm. For R-ELIP and C-ELIP measurements, the slit widths (bandwidths of incident and detected light) were set to 3 nm for excitation and 5 nm for emission. The “sensitivity” (a gain setting on the instrument) was set to “high” for rosiglitazone and “low” for calcein measurements. A sub-micro quartz cuvette was used for all measurements (100 µl, 10 mm pathlength, Starna Cells, Atascadero, CA). Rosiglitazone and calcein fluorescence standard curves are plotted in Figure 1 as a function of concentration. The fluorescence increases with concentration for both rosiglitazone and calcein until the inner-filter effect self-quenching thresholds, above which the fluorescence decreases with concentration.
2.3 Effect of Encapsulated Bubbles on Fluorescence Measurements
A series of spectrofluorometric measurements were performed in order to reveal the relationship between rosiglitazone and calcein concentration and absolute fluorescence intensity. Due to concerns that encapsulated bubbles in ELIP solutions could affect fluorescence measurements by scattering both the excitation and emission light, the fluorescence intensity and absorbance of C-ELIP was measured before and after applying vacuum to eliminate the bubbles. For these measurements a calcein concentration of 1 µM was encapsulated in C-ELIP and diluted in calcein solutions to achieve known total concentrations. This calcein concentration was chosen to be below the inner filter effect self-quenching threshold so that both encapsulated and unencapsulated calcein fluorescence were measured. Thus, calcein release that may occur due to exposure to vacuum would not cause an increase in fluorescence. Because bubbles scatter light, the absorbance was measured at a wavelength of 496 nm as an independent indicator of the effect of bubbles on the passage of the excitation light beam through the sample. The number density of encapsulated bubbles increases with lipid concentration [55]. Thus, the fluorescence intensity and absorbance were measured at different lipid concentrations to determine the effect of different number densities of bubbles. Fluorescence and absorbance measurements were also obtained at different calcein concentrations. To remove encapsulated bubbles from the solution after the initial fluorescence and absorbance were measured, vacuum was applied to each C-ELIP sample for 60 s at a pressure of -70 kPa using a 5-L stainless steel chamber connected to a vacuum pump (2522B-01, Welch Vacuum Technology, Niles, IL, USA). To confirm that bubbles did not remain in the solution after vacuum was applied, B-mode images were acquired using a Philips CL15-7 transducer array on a clinical diagnostic ultrasound scanner (HDI 5000, Philips Medical Systems, Bothell, WA).
2.4 Flow Phantom Setup
A diagram of the flow phantom setup is shown in Figure 2. A peristaltic pump (Rabbit, Rainin, Oakland, CA) was used to pump 10 ml of R-ELIP or C-ELIP solutions at a rate of 2.5 ml/min through tubing submersed in a tank of 0.2-µm filtered, deionized, degassed water (dissolved oxygen concentration of 25% ± 5%) maintained at 37 °C. Latex tubing (0.125” ID, Piercan, San Marcos, CA) was used for R-ELIP experiments. Low-density polyethylene tubing (0.106” inner diameter, 5/32” outer diameter, McMaster-Carr, Elmhurst, IL) was used for C-ELIP experiments because it was found that latex interfered with the cobalt quenching assay. A calibrated linear array transducer (CL15-7) driven by a clinical diagnostic ultrasound scanner (HDI 5000, Philips Medical Systems) was placed 1.0 cm above the tubing and used to insonify ultrasound-treated samples with 6.0-MHz Doppler pulses (pulse duration of 3.33 µs, pulse repetition frequency of 1250 Hz). A 10-MHz center frequency hydrophone (Valpey-Fisher, Hopkinton, MA) was used as a passive cavitation detector (PCD). The PCD was aligned orthogonally and confocally to the pulsed Doppler focus of the CL15-7 transducer and placed at a distance of 2.0 cm from the center of the tubing.
Figure 2.
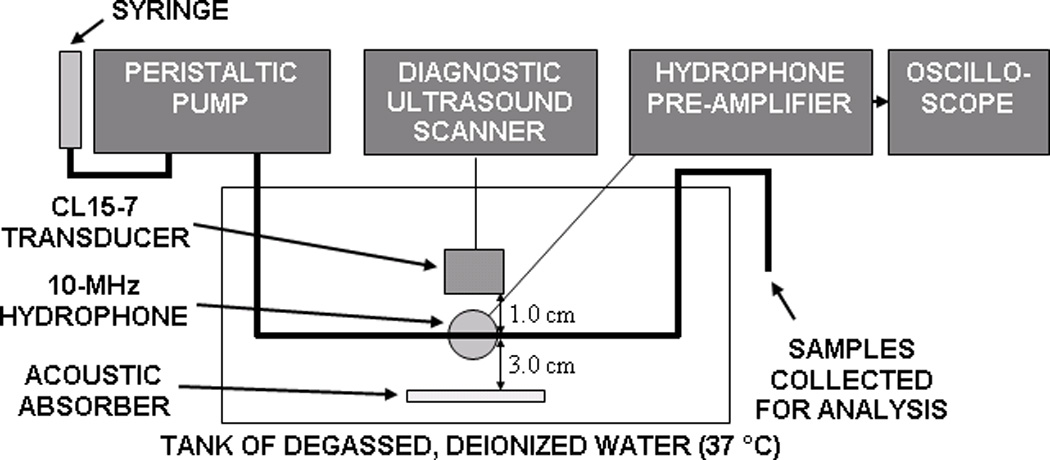
A diagram of experimental setup. A 10-MHz focused hydrophone was confocally-aligned with the pulsed Doppler sample volume (shown in Figure 9) from a CL15-7 transducer array.
The CL15-7 transducer and the 10-MHz PCD were calibrated in 0.2-µm filtered, deionized, degassed water at room temperature using a 0.2-mm PVDF needle hydrophone (Precision Acoustics Ltd., Dorchester, UK). A computer-controlled, motorized three-axis orthogonal translation system (Velmex NF90 Series, Velmex Inc., Bloomfield, NY) was used to step the hydrophone throughout the ultrasound field. The hydrophone signal at each point was acquired with a digital oscilloscope (WaveRunner-2 LT572, LeCroy, Chestnut Ridge, NY) and transferred to a PC for analysis in order to determine the axial and transverse beam profiles. The focal depths were 10 mm and 20 mm for the CL15-7 and PCD, respectively, and the -3 dB beamwidths were 0.5 mm for both the CL15-7 transducer and the PCD.
2.5 Cavitation Detection and Analysis
Received signals from the PCD were amplified with an RF power amplifier (50A15, AR, Souderton, PA), digitized (8 bits, 100 MHz sampling rate, 10 µs window) using an oscilloscope (Waverunner LT584, LeCroy, Chestnut Ridge, NY), and saved to a PC using MATLAB (Mathworks, Natick, MA). Traces containing 500 received pulses each were acquired throughout the ultrasound exposures using sequence mode with a 25-ms trigger delay and the power spectrum was computed for each pulse. The average power spectrum was computed by averaging the linear power spectra from 2500 pulses. Reference signals were acquired with degassed water in the flow system to measure the scattering from just the tubing. To identify ultrasound pressures that were above or below the stable cavitation (SC) and inertial cavitation (IC) thresholds for R-ELIP, the on-screen mechanical index (MI) was increased incrementally and PCD signals were acquired at each output setting as R-ELIP were pumped through the latex tubing. Stable cavitation activity was indicated by a 10 dB increase in the subharmonic peak at 3 MHz, and inertial cavitation activity was indicated by a 10 dB increase in the broadband emission level.
The method used to quantify cavitation activity was based on the work of Somaglino, et al. [24]. The following equation was derived to compute the cavitation pressure, Pc(f), at a distance of 20 mm from the focus:
| (1) |
where 〈|Vs(f)|2〉 and 〈|Vref(f)|2〉 are the average power spectra of the emissions received by the PCD from the ELIP samples and reference (degassed water), respectively, Gamp(f) is the gain of the hydrophone pre-amplifier, SPCD(f) is the PCD sensitivity, and αt(f) is the total attenuation of any materials between the ELIP sample and the detector (i.e. the tubing wall).
To determine the frequency-dependent PCD sensitivity, the pressure at the focus of a 30-MHz transducer (Aperture diameter of 6 mm, focal distance of 19 mm, Harisonic HI-988, Olympus-NDT, Waltham, MA) was measured at 0.1-MHz intervals between 2 and 20 MHz using a 0.2-mm PVDF needle hydrophone (Precision Acoustics, Dorchester, UK). The needle hydrophone was removed, the PCD was aligned confocally with the 30-MHz transducer, and signals were acquired at the same frequencies. The pressures determined from hydrophone measurements were divided by the voltages measured by the PCD to determine the sensitivity, SPCD(f).
The attenuation of latex and polyethylene tubing was determined by slicing it lengthwise and placing it at the foci of two confocally-aligned 30-MHz transducers (Harisonic HI-988, Olympus-NDT, Waltham, MA). After acquiring the transmitted pulses at 0.25-MHz intervals between 3 and 30 MHz, the tubing was removed and free-field measurements were acquired at the same frequencies. The ratio of the signals with and without tubing was calculated at each frequency to determine the frequency-dependent total attenuation (or insertion loss) of the tubing, αt(f), shown in Figure 3. Note that this signal processing corrects for the frequency-dependent attenuation of the tubing but not any effects due to diffraction of the curved tubing.
Figure 3.
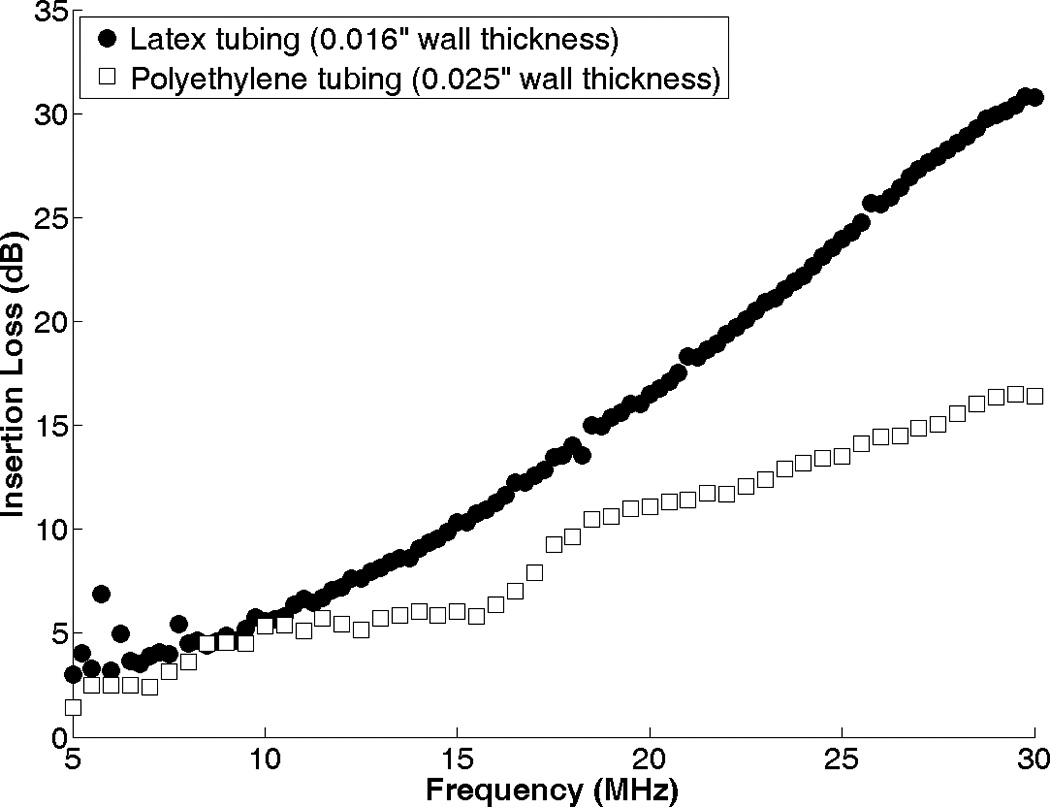
Attenuation of latex and polyethylene tubing as a function of frequency, measured with two confocally-aligned 30-MHz focused transducers.
The average cavitation pressure for each sample was determined using the cavitation pressures computed with equation 1. The inertial cavitation pressures were computed by averaging over 0.5-MHz bands centered about the inharmonics at 4 and 10 MHz, avoiding the fundamental, harmonic, subharmonic, and ultraharmonic signals. The stable cavitation pressures were computed by averaging over 0.5-MHz bands, which corresponded to the -3 dB bandwidths, of the subharmonic peak at 3 MHz and the ultrahamonic peak at 9 MHz. To correct for the subharmonic and ultraharmonic increase due to broadband noise from inertial cavitation, the calculated inertial cavitation pressure was subtracted from the calculated stable cavitation pressure.
2.6 Drug Release Measurements
2.6.1 Rosiglitazone-loaded ELIP Experiments
A self-quenching assay was used to detect rosiglitazone release because there are no known quenching agents for rosiglitazone. Measurements with a 1.5 mm path length sub-micro cuvette indicated that at least some of the rosiglitazone self-quenching is due to the inner filter effect. It is unknown whether molecular interaction quenching also plays a significant role. R-ELIP samples were pumped through the system with one of five treatments (with N=5 in each): no ultrasound sham (negative control), 0.05% w/v Triton X-100 detergent (positive control), pulsed Doppler ultrasound below the stable cavitation (SC) and inertial cavitation (IC) thresholds, pulsed Doppler ultrasound above the SC threshold but below the IC threshold, or pulsed Doppler ultrasound above the SC and IC thresholds. The on-screen MIs and corresponding peak rarefactional pressures are listed in Table 1. An MI of 0.8 was the maximum output permitted by the ultrasound scanner at the pulse duration and pulse repetition frequency settings used in this study. The spatial-peak temporal-average intensity (Ispta) was calculated from calibration measurements to be 0.17 W/cm2 at an MI of 0.8, a pulse duration of 3.33 µs, and a pulse repetition frequency of 1250 Hz. After one pass through the system, samples were collected for spectrofluorometric analysis.
Table 1.
Ultrasound parameters for R-ELIP experiments. Note that the on-screen MI and in situ MI are different due to the lack of tissue attenuation and derating used in the calculation of the on-screen MI.
| On-Screen MI | In Situ Peak Rarefactional Pressure (MPa) |
Stable Cavitation | Inertial Cavitation |
|---|---|---|---|
| 0.8 | 1.15 | Above Threshold | Above Threshold |
| 0.32 | 0.49 | Above Threshold | Below Threshold |
| 0.19 | 0.26 | Below Threshold | Below Threshold |
2.6.2 Calcein-loaded ELIP Experiments
Calcein release was detected using a cobalt quenching assay. At the beginning of each experiment cobalt chloride was added to the C-ELIP solution at a concentration of 150 µM in order to quench unencapsulated calcein. Samples from five C-ELIP vials were exposed to pulsed Doppler ultrasound at an MI of 0.8 (above SC and IC thresholds) in the flow system while cavitation activity was monitored. Negative controls were performed with the contents of five other C-ELIP vials that were passed through the flow system without ultrasound exposure. The fluorescence intensity of each sample was measured before and after flow. In addition, a 300 µl aliquot from each sample was treated with 1% Triton X-100 detergent to release all encapsulated calcein (positive control) and the fluorescence intensity was measured again.
2.7 Statistical Analysis
Statistical analysis was performed with a 2-tailed Student’s t-test using OpenEPI (Emory University, Atlanta, GA). Drug concentrations before and after ultrasound or detergent treatments were compared with negative controls. A p-value below 0.05 was the threshold used to determine statistical significance.
3. Results
3.1 Effect of Encapsulated Bubbles on Calcein Fluorescence Measurements
Figure 4 shows the fluorescence intensity and absorbance measured for solutions of free calcein plus C-ELIP in 0.5% BSA in PBS before and after vacuum was applied. The total calcein (free plus encapsulated) for these data points was fixed at 6 µM. The calcein encapsulated in C-ELIP was below the self-quenching threshold and therefore contributes to the total fluorescence measured. The amount of C-ELIP in each solution ranged from 0.0 mg lipid/ml to 0.6 mg lipid/ml. Figure 5 plots the fluorescence intensity and absorbance measured for three different fixed lipid concentrations with varying amounts of total calcein concentration (obtained by adjusting the amount of free calcein added). For both figures, before vacuum was applied, the fluorescence intensity decreased while the absorbance increased with increasing lipid concentration at constant total calcein concentration. This change in fluorescence intensity indicates that either the lipid or encapsulated microbubbles affect the spectrofluorometric measurements. Vacuum was applied to remove encapsulated bubbles from solution while leaving the lipid concentration the same. Removal of microbubbles was verified by a subsequent total loss of echogenicity in B-mode images of the solutions after vacuum. After vacuum, the fluorescence intensity increased and the absorbance decreased for all lipid concentrations, indicating that microbubbles were the primary influence on fluorescence and absorbance measurements. The lipid concentration also affected the fluorescence and absorbance measurements, but to a much lesser degree. Calcein release from C-ELIP would not cause an increase in fluorescence intensity because the encapsulated calcein concentration was below the self-quenching threshold. Thus, these results demonstrate that at sufficiently high number densities, the encapsulated bubbles in C-ELIP solutions can significantly affect calcein fluorescence and absorbance measurements.
Figure 4.
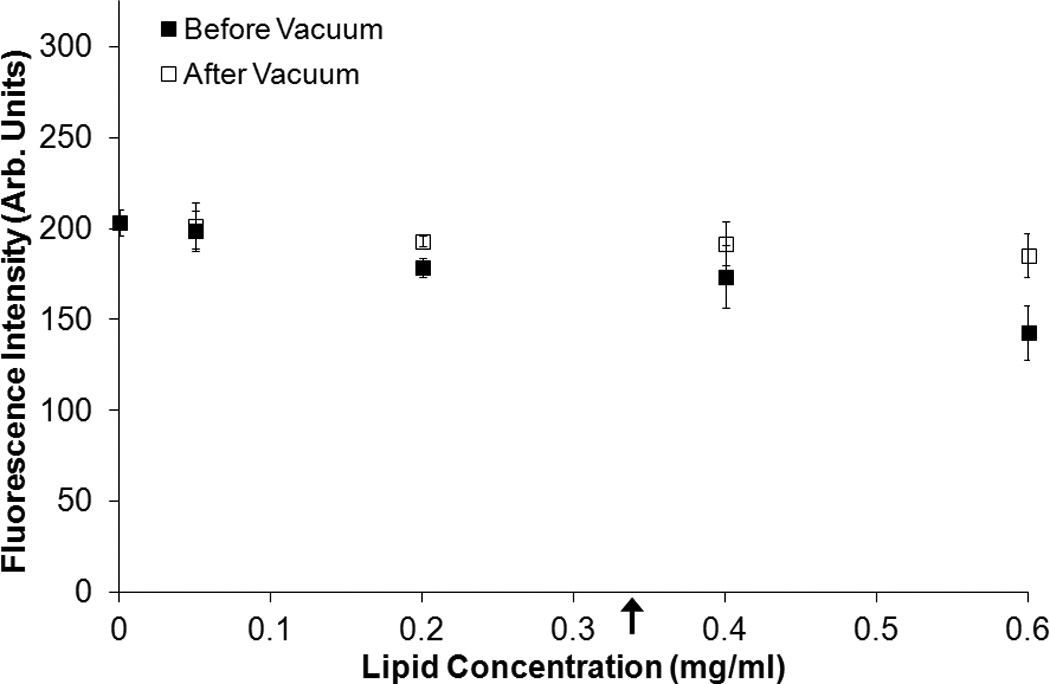
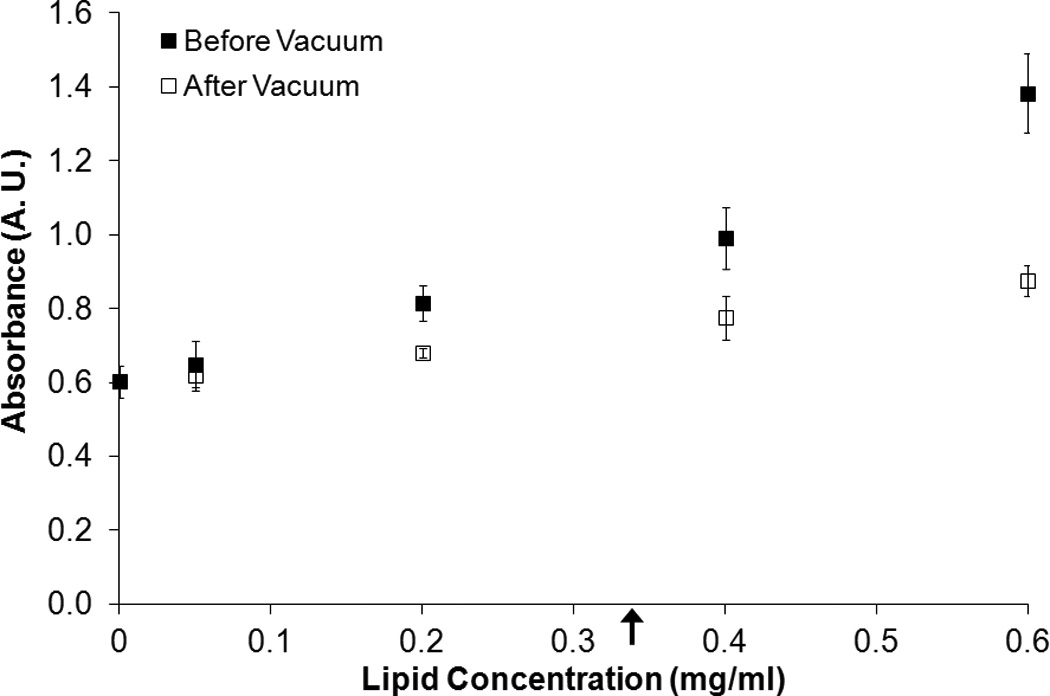
Effect of lipid concentration on fluorescence intensity at a fixed total calcein concentration. The mean (A) fluorescence intensity and (B) absorbance of C-ELIP diluted in calcein solution to 6 µM at different lipid concentrations before and after vacuum treatment is plotted. Error bars represent the standard deviation of measurements from three C-ELIP vials. Arrows indicate the lipid concentrations used in subsequent experiments reported herein.
Figure 5.
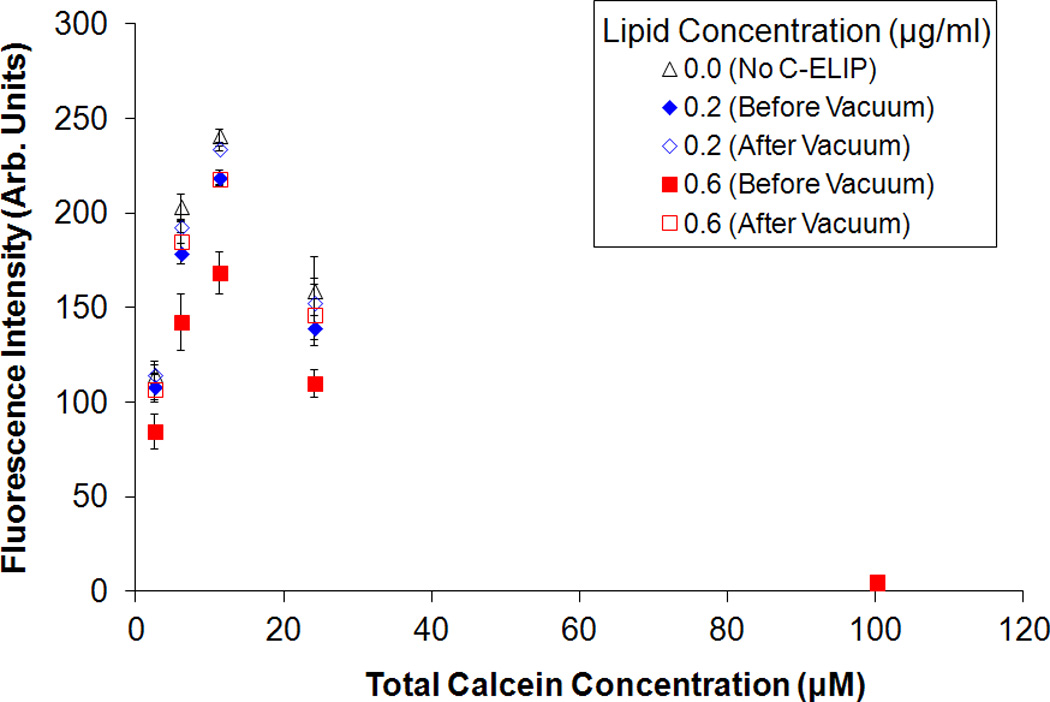
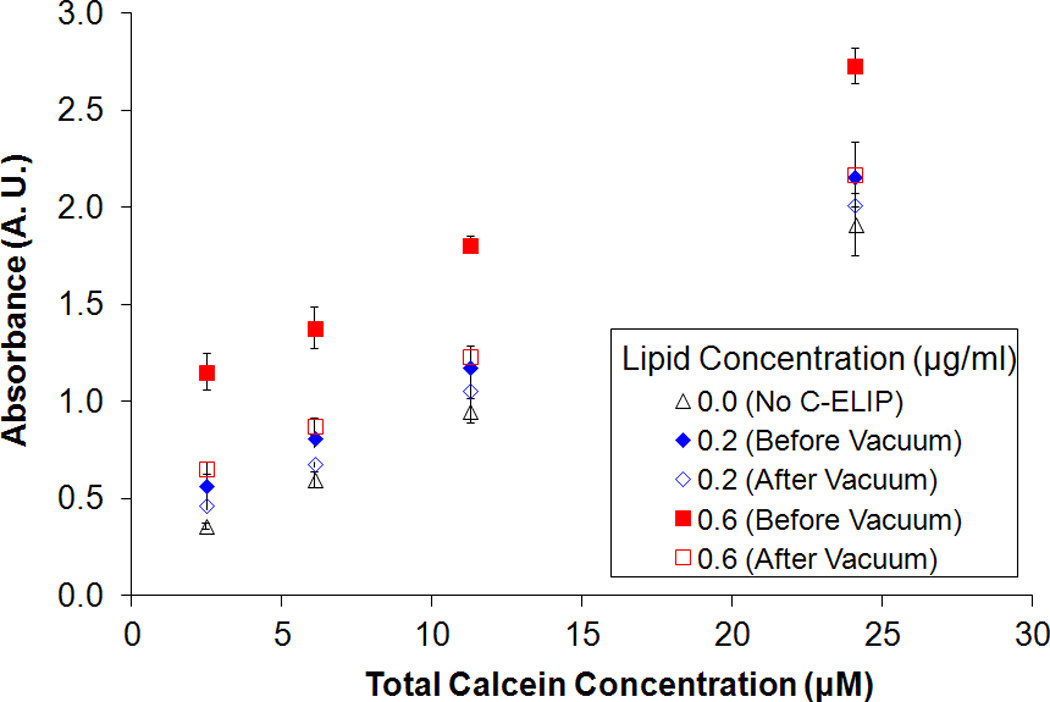
Effect of total calcein concentration on fluorescence intensity for fixed lipid concentrations. The mean (A) fluorescence intensity and (B) absorbance of C-ELIP plus free calcein solutions before and after vacuum is plotted. The C-ELIP encapsulated 1 µM of calcein and was added to yield final lipid concentrations of 0.0 µg/ml, 0.2 µg/ml or 0.6 µg/ml. Free calcein was added to give the total calcein concentrations listed on the abscissa. Error bars represent the standard deviation of measurements from three C-ELIP vials.
It was necessary to remove microbubble artifacts before obtaining fluorescence measurements. R-ELIP and C-ELIP samples maintained echogenicity when pumped from a room temperature reservoir (22 °C ± 1 °C) through a 37 °C water bath (Figure 6a). However, when the samples were subsequently gently cooled back to room temperature over five minutes they lost all echogenicity (Figure 6b), indicating a dissolution of microbubbles. Since encapsulated microbubbles were no longer present after cooling, the microbubble artifact in fluorescence measurements was avoided. Therefore all fluorescence and absorbance measurements for drug release were made after the solutions cooled to room temperature and lost echogenicity (confirmed with B-mode imaging).
Figure 6.
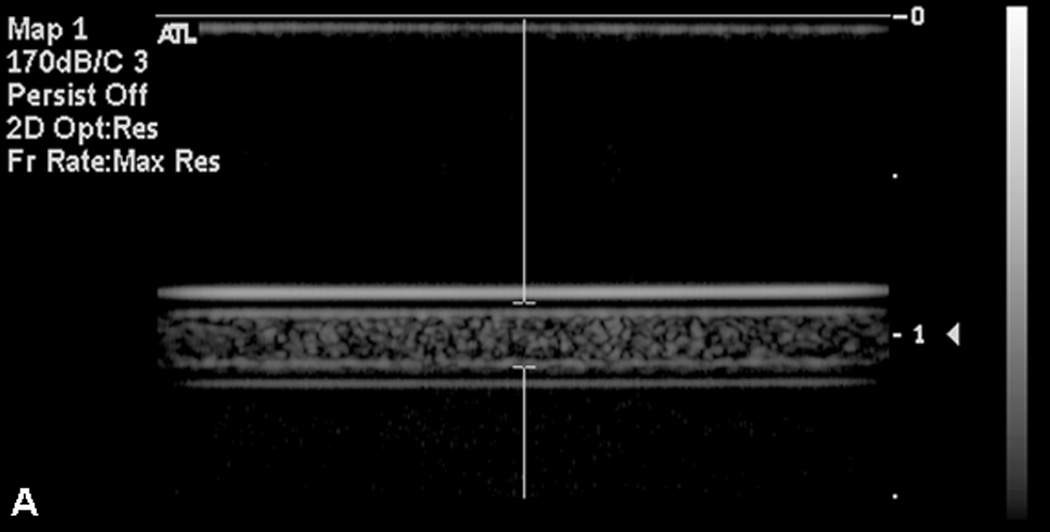
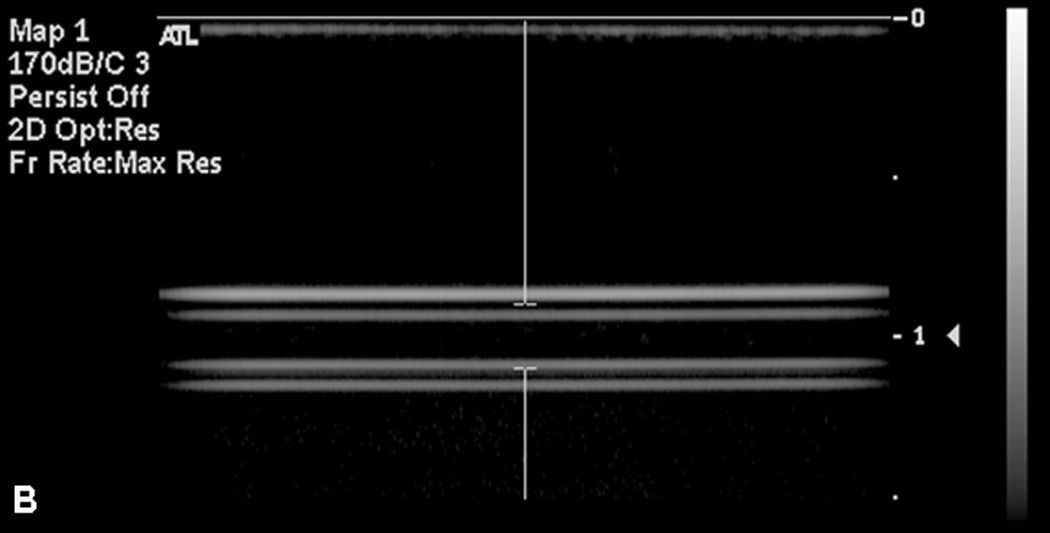
B-mode images of C-ELIP in polyethylene tubing (A) after temperature transitioning from room temperature (21 °C) to physiologic temperature (37 °C) and (B) after cycling back from physiologic temperature to room temperature. Temperature transitioning from 37 °C to 22 °C caused a loss of echogenicity.
3.2 Cavitation Activity
The average power spectrum of R-ELIP, obtained from PCD measurements, is shown in Figure 7 at different MIs (i.e. insonation pressures). The increase in subharmonic power at 3 and 9 MHz indicates the onset of stable cavitation at an MI of 0.32. The increase in broadband noise level at an MI of 0.8 indicates the presence of inertial cavitation activity. Thus, MIs of 0.8, 0.32, and 0.19 were chosen for drug release experiments in order to compare the effects of IC, SC, and the absence of IC or SC on drug release from ELIP. The average inertial and stable cavitation pressures of R-ELIP, computed using Equation 1, are shown in Figure 8 at each ultrasound output setting. Representative B-mode images of R-ELIP at each MI are shown in Figure 9.
Figure 7.
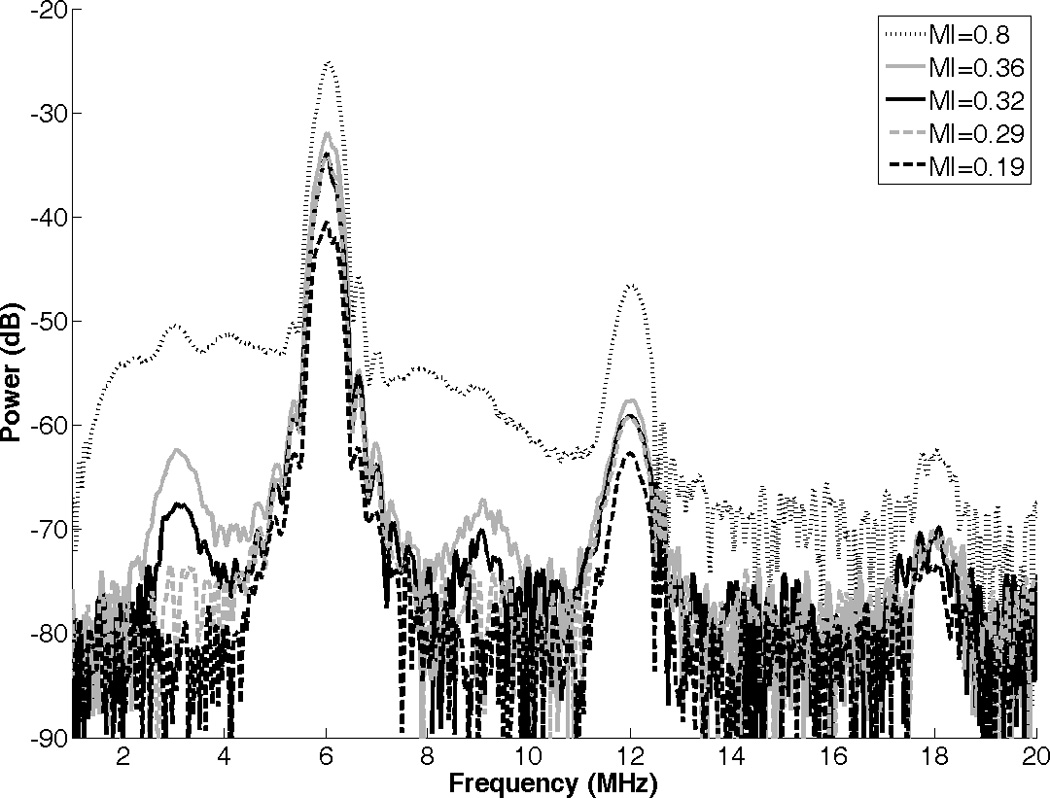
Power spectrum of R-ELIP obtained from PCD measurements at different MIs.
Figure 8.
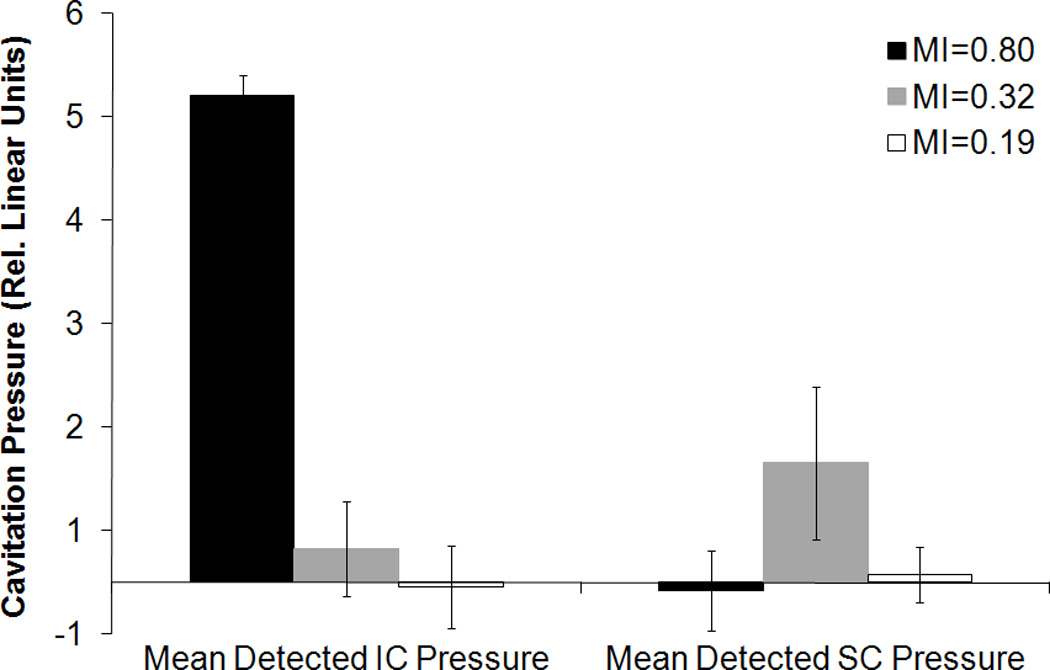
Average detected inertial and stable cavitation pressures of R-ELIP solutions, computed using Equation 1. Error bars represent the standard deviation from five R-ELIP vials.
Figure 9.
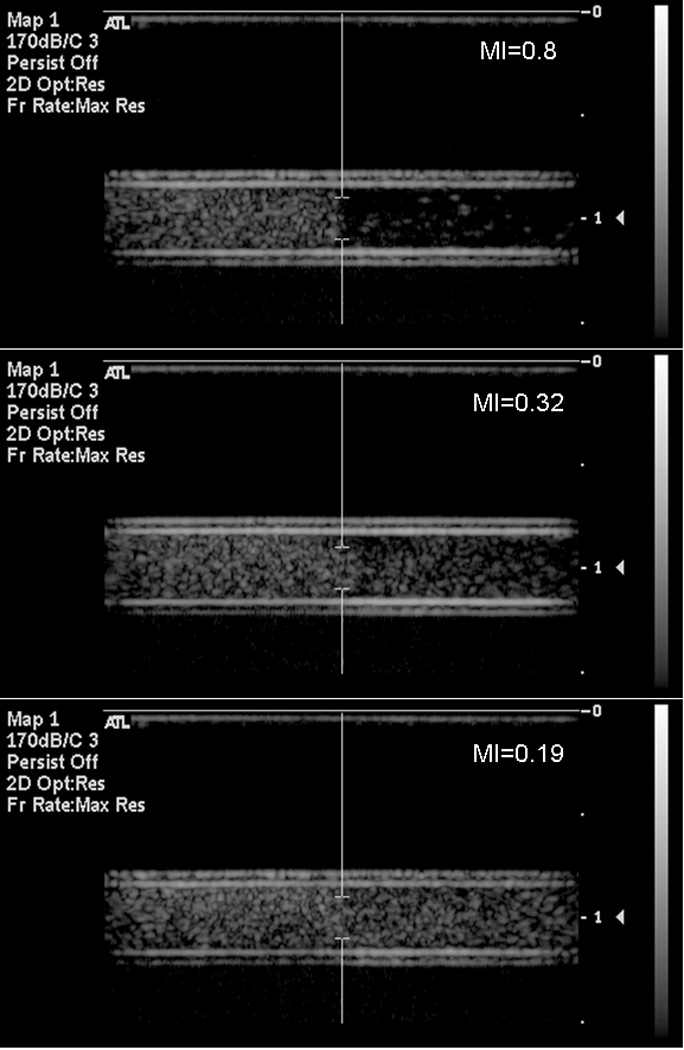
Representative B-mode images of R-ELIP before and after exposure to pulsed Doppler ultrasound at on-screen MIs of 0.8, 0.32, and 0.19. Flow direction is left to right.
3.3 Lack of Drug Release
The fluorescence intensity of rosiglitazone in R-ELIP solutions is plotted in Figure 10 before and after flow only (negative control), ultrasound, or detergent (positive control) treatment. The increase in fluorescence intensity after 0.05% Triton X-100 treatment was statistically significant compared to the negative control (p = 0.02), indicating release of encapsulated rosiglitazone. The fluorescence intensity of all samples increased over time, possibly due to passive diffusion or effects of the flow system. However, ultrasound exposure did not cause a statistically significant increase in fluorescence intensity compared with the negative control, regardless of the ultrasound pressure. Therefore, although inertial and stable cavitation activity was detected, there was no associated release of drug.
Figure 10.
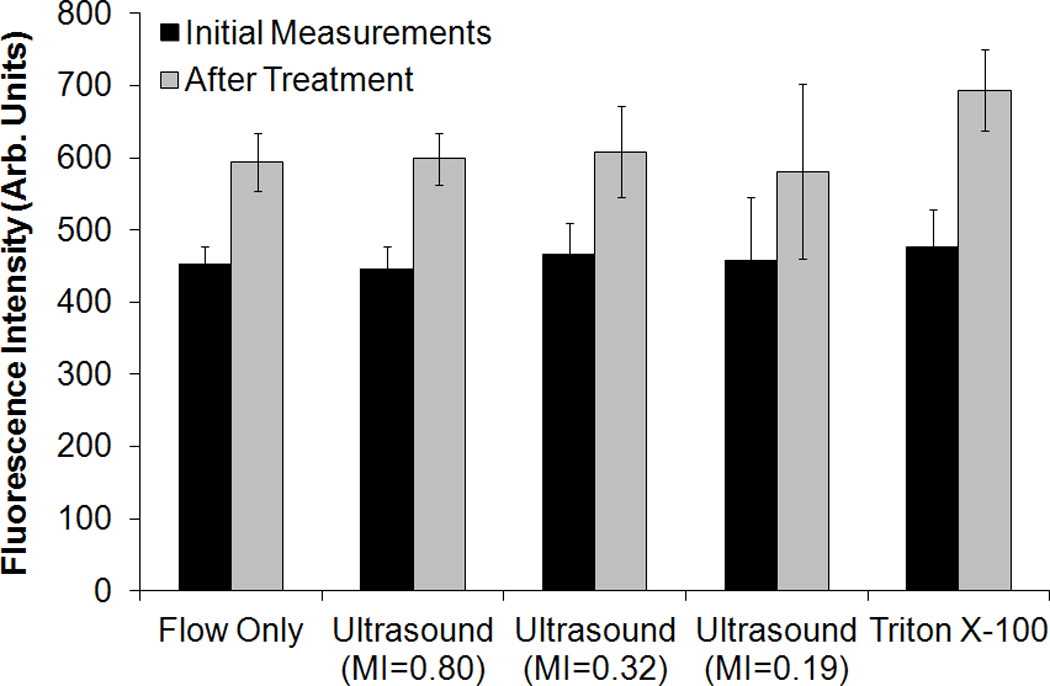
Fluorescence intensity of rosiglitazone in R-ELIP solution before and after treatment. Statistical significance relative to flow only (negative control) is indicated with an asterisk. Error bars represent the standard deviation from five R-ELIP vials.
The fluorescence intensity of C-ELIP solutions containing cobalt chloride is plotted in Figure 11 for flow alone (negative control) and pulsed Doppler ultrasound exposure at an MI of 0.8. There was no statistically significant difference between the fluorescence intensity of C-ELIP after negative control compared with ultrasound exposures (p = 0.98). The fluorescence intensity decreased significantly after adding Triton X-100, confirming that encapsulated calcein was released by the detergent and quenched by cobalt chloride (p < 0.0001). The power spectrum of C-ELIP with cobalt chloride is compared with degassed water in Figure 12. The broadband noise and half-harmonic peaks (3 and 9 MHz) are elevated, indicating that inertial and stable cavitation activity were present during the insonation. The average detected inertial cavitation pressure was 15.7 ± 0.6 relative linear pressure units and the average detected stable cavitation pressure was -0.2 ± 0.2 relative linear pressure units. Therefore, while significant inertial cavitation activity was detected, no calcein release was observed.
Figure 11.
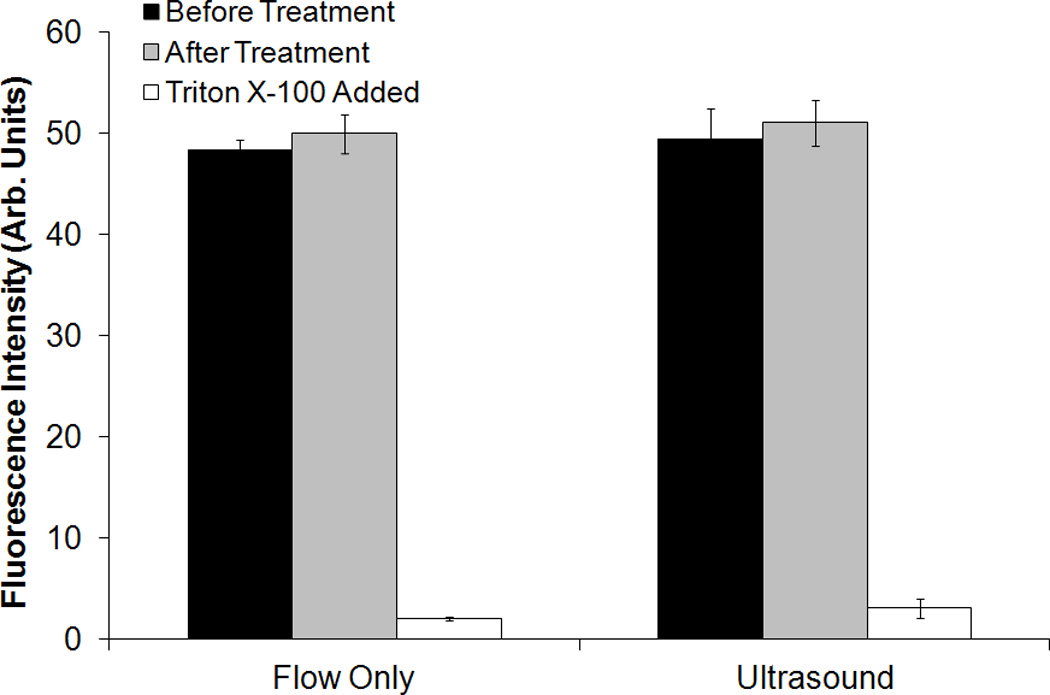
Fluorescence intensity of C-ELIP solution containing cobalt chloride before and after flow alone (sham) or pulsed Doppler ultrasound treatment (MI=0.8). Error bars represent mean ± standard deviation from five vials of C-ELIP.
Figure 12.
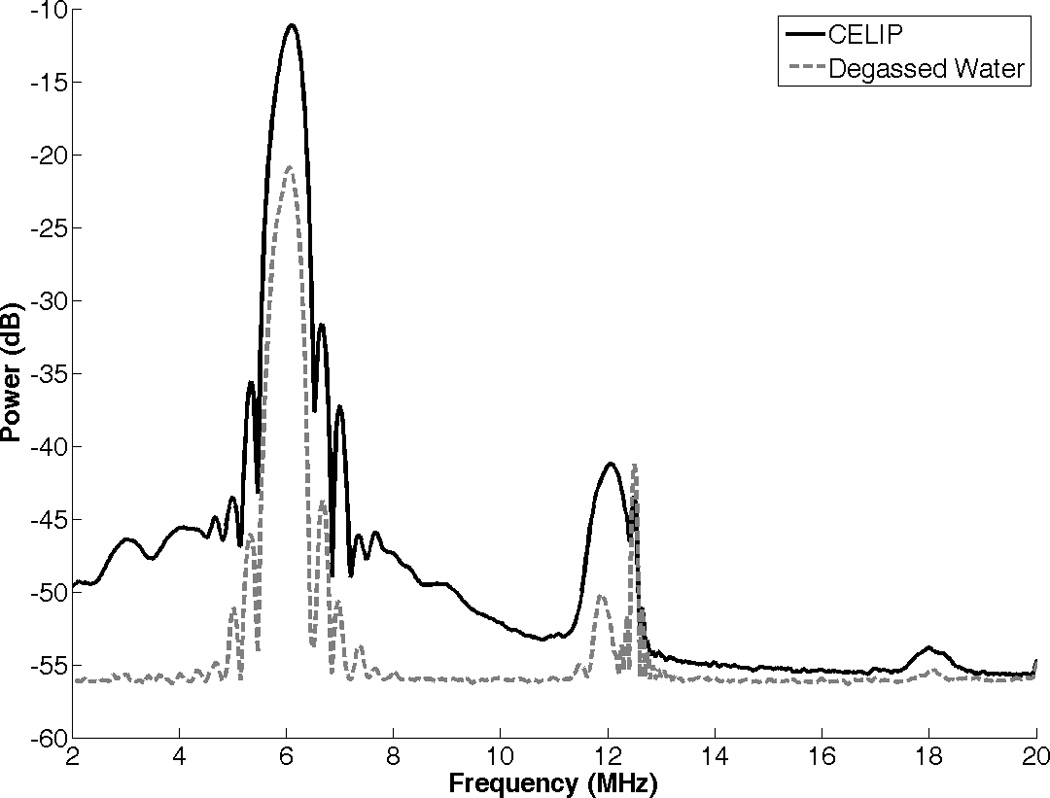
Power spectrum of C-ELIP solution containing cobalt chloride, compared with degassed water. The increase in broadband signal indicates the presence of inertial cavitation activity.
4. Discussion
It was found that fluorescence measurements of C-ELIP solutions at high lipid concentrations can be affected by encapsulated bubbles. The microbubbles scatter both excitation and emission light and thus reduce the detected fluorescence intensity, independent of the drug concentration. The reduction in fluorescence due to light scattering from bubbles must be accounted for in studies that use a quenching assay to detect drug release if encapsulated bubbles are present. The results in Figure 4 suggest that at sufficiently low lipid concentrations (i.e. low number densities of encapsulated bubbles), such as the concentrations used in this study, the effect of encapsulated bubbles on fluorescence measurements is minimal. However, some previous studies have used higher lipid concentrations where the effect of encapsulated bubbles was significant [22,50]. If microbubbles are present, a change in fluorescence after ultrasound exposure could be due to the destruction of microbubbles and not due to drug release. Thus, microbubbles can confound the interpretation of spectrofluorometric data as a metric for drug release. Several studies have used fluorescence self-quenching assays to detect calcein release from liposomes [25,47,48], and in one case the effect of encapsulated bubbles on fluorescence measurements led to the erroneous conclusion that 47% of encapsulated calcein was released by color Doppler ultrasound pulses [22]. The effect of encapsulated bubbles on the self-quenching assay can be avoided by removing the bubbles from the sample prior to measuring the fluorescence. In this study, the bubbles were removed by reducing the temperature of the ELIP solution from 37 to 22 °C over 5 minutes prior to the fluorescence measurements. It is critical for future ultrasound-mediated drug release and delivery experiments that use optical techniques to account for this microbubble artifact properly.
The goal of this study was to determine the relationship between inertial or stable cavitation activity and release of rosiglitazone or calcein from ELIP. Ultrasound-mediated drug release from ELIP was not observed, even though significant inertial and stable cavitation activity was detected. Inertial cavitation also did not enhance the permeability of the lipid membrane to cobalt chloride, a much smaller molecule than calcein or rosiglitazone. Thus, the presence of cavitation activity is not sufficient to trigger the release of calcein or rosiglitazone from ELIP, indicating that inertial and stable cavitation activity is not a reliable indicator of drug release from ELIP. Schroeder, et al., suggested that cavitation activity can enable drug diffusion out of liposomes by forming transient pores in the liposomal membranes, which rapidly reseal after sonication is stopped [56]. However, the pulses generated by the diagnostic ultrasound scanner in this study were very short (less than 5 µs), which may have been too short to form pores that would persist long enough to allow measurable drug diffusion out of the liposomes. For example, Lin et al. (2004) demonstrated continuous calcein release from liposomes exposed to 20-kHz ultrasound, which abruptly stopped at the cessation of ultrasound insonation [47]. In addition, Evjen, et al., also used longer sonication durations to induce calcein release from liposomes (1.5-ms pulses with a 25% duty cycle) [25].
Another possibility is that the lipid-stabilized gas bubbles are not associated with the liposomes in ELIP solutions. In this case, it is possible that cavitation events were not located close enough to the lipid bilayers to affect their permeability. Although Evjen, et al., [25] previously correlated cavitation activity with calcein release from liposomes, the ultrasound spatial-peak temporal-average intensity (Ispta) was 5500 W/cm2. At such a high intensity it is very possible that cavitation was nucleated by impurities in the surrounding fluid, rather than by encapsulated bubbles such as those in ELIP solutions. Thus, it may be necessary to use much higher ultrasound intensities than those that can be achieved with a clinical diagnostic ultrasound scanner. In addition, ultrasound-induced heating, which is influenced by the insonation frequency and intensity, can potentially cause drug release from liposomes [47].
Cavitation activity has been shown to play a role in sonoporation of living cells [44]. There are a couple of important differences between cellular membranes and liposomal membranes. One difference is that because cells are usually attached on several sides to other cells or to the extracellular matrix, the cellular membranes may have less freedom of motion than liposomes suspended in solution. As a result, shear forces that affect membrane integrity may be higher for cellular membranes [57]. Also, membrane proteins are present in cellular membranes but not in liposomal membranes and these could potentially affect the stability of the lipid membrane. Smith, et al., demonstrated that a thrombolytic protein, recombinant tissue-type plasminogen activator, can be released from ELIP using color Doppler ultrasound pulses [20]. It is hypothesized that some of the rt-PA is incorporated into the lipid bilayer. Thus, inclusion of a protein in the lipid bilayer may make the liposome susceptible to sonoporation, which could be used as a strategy for ultrasound-triggered drug release.
Besides modifying the lipid bilayer with proteins, it may be possible to also change the lipid formulation or the type of encapsulated gas. Conical lipids have been found to destabilize lipid membranes when compared to cylindrical lipids, resulting in enhanced ultrasound-mediated calcein release [25,58]. Also, a previous study observed greater ultrasound-mediated calcein release from ELIP containing perfluorocarbon or argon gas compared with air-containing ELIP [49]. Thus, inclusion of heavier gases may improve the ability to trigger calcein release.
Ultrasound-mediated delivery of rhodamine has been demonstrated in excised murine aortas using rhodamine-labeled ELIP [59]. Also, ultrasound-mediated delivery of calcein into the arterial wall has been demonstrated in vivo using C-ELIP [60]. Anti-smooth muscle cell actin-conjugated C-ELIP were injected directly into the artery at the site of treatment after flow was stopped and continuous 1-MHz ultrasound was delivered for 120 s at an acoustic output intensity setting of 2 W/cm2. Ultrasound-enhanced calcein uptake in the arterial wall was evident on fluorescence images compared with control vessels containing C-ELIP that were not exposed to ultrasound. However, even if encapsulated calcein was not released upon ultrasound exposure, unencapsulated calcein may have penetrated the arterial wall during insonation. Another possibility is that intact calcein-containing liposomes may have penetrated the arterial wall during insonation without releasing calcein.
In clinical applications it may be advantageous to avoid cavitation-induced drug release from ELIP into the bloodstream. Cavitation activity has been associated with enhanced endothelial permeability [40,41,59]. Thus, ultrasound-triggered cavitation could potentially cause delivery of antibody-conjugated ELIP, which can be targeted to the vessel wall, across the endothelium. However, if cavitation activity simultaneously caused drug release from ELIP, some of the released drug could be carried downstream. On the other hand, without cavitation-induced drug release from ELIP the intact liposomes could potentially be delivered into the arterial wall, where macrophages could phagocytose the liposomes and induce release of encapsulated drugs. Thus, further studies are warranted to pursue targeted drug delivery from ELIP.
5. Conclusions
No ultrasound-mediated release of rosiglitazone or calcein was detected from R-ELIP or C-ELIP, respectively, even though inertial and stable cavitation activity was detected. These results demonstrate that cavitation activity is not correlated with ultrasound-mediated release of rosiglitazone or calcein from echogenic liposomes. These findings will inform future in vivo strategies for ultrasound-mediated drug delivery with ELIP.
HIGHLIGHTS.
Calcein and rosiglitazone were encapulsated in echogenic liposomes
Encapsulated bubbles affected fluorescence and absorbance measurements
Clinical ultrasound induced stable and inertial cavitation of echogenic liposomes
Cavitation activity did not cause drug release from echogenic liposomes
Acknowledgements
This work was supported by three grants from the National Institutes of Health: NIH R01 HL74002, NIH R01 HL059586, and NIH F32 HL104916.
Footnotes
Publisher's Disclaimer: This is a PDF file of an unedited manuscript that has been accepted for publication. As a service to our customers we are providing this early version of the manuscript. The manuscript will undergo copyediting, typesetting, and review of the resulting proof before it is published in its final citable form. Please note that during the production process errors may be discovered which could affect the content, and all legal disclaimers that apply to the journal pertain.
References
- 1.AHA. Heart Disease and Stroke Statistics - 2011 Update. 2011. [DOI] [PMC free article] [PubMed] [Google Scholar]
- 2.Lee CD, Folsom AR, Nieto FJ, Chambless LE, Shahar E, Wolfe DA. White blood cell count and incidence of coronary heart disease and ischemic stroke and mortality from cardiovascular disease in African-American and White men and women: atherosclerosis risk in communities study. Am. J. Epidemiol. 2001;154:758–764. doi: 10.1093/aje/154.8.758. [DOI] [PubMed] [Google Scholar]
- 3.Marx N, Sukhova G, Murphy C, Libby P, Plutzky J. Macrophages in human atheroma contain PPARgamma: differentiation-dependent peroxisomal proliferator-activated receptor gamma(PPARgamma) expression and reduction of MMP-9 activity through PPARgamma activation in mononuclear phagocytes in vitro. Am. J. Pathol. 1998;153:17–23. doi: 10.1016/s0002-9440(10)65540-x. [DOI] [PMC free article] [PubMed] [Google Scholar]
- 4.Li AC, Binder CJ, Gutierrez A, Brown KK, Plotkin CR, Pattison JW, Valledor AF, Davis RA, Willson TM, Witztum JL, Palinski W, Glass CK. Differential inhibition of macrophage foam-cell formation and atherosclerosis in mice by PPARalpha, beta/delta, and gamma. J. Clin. Invest. 2004;114:1564–1576. doi: 10.1172/JCI18730. [DOI] [PMC free article] [PubMed] [Google Scholar]
- 5.Pucci A, Formato L, Muscio M, Brscic E, Pizzimenti S, Ferroni F, Ribezzo M, Toaldo C, Pettazzoni P, Ciamporcero E, Barrera G, Rinaldi M, Bergamasco L, Sheiban I, Spinnler MT. PPARgamma in coronary atherosclerosis: in vivo expression pattern and correlations with hyperlipidemic status and statin treatment. Atherosclerosis. 2011;218:479–485. doi: 10.1016/j.atherosclerosis.2011.06.009. [DOI] [PubMed] [Google Scholar]
- 6.Li AC, Brown KK, Silvestre MJ, Willson TM, Palinski W, Glass CK. Peroxisome proliferator-activated receptor gamma ligands inhibit development of atherosclerosis in LDL receptor-deficient mice. J. Clin. Invest. 2000;106:523–531. doi: 10.1172/JCI10370. [DOI] [PMC free article] [PubMed] [Google Scholar]
- 7.Calkin AC, Forbes JM, Smith CM, Lassila M, Cooper ME, Jandeleit-Dahm KA, Allen TJ. Rosiglitazone attenuates atherosclerosis in a model of insulin insufficiency independent of its metabolic effects. Arterioscler. Thromb. Vasc. Biol. 2005;25:1903–1909. doi: 10.1161/01.ATV.0000177813.99577.6b. [DOI] [PubMed] [Google Scholar]
- 8.Zhao S, Zhang C, Lin Y, Yang P, Yu Q, Chu Y, Yang P, Fan J, Liu E. The effects of rosiglitazone on aortic atherosclerosis of cholesterol-fed rabbits. Thromb. Res. 2008;123:281–287. doi: 10.1016/j.thromres.2008.04.011. [DOI] [PubMed] [Google Scholar]
- 9.Singh S, Loke YK, Furberg CD. Long-term risk of cardiovascular events with rosiglitazone: a meta-analysis. JAMA. 2007;298:1189–1195. doi: 10.1001/jama.298.10.1189. [DOI] [PubMed] [Google Scholar]
- 10.Nissen SE, Wolski K. Effect of rosiglitazone on the risk of myocardial infarction and death from cardiovascular causes. N. Engl. J. Med. 2007;356:2457–2471. doi: 10.1056/NEJMoa072761. [DOI] [PubMed] [Google Scholar]
- 11.Huang SL. Liposomes in ultrasonic drug and gene delivery. Adv. Drug Deliv. Rev. 2008;60:1167–1176. doi: 10.1016/j.addr.2008.03.003. [DOI] [PubMed] [Google Scholar]
- 12.Alkan-Onyuksel H, Demos SM, Lanza GM, Vonesh MJ, Klegerman ME, Kane BJ, Kuszak J, McPherson DD. Development of inherently echogenic liposomes as an ultrasonic contrast agent. J. Pharm. Sci. 1996;85:486–490. doi: 10.1021/js950407f. [DOI] [PubMed] [Google Scholar]
- 13.Herbst SM, Klegerman ME, Kim H, Qi J, Shelat H, Wassler M, Moody MR, Yang CM, Ge X, Zou Y, Kopechek JA, Clubb FJ, Kraemer DC, Huang S, Holland CK, McPherson DD, Geng YJ. Delivery of stem cells to porcine arterial wall with echogenic liposomes conjugated to antibodies against CD34 and intercellular adhesion molecule-1. Mol. Pharm. 2010;7:3–11. doi: 10.1021/mp900116r. [DOI] [PMC free article] [PubMed] [Google Scholar]
- 14.Kim H, Moody MR, Laing ST, Kee PH, Huang SL, Klegerman ME, McPherson DD. In vivo volumetric intravascular ultrasound visualization of early/inflammatory arterial atheroma using targeted echogenic immunoliposomes. Invest. Radiol. 2010;45:685–691. doi: 10.1097/RLI.0b013e3181ee5bdd. [DOI] [PMC free article] [PubMed] [Google Scholar]
- 15.Kopechek JA, Haworth KJ, Raymond JL, Douglas Mast T, Perrin SR, Klegerman ME, Huang S, Porter TM, McPherson DD, Holland CK. Acoustic characterization of echogenic liposomes: frequency-dependent attenuation and backscatter. J. Acoust. Soc. Am. 2011;130:3472–3481. doi: 10.1121/1.3626124. [DOI] [PMC free article] [PubMed] [Google Scholar]
- 16.Tiukinhoy-Laing SD, Buchanan K, Parikh D, Huang S, MacDonald RC, McPherson DD, Klegerman ME. Fibrin targeting of tissue plasminogen activator-loaded echogenic liposomes. J. Drug Target. 2007;15:109–114. doi: 10.1080/10611860601140673. [DOI] [PubMed] [Google Scholar]
- 17.Kee PH, Abruzzo TA, Smith DA, Kopechek JA, Wang B, Huang SL, MacDonald RC, Holland CK, McPherson DD. Synthesis, acoustic stability, and pharmacologic activities of papaverine-loaded echogenic liposomes for ultrasound controlled drug delivery. J. Liposome Res. 2008;18:263–277. doi: 10.1080/08982100802354558. [DOI] [PMC free article] [PubMed] [Google Scholar]
- 18.Buchanan KD, Huang SL, Kim H, McPherson DD, MacDonald RC. Encapsulation of NF-kappaB decoy oligonucleotides within echogenic liposomes and ultrasound-triggered release. J. Control. Release. 2010;141:193–198. doi: 10.1016/j.jconrel.2009.09.017. [DOI] [PMC free article] [PubMed] [Google Scholar]
- 19.Shaw GJ, Meunier JM, Huang SL, Lindsell CJ, McPherson DD, Holland CK. Ultrasound-enhanced thrombolysis with tPA-loaded echogenic liposomes. Thromb. Res. 2009;124:306–310. doi: 10.1016/j.thromres.2009.01.008. [DOI] [PMC free article] [PubMed] [Google Scholar]
- 20.Smith DA, Vaidya SS, Kopechek JA, Huang SL, Klegerman ME, McPherson DD, Holland CK. Ultrasound-triggered release of recombinant tissue-type plasminogen activator from echogenic liposomes. Ultrasound Med. Biol. 2010;36:145–157. doi: 10.1016/j.ultrasmedbio.2009.08.009. [DOI] [PMC free article] [PubMed] [Google Scholar]
- 21.Tiukinhoy-Laing SD, Huang S, Klegerman M, Holland CK, McPherson DD. Ultrasound-facilitated thrombolysis using tissue-plasminogen activator-loaded echogenic liposomes. Thromb. Res. 2007;119:777–784. doi: 10.1016/j.thromres.2006.06.009. [DOI] [PMC free article] [PubMed] [Google Scholar]
- 22.Kopechek JA, Abruzzo TM, Wang B, Chrzanowski SM, Smith DA, Kee PH, Huang S, Collier JH, McPherson DD, Holland CK. Ultrasound-mediated release of hydrophilic and lipophilic agents from echogenic liposomes. J. Ultrasound Med. 2008;27:1597–1606. doi: 10.7863/jum.2008.27.11.1597. [DOI] [PMC free article] [PubMed] [Google Scholar]
- 23.Husseini GA, Diaz de la Rosa MA, Richardson ES, Christensen DA, Pitt WG. The role of cavitation in acoustically activated drug delivery. J. Control. Release. 2005;107:253–261. doi: 10.1016/j.jconrel.2005.06.015. [DOI] [PMC free article] [PubMed] [Google Scholar]
- 24.Somaglino L, Bouchoux G, Mestas JL, Lafon C. Validation of an acoustic cavitation dose with hydroxyl radical production generated by inertial cavitation in pulsed mode: application to in vitro drug release from liposomes. Ultrason. Sonochem. 2011;18:577–588. doi: 10.1016/j.ultsonch.2010.07.009. [DOI] [PubMed] [Google Scholar]
- 25.Evjen TJ, Nilssen EA, Fowler RA, Rognvaldsson S, Brandl M, Fossheim SL. Lipid membrane composition influences drug release from dioleoylphosphatidylethanolamine-based liposomes on exposure to ultrasound. Int. J. Pharm. 2011;406:114–116. doi: 10.1016/j.ijpharm.2010.12.026. [DOI] [PubMed] [Google Scholar]
- 26.Holland CK, Apfel RE. An improved theory for the prediction of microcavitation thresholds. IEEE Trans. Ultrason. Ferroelectr. Freq. Control. 1989;36:204–208. doi: 10.1109/58.19152. [DOI] [PubMed] [Google Scholar]
- 27.Apfel RE, Holland CK. Gauging the likelihood of cavitation from short-pulse, low-duty cycle diagnostic ultrasound. Ultrasound Med. Biol. 1991;17:179–185. doi: 10.1016/0301-5629(91)90125-g. [DOI] [PubMed] [Google Scholar]
- 28.Neppiras EA. Subharmonic and Other Low-Frequency Emission from Bubbles in Sound-Irradiated Liquids. J.Acoust.Soc.Am. 1969;46:587–601. [Google Scholar]
- 29.Holland CK, Apfel RE. Thresholds for transient cavitation produced by pulsed ultrasound in a controlled nuclei environment. J. Acoust. Soc. Am. 1990;88:2059–2069. doi: 10.1121/1.400102. [DOI] [PubMed] [Google Scholar]
- 30.Eller A, Flynn HG. Generation of Subharmonics of Order One-Half by Bubbles in a Sound Field. J.Acoust.Soc.Am. 1968;44:368–369. [Google Scholar]
- 31.Hallow DM, Mahajan AD, McCutchen TE, Prausnitz MR. Measurement and correlation of acoustic cavitation with cellular bioeffects. Ultrasound Med. Biol. 2006;32:1111–1122. doi: 10.1016/j.ultrasmedbio.2006.03.008. [DOI] [PubMed] [Google Scholar]
- 32.Collis J, Manasseh R, Liovic P, Tho P, Ooi A, Petkovic-Duran K, Zhu Y. Cavitation microstreaming and stress fields created by microbubbles. Ultrasonics. 2010;50:273–279. doi: 10.1016/j.ultras.2009.10.002. [DOI] [PubMed] [Google Scholar]
- 33.Holland CK, Deng CX, Apfel RE, Alderman JL, Fernandez LA, Taylor KJ. Direct evidence of cavitation in vivo from diagnostic ultrasound. Ultrasound Med. Biol. 1996;22:917–925. doi: 10.1016/0301-5629(96)00083-x. [DOI] [PubMed] [Google Scholar]
- 34.Miller DL, Averkiou MA, Brayman AA, Everbach EC, Holland CK, Wible Jr JH, Wu J. Bioeffects considerations for diagnostic ultrasound contrast agents. J. Ultrasound Med. 2008;27:611–632. doi: 10.7863/jum.2008.27.4.611. quiz 633-6. [DOI] [PubMed] [Google Scholar]
- 35.Nyborg WL. Acoustic Streaming near a Boundary. J.Acoust.Soc.Am. 1958;30:329–339. [Google Scholar]
- 36.Prentice P, Cuschieri A, Dholakia K, Prausnitz M, Campbell P. Membrane disruption by optically controlled microbubble cavitation. Nature Phys Letters. 2005;1:107–110. [Google Scholar]
- 37.Zhong P, Chuong CJ. Propagation of shock waves in elastic solids caused by cavitation microjet impact. I: Theoretical formulation. J. Acoust. Soc. Am. 1993;94:19–28. doi: 10.1121/1.407077. [DOI] [PubMed] [Google Scholar]
- 38.Datta S, Coussios CC, Ammi AY, Mast TD, de Courten-Myers GM, Holland CK. Ultrasound-enhanced thrombolysis using Definity as a cavitation nucleation agent. Ultrasound Med. Biol. 2008;34:1421–1433. doi: 10.1016/j.ultrasmedbio.2008.01.016. [DOI] [PMC free article] [PubMed] [Google Scholar]
- 39.Datta S, Coussios CC, McAdory LE, Tan J, Porter T, De Courten-Myers G, Holland CK. Correlation of cavitation with ultrasound enhancement of thrombolysis. Ultrasound Med. Biol. 2006;32:1257–1267. doi: 10.1016/j.ultrasmedbio.2006.04.008. [DOI] [PMC free article] [PubMed] [Google Scholar]
- 40.McDannold N, Vykhodtseva N, Hynynen K. Targeted disruption of the blood-brain barrier with focused ultrasound: association with cavitation activity. Phys. Med. Biol. 2006;51:793–807. doi: 10.1088/0031-9155/51/4/003. [DOI] [PubMed] [Google Scholar]
- 41.Tung YS, Vlachos F, Choi JJ, Deffieux T, Selert K, Konofagou EE. In vivo transcranial cavitation threshold detection during ultrasound-induced blood-brain barrier opening in mice. Phys. Med. Biol. 2010;55:6141–6155. doi: 10.1088/0031-9155/55/20/007. [DOI] [PMC free article] [PubMed] [Google Scholar]
- 42.Chen D, Wu J. An in vitro feasibility study of controlled drug release from encapsulated nanometer liposomes using high intensity focused ultrasound. Ultrasonics. 2010;50:744–749. doi: 10.1016/j.ultras.2010.02.009. [DOI] [PubMed] [Google Scholar]
- 43.Qiu Y, Luo Y, Zhang Y, Cui W, Zhang D, Wu J, Zhang J, Tu J. The correlation between acoustic cavitation and sonoporation involved in ultrasound-mediated DNA transfection with polyethylenimine (PEI) in vitro. J. Control. Release. 2010;145:40–48. doi: 10.1016/j.jconrel.2010.04.010. [DOI] [PubMed] [Google Scholar]
- 44.Zhou Y, Cui J, Deng CX. Dynamics of sonoporation correlated with acoustic cavitation activities. Biophys. J. 2008;94:L51–L53. doi: 10.1529/biophysj.107.125617. [DOI] [PMC free article] [PubMed] [Google Scholar]
- 45.Kendall DA, MacDonald RC. Characterization of a fluorescence assay to monitor changes in the aqueous volume of lipid vesicles. Anal. Biochem. 1983;134:26–33. doi: 10.1016/0003-2697(83)90258-0. [DOI] [PubMed] [Google Scholar]
- 46.Memoli A, Palermiti LG, Travagli V, Alhaique F. Effects of surfactants on the spectral behaviour of calcein (II): a method of evaluation. J. Pharm. Biomed. Anal. 1999;19:627–632. doi: 10.1016/s0731-7085(98)00229-5. [DOI] [PubMed] [Google Scholar]
- 47.Lin HY, Thomas JL. Factors affecting responsivity of unilamellar liposomes to 20 kHz ultrasound. Langmuir. 2004;20:6100–6106. doi: 10.1021/la049866z. [DOI] [PubMed] [Google Scholar]
- 48.Klibanov AL, Shevchenko TI, Raju BI, Seip R, Chin CT. Ultrasound-triggered release of materials entrapped in microbubble-liposome constructs: a tool for targeted drug delivery. J. Control. Release. 2010;148:13–17. doi: 10.1016/j.jconrel.2010.07.115. [DOI] [PMC free article] [PubMed] [Google Scholar]
- 49.Huang SL, McPherson DD, Macdonald RC. A method to co-encapsulate gas and drugs in liposomes for ultrasound-controlled drug delivery. Ultrasound Med. Biol. 2008;34:1272–1280. doi: 10.1016/j.ultrasmedbio.2008.01.005. [DOI] [PMC free article] [PubMed] [Google Scholar]
- 50.Huang SL, MacDonald RC. Acoustically active liposomes for drug encapsulation and ultrasound-triggered release. Biochim. Biophys. Acta. 2004;1665:134–141. doi: 10.1016/j.bbamem.2004.07.003. [DOI] [PubMed] [Google Scholar]
- 51.Buchanan KD, Huang S, Kim H, Macdonald RC, McPherson DD. Echogenic liposome compositions for increased retention of ultrasound reflectivity at physiologic temperature. J. Pharm. Sci. 2008;97:2242–2249. doi: 10.1002/jps.21173. [DOI] [PMC free article] [PubMed] [Google Scholar]
- 52.Huang SL, Hamilton AJ, Pozharski E, Nagaraj A, Klegerman ME, McPherson DD, MacDonald RC. Physical correlates of the ultrasonic reflectivity of lipid dispersions suitable as diagnostic contrast agents. Ultrasound Med. Biol. 2002;28:339–348. doi: 10.1016/s0301-5629(01)00512-9. [DOI] [PubMed] [Google Scholar]
- 53.Huang SL, Hamilton AJ, Nagaraj A, Tiukinhoy SD, Klegerman ME, McPherson DD, Macdonald RC. Improving ultrasound reflectivity and stability of echogenic liposomal dispersions for use as targeted ultrasound contrast agents. J. Pharm. Sci. 2001;90:1917–1926. doi: 10.1002/jps.1142. [DOI] [PubMed] [Google Scholar]
- 54.Huang S, Kee P, McPherson DD, Macdanold RC. Multi-functional echogenic liposomes for image-guided ultrasound-controlled PPAR agonist delivery. J.Am.Coll.Cardiol. 49:Suppl. 2007;1:365A. [Google Scholar]
- 55.Coussios CC, Holland CK, Jakubowska L, Huang SL, MacDonald RC, Nagaraj A, McPherson DD. In vitro characterization of liposomes and Optison by acoustic scattering at 3.5 MHz. Ultrasound Med. Biol. 2004;30:181–190. doi: 10.1016/j.ultrasmedbio.2003.10.015. [DOI] [PMC free article] [PubMed] [Google Scholar]
- 56.Schroeder A, Avnir Y, Weisman S, Najajreh Y, Gabizon A, Talmon Y, Kost J, Barenholz Y. Controlling liposomal drug release with low frequency ultrasound: mechanism and feasibility. Langmuir. 2007;23:4019–4025. doi: 10.1021/la0631668. [DOI] [PubMed] [Google Scholar]
- 57.Park J, Fan Z, Deng CX. Effects of shear stress cultivation on cell membrane disruption and intracellular calcium concentration in sonoporation of endothelial cells. J. Biomech. 2011;44:164–169. doi: 10.1016/j.jbiomech.2010.09.003. [DOI] [PMC free article] [PubMed] [Google Scholar]
- 58.Evjen TJ, Nilssen EA, Rognvaldsson S, Brandl M, Fossheim SL. Distearoylphosphatidylethanolamine-based liposomes for ultrasound-mediated drug delivery. Eur. J. Pharm. Biopharm. 2010;75:327–333. doi: 10.1016/j.ejpb.2010.04.012. [DOI] [PubMed] [Google Scholar]
- 59.Hitchcock KE, Caudell DN, Sutton JT, Klegerman ME, Vela D, Pyne-Geithman GJ, Abruzzo T, Cyr PE, Geng YJ, McPherson DD, Holland CK. Ultrasound-enhanced delivery of targeted echogenic liposomes in a novel ex vivo mouse aorta model. J. Control. Release. 2010;144:288–295. doi: 10.1016/j.jconrel.2010.02.030. [DOI] [PMC free article] [PubMed] [Google Scholar]
- 60.Laing ST, Kim H, Kopechek JA, Parikh D, Huang S, Klegerman ME, Holland CK, McPherson DD. Ultrasound-mediated delivery of echogenic immunoliposomes to porcine vascular smooth muscle cells in vivo. J. Liposome Res. 2010;20:160–167. doi: 10.3109/08982100903218918. [DOI] [PMC free article] [PubMed] [Google Scholar]


