

Abstract
Although signaling mechanisms inducing cardiac hypertrophy have been extensively studied, little is known about the mechanisms that reverse cardiac hypertrophy. Here, we describe the existence of a similar Akt/forkhead signaling axis in cardiac myocytes in vitro and in vivo, which is regulated by insulin, insulin-like growth factor (IGF), stretch, pressure overload, and angiotensin II stimulation. FOXO3a gene transfer prevented both IGF and stretch-induced hypertrophy in rat neonatal cardiac myocyte cultures in vitro. Transduction with FOXO3a also caused a significant reduction in cardiomyocyte size in mouse hearts in vivo. Akt/FOXO signaling regulated the expression of multiple atrophy-related genes “atrogenes,” including the ubiquitin ligase atrogin-1 (MAFbx). In cardiac myocyte cultures, transduction with constitutively active Akt or treatment with IGF suppressed atrogin-1 mRNA expression, whereas transduction with FOXO3a stimulated its expression. FOXO3a transduction activated the atrogin-1 promoter in both cultured myocytes and mouse heart. Thus, in cardiomyocytes, as in skeletal muscle, FOXO3a activates an atrogene transcriptional program, which retards or prevents hypertrophy and is down-regulated by multiple physiological and pathological stimuli of myocyte growth.
Cardiac hypertrophy occurs during normal physiological growth of the organism and as an adaptive response to pressure or volume stress, mutations in cardiac proteins, or metabolic perturbations (1). Hypertrophy is characterized by an increase in cell size, enhanced protein synthesis and, in some cases, reorganization of the sarcomere. In pathological hypertrophy, the increase in cardiac myocyte size is thought to be a compensatory mechanism to diminish wall stresses that result from hypertension, valvular heart disease, or myocardial infarction. Ventricular hypertrophy is associated with a significantly increased risk of heart failure and malignant arrhythmias (2).
Multiple signaling pathways contribute to the hypertrophic phenotype (3, 4). A number of studies have shown that the serine-threonine kinase Akt (protein kinase B) is an important regulator of myocyte growth (5) and survival (6). Many stimuli activate Akt including the growth factors insulin and IGF1 (7), angiotensin II (8), and mechanical stress (9). Constitutive over-expression of Akt in transgenic mice can lead to enhanced contractility (10), cytoprotection (11), and pathological cardiac hypertrophy (12, 13). Akt signaling is also an important determinant of physiological heart growth and coordinates heart size with body size as the nutritional status of the organism varies (7). The growth factor/Akt signaling pathway up-regulates protein expression through mechanisms involving the activation of the mammalian target of rapamycin (13), eukaryotic initiation factor 4E-binding proteins (14), p70S6k (7), and the inhibition of GSK3β (15).
Relatively little is known about the mechanisms that negatively regulate the hypertrophic phenotype. Hearts undergo a reduction in size in response to a number of environmental parameters including decreased nutritional input and decreased load. For example, patients with anorexia nervosa have markedly reduced heart size (16), and weight reduction in obese patients is associated with reduced heart size in the absence of changes in blood pressure or other hemodynamic parameters (17). Heart size also decreases after left ventricular assist device support (18) and by reductions in volume and pressure overload (19, 20). Marked reductions in cardiac mass also occur following heterotopic heart transplantation (21, 22).
The FOXO subfamily of forkhead transcription factors are a downstream target of Akt. This subfamily consists of three members, FOXO1 (FKHR), FOXO3a (FKHRL-1), and FOXO4 (AFX), which are all inactivated by Akt (23, 24). Phosphorylation by Akt leads to nuclear exclusion and the inhibition of the forkhead transcriptional program. FOXO transcription factors have been implicated in regulating diverse cellular functions including differentiation, metabolism, proliferation, and survival (25, 26). Recently, FOXO transcription factors have also been shown to promote atrophy in skeletal muscle (27, 28). However, the regulation and function of forkhead transcription factors in cardiac myocyte biology has not been studied.
“Atrogenes” describe a family of transcripts that are commonly regulated in several models of skeletal muscle atrophy (29 –32). In skeletal muscle, the atrogene referred to as atrogin-1 or MAFbx is regulated by the growth factor/Akt signaling axis through direct transcriptional regulation by FOXO factors (27, 28, 32). Because of the presence of an F-box motif in atrogin-1, it serves as a substrate-specific component of an SCF complex (30–33). These complexes are E3 ubiquitin ligases that mediate ubiquitin conjugation to proteins, targeting them for proteosomal destruction (34 –36). Recently, Li et al. (37) demonstrated that atrogin-1 inhibits calcineurin-dependent cardiac hypertrophy.
We now show for the first time that the FOXO subfamily of forkhead transcription factors are expressed in cardiac myocytes and regulated by the growth factor/Akt signaling axis in vitro and in vivo. We also show that FOXO controls an atrogene transcriptional program within these cells and that it functions to regulate myocyte size downstream from multiple regulators of cardiac hypertrophy.
EXPERIMENTAL PROCEDURES
Cell Culture and Reagents
Neonatal rat ventricular myocytes (NRVMs) were isolated from neonatal rats by a modification of the Kasten’s technique as described previously (38). Cells were grown in Dulbecco’s modified Eagle’s medium (DMEM) substituted with 10% fetal bovine serum (FBS) and 1% penicillin/streptomycin (Invitrogen, Carlsbad, CA) for serum stimulation or DMEM + 0.5% FBS for serum starvation and plated on gelatin-coated dishes or chamber slides. Adenoviral transduction was carried out overnight, 2 days after plating the cells. NRVMs were subjected to cyclic stretch by means of the Flexercell computer-driven vacuum system as has been previously described (39). NRVMs plated on BioFlex culture plates were placed on a gasketed base plate in a 37 °C, 5% CO2 incubator and subjected to a vacuum of −21 kilopascal at a frequency of 1 Hz applied in a square-wave pattern of strain lasting 0.5 s per cycle for up to 24 h. Using these parameters, this system produces a gradient of deformation across the membrane, with a maximal deformation of 25. Parallel BioFlex culture plates not subjected to stretch served as controls. IGF-1 was purchased from R&D Systems (Minneapolis, MN), LY294002 was bought from Calbiochem, trypsin was acquired from Invitrogen, insulin from Lilly (Indianapolis, IN), and angiotensin II from Sigma.
Adenoviral Constructs
Adenoviral vectors encoding wild-type FOXO3a (WT-FOXO3a) and a nonphosphorylatable, constitutively active form FOXO3a (TM-FOXO3a) were described previously (26). Adenoviral vectors encoding IKB and NIK have been reported elsewhere (28). Replication-defective adenoviral vectors expressing dominant-negative and constitutively active forms of murine Akt tagged with the hemagglutinin epitope were constructed as described previously (40). The dominant-negative Akt mutant (Ad-dnAkt) has alanine residues substituted for threonine at position 308 and serine at position 473. The constitutively active Akt (Ad-myrAkt) has the c-Src myristoylation sequence fused in-frame to the N terminus of the wild-type Akt coding sequence that targets the fusion protein to the membrane. Some assays employed a replication-defective adenoviral vector expressing catalytically inactive GSK3β (KM-GSK3β) where lysine residues at positions 85 and 86 were mutated to methionine and alanine, respectively. Another vector expressed the non-phosphorylatable constitutively active mutant of GSK3β, where the serine residue at position 9 was mutated to alanine (S9A-GSK3β) (41). All constructs were amplified in 293 cells and purified by ultracentrifugation. Viral titers were determined as plaque-forming units. For transduction, myocyte cultures were typically incubated with adenovirus at a multiplicity of infection of 10 –50 for 12 h. Control cultures were infected with an adenoviral vector expressing only the GFP transgene (Ad-GFP) prepared by the same system or Adeno-β-gal, which expresses the lacZ gene from the cytomegalovirus promoter (42). Under these conditions, the transduction efficiency was greater than 90%.
Immunofluorescence Staining
Rat neonatal cardiac myocytes were cultured in gelatin-coated Lab-Tek® coverglass chambers (Nalge Nunc International, Rochester, NY) and transduced with the adenoviral vectors as indicated above. Following an incubation period, cells were washed three times with warm PBS and fixed with 3.7% paraformal-dehyde for 20 min at room temperature. After another washing step with PBS, cells were permeabilized using 0.2% Triton X-100 in PBS for 20 min at room temperature. Blocking was carried out using PBS solution containing 10% FCS, 0.1 N NaN3, and 0.1% Triton X-100. First, antibody incubation was carried out with anti-FKHRL1 (Upstate, Waltham, MA) for 1 h at room temperature at a dilution of 1:100, followed by second antibody incubation with Alexa®-Fluor 597 antibodies (Molecular Probes, Eugene, OR) at a dilution of 1:1000 for 30 min. All antibodies were diluted in PBS + 5% FBS. The slides were washed three times in PBS, the coverglasses were removed, and the cells were mounted using Vectashield® mounting medium containing DAPI (Vector Laboratories, Burlingame, CA). Cells were observed under a fluorescence microscope (NIKON Diaphot, Nikon, Tokyo, Japan) at a wavelength of 565 (red), 400 (DAPI), and 505 nm (green), respectively. Transduction efficiency was determined using the expression of GFP. Control experiments were performed in the absence of primary or secondary antibody, respectively.
Western Immunoblot Analysis
Immunoblot analysis was performed by modification of the procedures described previously (41). Tissue samples were homogenized in lysis buffer. Cells were washed with PBS twice before incubating in lysis buffer consisting of 50 mM Tris-HCl, pH 7.2, 2 mM EDTA, 1% Nonidet P-40, 0.05% SDS, and 250 mM NaCl, 10 mM α-glycerolphosphate, 1 mM vanadate. One tablet of protease inhibitor mixture (Complete Mini®, Roche Diagnostics, Indianapolis, IN) was added just prior to use. After scraping, whole cell lysates were put on ice for 30 min and the protein concentration was determined using the BCA protein assay kit (Pierce, Rockford, IL). 20 –50 μg of protein was fractionated by SDS-PAGE and transferred to a polyvinylidene difluoride membrane (Immobilon-P, Millipore, Billerica, MA). The membrane was blocked using 0.05% T-PBS (1× PBS and 0.05% Tween 20) containing 3% dry milk for 30 min and incubated with the primary antibody overnight at 4 °C. Following a wash step in 0.3% T-PBS containing 1.5% dry milk the membrane was blocked with 3% bovine serum albumin. The second antibody was applied for 1 h at room temperature. After washing the membrane in 0.05% T-PBS for 1 h, the immune complexes were detected by chemiluminescent detection reagents ECL or ECL-Plus (Amersham Biosciences, Piscataway, NJ). To reprobe the membrane, Restore Western blot Stripping Buffer (Pierce) was used. Primary antibodies used in this study were: anti-phosphothreonine 32-FKHRL1 (rabbit polyclonal IgG, Upstate), 1:500; anti-FKHRL1 (Upstate), 1:1000; anti-phospho-Akt (Ser473) (rabbit polyclonal IgG, Upstate), 1:500; anti-Akt-1 (goat polyclonal IgG, Santa Cruz Biotechnology, Santa Cruz, CA), 1:200; anti-HA (mouse monoclonal IgG, Roche), 1:4000; anti-p-FKHR and anti-FKHR (Upstate), 1:1000; or anti-α-tubulin (Oncogene, Carpinteria, CA), 1:4000. As secondary antibodies anti-mouse IgG horseradish peroxidase, anti-goat IgG (Promega, Madison, WI), or anti-rabbit IgG horseradish peroxidase (Promega) were used at a dilution of 1:2000. Immunoblots were quantified using NIH Image® software.
QRT-PCR Analysis
Total RNA was isolated and purified from endothelial cells by RNA TRIzol extraction (Ultraspec™-II RNA Isolation System, Biotecx, Houston, TX). RNA (2 μg) was treated (30 min at 37 °C) with amplification grade DNase I (Invitrogen). cDNA was produced using Taqman reverse transcription (Invitrogen) kits. Real-time PCR (QRT-PCR) was performed in triplicate on an ABI-Prism 7900 using SYBR Green I as a double-stranded DNA-specific dye according to the manufacturer’s instruction (PE-Applied Biosystems, Cheshire, Great Britain) using SYBR® Green PCR Master Mix (1:1, PE-Applied Biosystems), forward and reverse primers (200 nM each), and sample RNA (90 ng). To standardize the quantitation of the selected genes, glyceraldehyde-3-phosphate dehydrogenase from each sample was quantified by QRT-PCR and the selected genes were normalized to glyceraldehyde-3-phosphate dehydrogenase. Primers used were as follows: rat atrogin-1 forward, 5′-CAAGGCCCCAAACCAGTAAC-3′, reverse 5′-GGCAGGGAACGTCTAATAATGG-3′; glyceraldehyde-3-phosphate dehydrogenase forward, 5′-ACAGCCTCAAGATCATCAGCAA-3′, and reverse 5′-CCATCACGCCACAGTTTCC-3′; rat MuRF-1 forward, 5′-GCCATCCTGGACGAGAAGAAG-3′, and reverse 5′-AGCGGCTTG-GCACTCAAG-3′. Primers were designed to be compatible with a single QRT-PCR thermal profile (95 °C for 10 min, and 40 cycles of 95 °C for 30 s and 60 °C for 1 min) such that multiple transcripts could be analyzed simultaneously. Accumulation of the PCR product was monitored in real time (PE-Applied Biosystems), and the crossing threshold (Ct) was determined using PE-Applied Biosystems software. For each set of primers, a no template control and a no reverse amplification control were included. Post-amplification dissociation curves were assessed to verify the presence of a single amplification product in the absence of DNA contamination. -Fold changes in gene expression were determined using the Ct method.
Luciferase Reporter Assays
For in vitro assays, rat neonatal cardiac myocytes were cultured in 6-well chambers and transduced with replication-defective adenoviral vectors as indicated overnight. Transient transfection was carried out using Lipofectamine transfection reagent (Invitrogen) in 6-well plates with the atrogin-1 promoter-luciferase reporter and Renilla control plasmid (Promega) for 4 h according to a protocol provided by the manufacturer. The atrogin promoter-luciferase reporter constructs have been described previously (28). Cell extracts were prepared 24 h post-transfection by using a luciferase cell lysis buffer (Promega). Luciferase reporter activity was assessed on a luminometer with a luciferase assay system (Promega) as suggested by the manufacturer. For in vivo studies, 109 pfu of adenovirus mixed with 20 μg of atrogin-1 promoter-luciferase reporter (28) and 0.5 μg of Renilla reporter plasmid were injected into the left ventricle and animals were sacrificed 1 week thereafter. Hearts were removed, the left ventricular wall excised and homogenized in luciferase cell lysis buffer (Promega) at 4 °C. Dual luciferase promoter assays were performed and atrogin-1 activity was normalized to Renilla.
Assessment of Cardiomyocyte Size in Vitro
Rat neonatal cardiac myocytes were cultured on Lab-Tek® chamber slides for 24 h. Hypertrophy was induced by incubation with either IGF-1 or insulin for 48 h. 24 h after incubation with growth factors, cells were transduced with replication-defective adenoviruses expressing FOXO3a. After 24 h, i.e. 48 h after starting the experiment, cells were fixed with 4% paraformaldehyde and stained for the cardiac-specific marker α-tropomyosin. Images were analyzed with NIH/OpenLab® software to determine cell surface area. For stretch experiments, neonatal rat ventricular cardiac myocytes were grown on Bioflex® six-well plates, transduced with the adenoviral vectors indicated and stretched for 24 h. At the end of the experiment, cells were photographed under green fluorescent light and measurements of cell size were performed employing NIH/OpenLab® software.
Mouse Strains
CIRKO mice were generated and genotyped as described previously (7). Wild-type mice were injected with insulin, 1 mg/kg of body weight, intravenously 10 min before being sacrificed. Transgenic mice overexpressing a constitutively active form of Akt1 (myrAkt1) in the heart (6) were generated by crossing α-MHC-tTA mice with Tet-myr-Akt1 mice (43), which express myrAkt under the control of a tetracycline-responsive promoter.2 Akt-1-deficient mice were described previously (44). All mice were fed normal chow ad libidum. Transaortic constriction was performed as described previously (45). Animals were anesthetized with averdin and following thoracic incision, the hearts were taken out and immediately snap frozen in liquid nitrogen. Heart tissue was homogenized in cell lysis buffer (Cell Signaling, Beverly, MA) substituted with one tablet of protease inhibitor (Complete Mini®, Roche) and processed for Western blotting. All animal studies were approved by the institutional animal care and use committee of Boston University School of Medicine.
In Vivo Measurements of Cell Size and in Vivo Gene Transfer
Gene transfer was carried out by injection of 109 pfu of either Ad-WT-FOXO3a or Ad-GFP (control) into the left ventricular wall of wild-type mice. After 7 days, hearts were excised and embedded in OCT compound. Frozen tissue sections were then stained for FKHRL-1 (Upstate 1:100) to detect transgene expression, wheat germ agglutinin staining was used to determine cell boundaries, and slides were mounted with DAPI for nuclear staining. Fifty FOXO3a positive cells were identified for each mouse heart and cell size was quantified with OpenLab Image software.
Preparation of cRNA and Microarray Analysis
Extraction of RNA from frozen hearts of double transgenic positive mice was carried out using TRIzol (Ultraspec™-II RNA Isolation System, Biotecx). cDNA was generated using poly(dT) primer incorporating T7 promoter in the Superscript Choice system (Invitrogen) according to the Affymetrix protocol (Affymetrix, Santa Clara, CA). Resulting cDNA was used to generate biotin-labeled cRNA by incorporating biotinylated CTP and UTP using the ENZO Bioarray. Subsequently samples were hybridized to Affymetrix GeneChip® Mouse Expression Set 430 microarrays and bound sequences were quantified by staining and scanning according to Affymetrix protocols. Hybridization data for double transgenic positive mice hearts were obtained at baseline (before the induction of the transgene Akt1), 2 weeks after the induction of the transgene Akt1, and 2 days after the repression of the transgene. Following data acquisition, the scanned images were quantified using MAS 5.0 software (Affymetrix) yielding a signal intensity for each probe on the GeneChip. Analysis of variance was performed by calculating the false discovery rates from analysis of variance p values in the selected transcripts with false discovery rates <1.
Statistical Analysis
All data were compared by Student’s t test using Stat View 4.5 (Abacus Software, Burlington, MA). Data are expressed as mean ± S.E. for the number of independent experiments indicated. A p < 0.05 was considered to be significant.
RESULTS
FOXO Transcription Factors Are Downstream Targets of Growth Factor Signaling in Cardiac Myocytes in Vitro
Because FOXO transcription factors have not been studied previously in cardiac myocytes, we first investigated whether the growth factor/Akt/forkhead signaling axis is functional in this cell type. As shown in Fig. 1A, stimulation of cardiac myocytes with serum or IGF-1 increased the phosphorylation of Akt, FOXO1 (FKHR), FOXO3a (FKHRL-1), and FOXO4 (AFX). In a separate set of experiments, stimulation of cardiac myocytes with insulin led to increases in the phosphorylation of Akt and the three FOXO transcription factors (Fig. 1B). These effects were PI 3-kinase dependent because treatment with LY294002 blocked both Akt and FOXO factor phosphorylation. Phosphorylation of the FOXO subclass of forkhead transcription factors determines its intracellular distribution.
Fig. 1. FOXO regulation in cardiac myocytes in vitro.

Rat neonatal ventricular myocytes were cultured in the presence or absence of serum, the growth factors (IGF (A) and insulin (B)), or the PI 3-kinase inhibitor LY294002 (B). Levels of FOXO1, FOXO3a, FOXO4 protein and phosphorylation were determined with specific antibodies directed to total protein and the phosphorylation sites on serine 256 (FOXO1), threonine 32 (FOXO3a), and serine 193 (FOXO4), respectively. The phosphorylation status of Akt was also assessed at serine 473. Western blot membranes were stripped and reprobed for tubulin to compare loading in each lane. The Western blots shown are representative of three or more independent experiments.
To test whether FOXO3a localization is regulated by Akt signaling, myocytes were co-transduced with adenoviral vectors expressing constitutively active or dominant-negative Akt and WT-FOXO3a or TM-FOXO3a. TM-FOXO3a has alanine residues substituted for serine/threonine residues at positions 32, 253, and 315 in FOXO3a, and it is constitutively active because it cannot be inactivated by phosphorylation (24, 46). Co-transduction of Ad-WT-FOXO3a and Ad-myrAkt resulted in exclusion of FOXO3a from the nucleus, whereas co-transfection of Ad-WT-FOXO3a and Ad-dnAkt caused a predominantly nuclear staining pattern of FOXO3a (Fig. 2). In contrast, the nuclear localization of TM-FOXO3a was not influenced by transduction with either Ad-dnAkt or Ad-myrAkt. Collectively, these data show that all FOXO forkhead factors are expressed in cardiac myocytes and that they can be regulated by the PI 3-kinase/Akt signaling axis. Further analyses focused on FOXO3a because of the availability of adenoviral vectors that express this isoform.
Fig. 2. FOXO3a is regulated by Akt signaling.

Subcellular localization of adenovirus-encoded WT-FOXO3a and TM-FOXO3a proteins. Cells were transduced with FOXO3a or Akt (constitutively active, MyrAkt; dominant-negative, DnAkt) replication-defective adenoviruses overnight as indicated. Subcellular FOXO3a distribution was determined with anti-FKHRL-1 and a rhodamine-conjugated secondary antibody by immunofluorescence. Upper left panel shows GFP, lower left panel illustrates nuclear staining (DAPI), upper middle panel indicates FOXO3a staining (rhodamine), and lower middle panel illustrates merged images for FOXO3a and DAPI. Upper and lower right panels depict higher magnification images of cells from FOXO3a-stained or FOXO3a- and DAPI-merged images from the middle panels that are indicated by the white arrows.
To test whether overexpression of FOXO3a affects upstream signaling, rat neonatal ventricular myocytes were transduced with adenoviral vectors expressing TM-FOXO3a or WT-FOXO3a and the activating phosphorylation of Akt was assessed by Western blot analysis. As shown in Fig. 3, transduction with TM-FOXO3a or WT-FOXO3a increased the phosphorylation of Akt at Ser473, indicative of feedback regulation.
Fig. 3. Overexpression of FOXO3a promotes Akt phosphorylation.
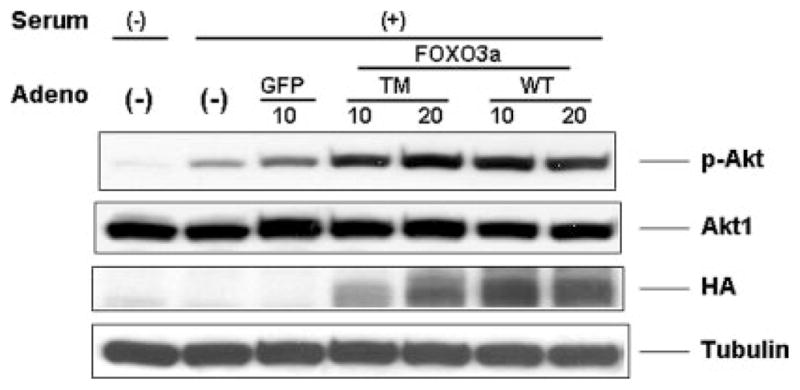
Rat neonatal ventricular myocytes were cultured in the presence or absence of serum. Cells were transduced with FOXO3a- or GFP-expressing replication-defective adenoviral vectors overnight. Levels of Akt protein and phosphorylation were determined with specific antibodies directed to total Akt1 protein and the phosphorylation at serine 473. Transgene expression was determined by anti-hemagglutinin antibody. Membranes were stripped and reprobed with tubulin as a loading control for each lane. This Western blot is representative of three independent experiments. TM, triple-mutant; HA, hemagglutinin.
Forkhead Transcription Factors Are Downstream Targets of Growth Factor/Akt Signaling in Heart in Vivo
Several mouse models were employed to analyze FOXO3a regulation in the heart in vivo (Fig. 4). Cardiac insulin receptor knock-out (CIRKO) mice have a small heart phenotype because of impaired Akt signaling (7). Compared with wild-type mice (WT), CIRKO mice displayed reduced levels of Akt and FOXO3a phosphorylation. In contrast, intravenous injection of insulin in wild-type mice led to increases in the phosphorylation of FOXO3a and Akt. To provide evidence that the observed effect on FOXO3a phosphorylation was because of Akt activation, we performed Western blotting in transgenic mouse hearts that inducibly overexpress a constitutively active form of Akt1. In this model, the induction and activation of Akt by phosphorylation was paralleled by an increase in the phosphorylation of FOXO3a. Conversely, mice that are homozygous null for the Akt1 allele displayed low levels of FOXO3a phosphorylation in the heart. Taken together, these data indicate that the growth factor-Akt signaling axis regulates forkhead transcription factor phosphorylation in vivo.
Fig. 4. Growth factor-Akt-FOXO signaling axis in mouse hearts in vivo.

Different transgenic mouse models were employed to study the regulation of FOXO3a in vivo. The mouse models were: CIRKO-insulin receptor knock-out mice; myrAkt-TG, transgenic mice with cardiac specific overexpression of Akt-1; Akt1−/−, Akt1 homozygous null mice. Also, wild-type mice were injected with insulin, 1 mg/kg body weight, and hearts were harvested after 10 min for analysis. Left ventricles were homogenized and cell lysates were used for Western blotting. Membranes were probed with anti-Akt1, anti-p-Akt (Ser473), anti-p-FOXO3a (Thr32), and anti-FOXO3a. Membranes were stripped and re-probed with tubulin as a loading control for each lane. Each Western blot is representative of three or more independent experiments. C, control (wild-type); iv, intravenously; TG, transgenic.
Regulation of FOXO Phosphorylation under Conditions of Pathological Hypertrophy
Angiotensin II action on cardiac myocytes can contribute to the increase in cardiac mass during pathological hypertrophy. When NRVM were incubated with angiotensinogen II in vitro, we observed a significant increase in Akt phosphorylation that was accompanied by enhanced phosphorylation of FOXO3a (Fig. 5). To study activation of the Akt-forkhead signaling axis under conditions of pathological hypertrophy in vivo, a pressure overload model of transaortic constriction was employed. Western blot analysis of hearts prepared 1 week following TAC showed a significant activation of Akt that was paralleled in an increase in phosphorylation of FOXO3a (Fig. 5). Taken together, our data indicate that the activity of the Akt-FOXO3a signaling axis can be modulated by mediators of pathological hypertrophy both in vitro and in vivo.
Fig. 5. Regulation of FOXO3a by pathological hypertrophic stimuli.
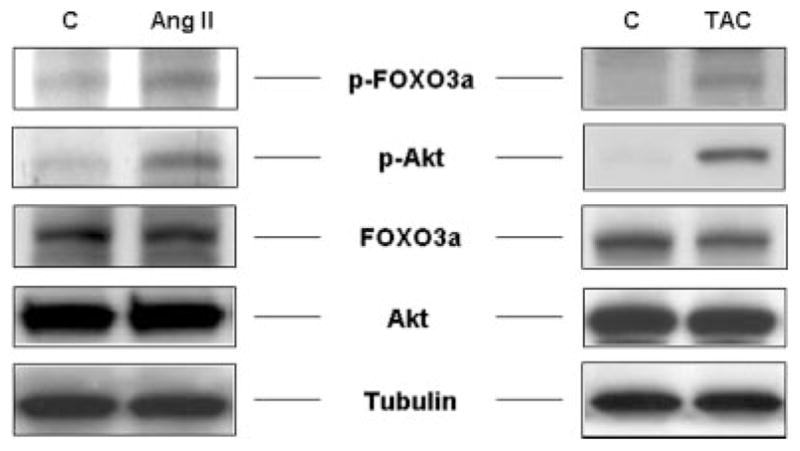
NRVM were incubated with angiotensin II (AngII, 10−7 M) in vitro for 10 min. Transaortic constriction (TAC) was performed on C57BL/6 for 7 days. Lysates were used for Western blotting employing anti-Akt1 antibodies. Membranes were stripped and reprobed for p-Thr32-FOXO3a and total FOXO3a protein. Tubulin indicates equal loading for each lane. Each Western blot is representative of three or more independent experiments. C, control.
FOXO3a Regulates Heart Size in Response to Growth Factor Signaling and Cardiac Stretch in Vitro
To investigate the effects of FOXO3a on cardiac myocyte size in vitro, neonatal rat ventricular myocytes were incubated with IGF-1 in the presence or absence of FOXO3a-adenoviral vectors. Incubation with IGF-1 induced a ~30% increase in cardiac myocyte size compared with control, whereas growth factor deprivation led to a small, but statistically significant decrease in cell size. The IGF-mediated increase in myocyte size was blocked by transduction with TM-FOXO3a (Fig. 6). Transduction with WT-FOXO3a, which can be inactivated by growth factor signaling, partially inhibited the hypertrophic effect of IGF-1 on myocyte size.
Fig. 6. FOXO3a inhibits growth factor-induced cardiac myocyte hypertrophy in vitro.
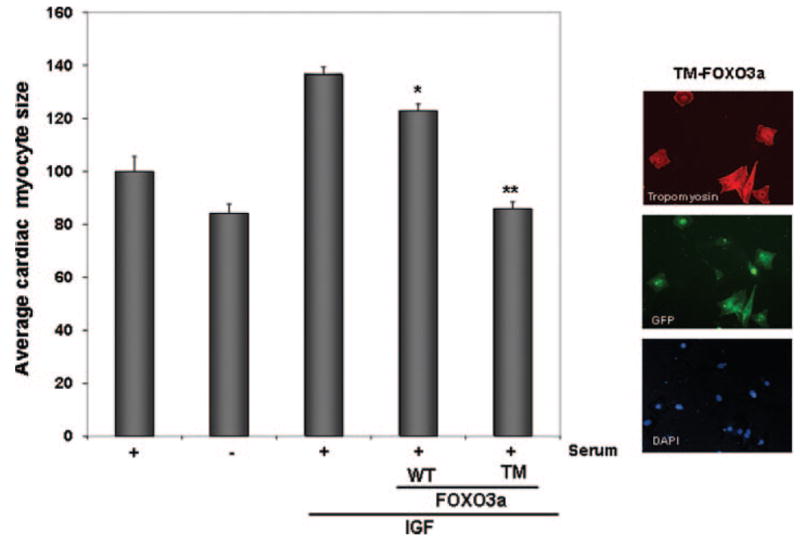
NRVM were incubated in DMEM + 10% FBS on Lab-Tek® chamber slides in the presence or absence of IGF for 48 h. Parallel cultures of cells were also incubated in the absence of serum. After 24 h of IGF-1 incubation, cardiac myocytes were transduced with replication-defective adenoviral vectors encoding GFP (control), WT-FOXO3a, or TM-FOXO3a. Cardiomyocytes were identified by cardiac-specific staining for tropomyosin. Expression of the transgene was assessed by green fluorescent protein (the FOXO vectors also express GFP). Cell size was quantified 24 h following transduction using OpenLab® software. Data are presented as mean ± S.E. for 3 independent experiments (*, p < 0.05; **, p < 0.01 versus IGF).
Cardiac stretch has been shown to induce hypertrophy through G-protein-coupled receptor activation of Akt signaling (9, 47). To test whether FOXO3a inhibits hypertrophy induced by this stimulus, myocytes were seeded and stretched for 24 h. Stretch led to an increase in both Akt and FOXO3a phosphorylation, which was accompanied by an ~35% increase in cardiac myocyte size (Fig. 7). The increase in cardiac cell size was blocked when cells were transduced with TM-FOXO3a, whereas transduction with WT-FOXO3a partially inhibited the hypertrophic response.
Fig. 7. FOXO3a inhibits stretch-induced cardiac myocyte hypertrophy in vitro.

NRVM were plated on Bioflex® culture plates, transduced with the indicated vectors, and stretched for 24 h as described under “Experimental Procedures.” Left panel, cell lysates were used for Western blotting to assess Ser473-Akt and Thr32-FOXO3a following stretch (S) and non-stretch (NS). Membranes were stripped and reprobed for tubulin as loading control. The Western blot is representative of three or more experiments. Right panel, bar graph indicating cardiomyocyte size. Cells were fixed and myocyte surface area was calculated employing NIH/OpenLab® software. Data are presented as mean ± S.E. for 3 independent experiments (*, p < 0.05; **, p < 0.01 versus stretch control).
FOXO3a Gene Transfer Reduces Cardiac Myocyte Size in Vivo
Adenoviral vectors expressing WT-FOXO3a or GFP were injected in the anterior left wall of wild-type mice. One week following adenoviral vector injection, the animals were sacrificed and a fluorescence-immunohistologic analysis of cell size in frozen sections was performed. Expression of the transgene was assessed by immunostaining for FOXO3a or by the detection of GFP immunofluorescence. Cell boundaries were determined by staining with wheat germ agglutinin (Fig. 8A). Transduction with FOXO3a caused a significant decrease in myocyte size when compared with the control virus that expresses GFP (Fig. 8B). The decrease in cell size was not accompanied by increased TUNEL staining in adjacent sections (data not shown).
Fig. 8. In vivo FOXO3a gene transfer leads to reduction in cardiac cell size in mice.

Adenoviral vectors expressing WT-FOXO3a or GFP were injected into the left ventricular wall of mice (109 pfu). A, 1 week after transduction, animals were sacrificed and expression of the transgene was determined by immunofluorescence staining for FOXO3a (left panels). Cell boundaries in the same sample were characterized by wheat germ agglutinin (WGA) staining (middle panels). Nuclear staining was employed using DAPI mounting medium. The right panels depict merged FOXO3a/WGA/DAPI images. Arrows indicate transgene positive cells. Lower panels indicate higher magnification of the cardiac myocytes depicted by white arrows. Transduced cells are a smaller size when compared with transgene-negative surrounding cardiac myocytes. B, quantification of cell size in both experimental groups. Data are presented as mean ± S.E. (**, p < 0.01). Transduced cells (n = 50) were compared with similar sections in the GFP group.
FOXO3a-mediated Regulation of Atrogenes in Cardiac Myocytes
Atrogenes were originally identified in skeletal muscle as a set of genes that are coordinately regulated during rapid loss of muscle mass (29, 31, 32). Because signaling through the IGF pathway dramatically modulates both skeletal and cardiac muscle cell size, we looked for similar regulation in cardiomyocytes in vivo by performing microarray analysis on transgenic mice that inducibly express a constitutively active form of Akt under the control of a cardiac-specific promoter. Transgene induction for 2 weeks was accompanied by a 50.7% (n = 4, p < 0.01) increase in heart/weight to body weight ratio, and the deactivation of transgene expression for 2 days led to the partial reversal of cardiac hypertrophy by 2 days (14.1%, n = 4, p < 0.05). Microarray analyses were employed to characterize the regulation of atrogenes under conditions of Akt activation/deactivation (Table I). Atrogin-1 (MAFbx) expression was suppressed 3.5-fold during Akt activation, whereas Akt transgene deactivation was associated with a 4.4-fold activation of atrogin-1 relative to control hearts. Other atrogenes identified in skeletal muscle that were suppressed upon Akt transgene induction and induced upon Akt repression in cardiac myocytes include cathepsin L and ubiquitination factor E4B (Table I). On the other hand, expression of insulin-like growth factor binding protein 5 (Igfbp5) was stimulated by Akt and reduced upon Akt suppression.
Table I.
Atrogenes significantly regulated in Akt1 transgenic hearts
| Gene name | MyrAkt induction: 2 weeks | p value | MyrAkt induction: 2 weeks/suppression: 2 days | p value | |
|---|---|---|---|---|---|
| -fold change | -fold change | ||||
| MAFbx | Atrogin-1 | −3.5 | <0.01 | +4.4 | <0.01 |
| Ube4b | Ubiquitination factor E4B | −1.5 | <0.01 | +1.9 | <0.01 |
| Ctsl | Cathepsin L | −1.3 | <0.01 | +1.7 | <0.01 |
| Igfbp5 | Insulin-like growth factor 1 binding protein 5 | +3.1 | <0.01 | −1.3 | <0.01 |
To analyze atrogene regulation in greater detail, QRT-PCR analysis was performed on atrogin-1 and MuRF-1 in cultured cardiac myocytes. Serum starvation led to an increase in atrogin-1 expression that was reversed by the inclusion of insulin in the media (Fig. 9A). Similarly, insulin treatment produced a decrease in the expression of another muscle atrophy specific Ub-protein ligase MuRF-1 (33), which was not represented on the DNA microarray. In separate experiments, IGF-1 treatment repressed MuRF-1 expression, whereas transduction with adenoviral vectors expressing TM-FOXO3a led to an increase in expression (Fig. 9B). Stimulation with IGF-1 also repressed atrogin-1 expression and transduction with WT-FOXO3a or TM-FOXO3a led to a dose-dependent increase in expression (Fig. 9C). The non-phosphorylatable mutant FOXO3a was more potent at inducing atrogin-1 transcripts than wild-type FOXO3a.
Fig. 9. FOXO3a induces expression of the ubiquitin ligases atrogin-1 and MuRF-1 in vivo.

A, NRVM were cultured in DMEM + 10% FBS (Serum +) or DMEM + 0.5% FBS (Serum −) in the presence or absence of insulin. Quantitative RT-PCR for atrogin-1 and MuRF-1 was performed. Data are presented as mean ± S.E. B, FOXO3a regulates MuRF-1 expression in cardiac myocytes. C, FOXO3a regulates atrogin-1. QRT-PCR analysis in NRVM following adenoviral gene transfer of WT- or TM-FOXO3a. Parallel cultures were incubated with IGF-1 (50 ng/ml) overnight. Data are expressed as mean ± S.E. C, control; TM, triple-mutant.
Additional analyses examined the regulation of the atrogin-1 gene in cultured myocytes using a luciferase reporter plasmid containing a 3.5-kilobase pair fragment of the promoter (28) (Fig. 10A). Cells were transduced with the indicated adenoviral vectors followed by transient transfection with the atrogin-1 promoter-reporter plasmid. Transduction with a constitutively active form of Akt1 suppressed atrogin-1 promoter activity, whereas a dominant-negative form of Akt1 activated the promoter. Transduction with the FOXO3a vectors led to a marked elevation of atrogin-1 promoter activity. The nonphosphorylatable mutant was more effective at activating the promoter than the wild-type FOXO3a vector. In contrast, adenoviral vectors expressing IκB, NIK, and constitutively active (S9A) or dominant-negative (KM) GSK3β had no detectable effect on promoter activity, indicating the specificity of the Akt/FOXO-mediated regulation. Last, the atrogin-1 promoter was injected together with adenoviral vectors expressing β-galactosidase, WT-FOXO3a, or TM-FOXO3a into the left ventricular wall of mouse hearts (Fig. 10B). Promoter activity was assessed 3 days following gene transfer (Fig. 10C). Relative to control (β-galactosidase) WT-FOXO3a increased the in vivo activity of the atrogin-1 promoter 6 – 8-fold, whereas the TM-FOXO3a vector increased atrogin-1 promoter activity 10 –12-fold.
Fig. 10. Atrogin-1 promoter activity is regulated by the Akt-FOXO signaling axis in vitro and in vivo.

A, NRVM were transduced with the indicated adenoviral vectors and transfected with an atrogin-1-luciferase or Renilla reporter construct, respectively. Luciferase/Renilla activity was measured 12 h following transfection. Data are presented as mean ± S.E. for five independent experiments conducted in triplicate. B, adenoviral vectors expressing β-galactosidase (β-gal), WT-Ad-FOXO3a, or TM-FOXO3a (109 pfu each injection) were delivered to the left ventricular wall of mice together with 20 μg of the atrogin-1 promoter plasmid. Hearts were snap-frozen 3 days following gene delivery and transgene expression was determined by Western blotting employing anti-hemagglutinin (HA) antibody. Membranes were stripped and reprobed for p-FOXO3a. Tubulin indicates the same loading in each lane. C, bar graph indicating activity of the luciferase construct in vivo. Data are presented as mean ± S.E. for three animals in each group.
DISCUSSION
Left ventricular hypertrophy is characterized by an increase in cardiac myocyte size. Cardiac myocyte size is determined by the relative balance of protein synthesis and degradation. In this study we characterized the FOXO transcription factors and describe their functional significance in controlling atrogenes and cell size in cardiac myocytes. All three FOXO subfamily members, FOXO1, FOXO3a, and FOXO4, are present in myocytes and they are regulated by phosphorylation in response to multiple hypertrophic stimuli. Moreover, we demonstrate that one of these factors (FOXO3a) functions as a negative regulator of cardiac myocyte size that controls the expression of an atrogene regulatory program.
The growth factor/PI 3-kinase/Akt signaling axis is a major regulator of heart size. Overexpression of the IGF-1 receptor (48), PI 3-kinase (49), or Akt (10, 12, 13) leads to a significant increase in heart weight/body weight ratio in mice. Conversely, mice lacking the insulin receptor in cardiac myocytes display a small heart phenotype due, at least in part, to diminished PI 3-kinase/Akt signaling (7). Activation of this signaling system appears to be a predominant feature of physiological heart growth because mice expressing a dominant-negative form of PI 3-kinase in cardiac myocytes display hypertrophy in response to pressure overload but not exercise training (50). Furthermore, overexpression of Akt in cardiac myocytes in culture will lead to cell enlargement in the absence of myofibrillar reorganization or activation of fetal-type cardiac genes, which are typically associated with pathological hypertrophy (7). However, it appears that this signaling system also contributes to the pathological hypertrophic process because it is activated by pressure overload (51) and chronic overexpression of Akt is sufficient to produce pathological hypertrophy in transgenic mice (12, 13). We now show that the regulation of FOXO transcription by PI 3-kinase/Akt signaling is an important determinant of cardiac myocyte size as it is in skeletal muscle (31). Multiple pro-hypertrophic stimuli, including growth factors, stretch, angiotensin II, and pressure overload, lead to the inactivation of FOXO via Akt-mediated phosphorylation (Fig. 11). Conversely, conditions that diminish PI 3-kinase/Akt signaling, such as nutrient deprivation (7), will promote FOXO translocation to the nucleus and activate genes that are associated with an “atrophy program” (29, 52).
Fig. 11. Proposed scheme for Akt/FOXO-mediated regulation of cardiac myocyte size.
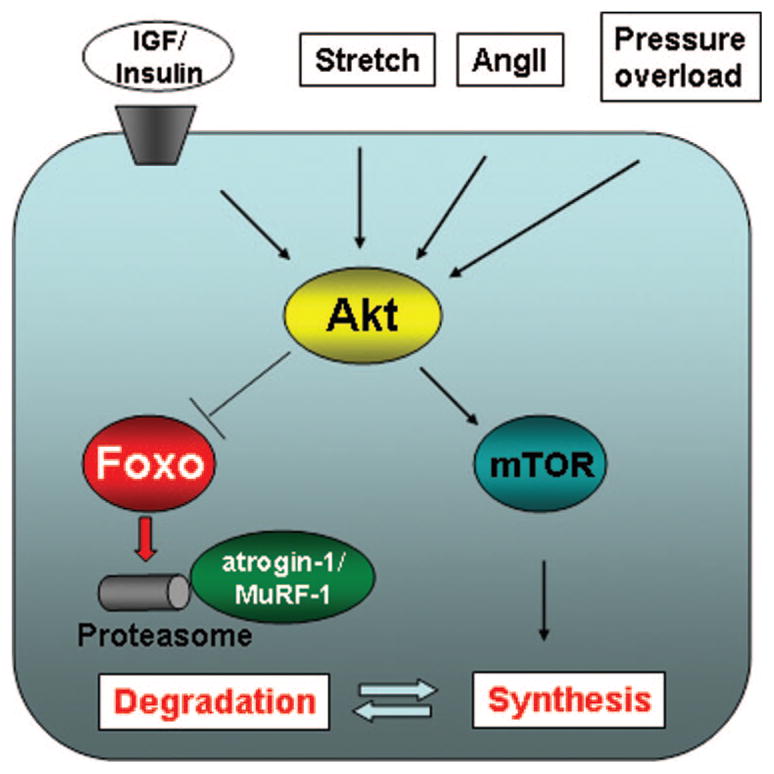
Multiple inputs including growth factors, angiotensin II, stretch, and pressure overload lead to Akt phosphorylation. Akt induces hypertrophy in cardiac myocytes by increasing protein synthesis through the mammalian target of rapamycin-dependent pathways. Akt activation also leads to inactivation of forkhead transcription factors through phosphorylation. FOXO transcription factors activate atrogenes, including the ubiquitin ligases atrogin-1 and MuRF-1, which promote proteinolysis.
In addition to the demonstration that FOXO factors are regulated downstream of Akt signaling in cardiac myocytes, our study also found that overexpression of FOXO3a promoted the activating phosphorylation of Akt. These data suggest that FOXO3a can feed back onto the Akt signaling pathway in cardiac myocytes in a manner that would serve to minimize the increase in FOXO activity. These observations are in contrast to a recent report that found that FOXO4 overexpression inhibits Akt signaling in tumor cells (53).
Our study identified a number of potential transcriptional targets of Akt/FOXO signaling in the heart that may be involved in the net loss of cardiac mass. These proteins include the ubiquitination factor E4B, the E3 ubiquitin ligases atrogin-1/MAFbx and MuRF-1, which target proteins for proteosomal protein degradation, cathepsin L, a lysosomal proteinase, and Igfbp5. These gene products are coordinately induced, and Ig-fbp5 repressed, in various types of skeletal muscle atrophy (28, 31, 32). Atrogin-1 is induced in skeletal muscle during fasting (30), sepsis (54), renal failure (30), cachexia (30), and disuse/denervation (33). Mice lacking the atrogin-1 gene show diminished muscle loss during disuse atrophy (33) and both ubiquitin ligases are induced by forkhead transcription factors, FOXO1 and -3, in skeletal muscle (33). Interestingly, the regulation of the ubiquitination factor E4B, which acts in combination with E3 ligases to increase the efficiency of ubiquitin conjugation (55), paralleled the regulation of the atrogin-1 and MuRF-1 ubiquitin ligases. Cathepsin L is a lysosomal cysteine protease. Although lysosomes have a limited role in intracellular proteolysis, cathepsin L is markedly induced in skeletal muscle of septic and fasted rodents, where it may be involved in the turnover of extracellular components during atrophy (56). Ig-fbp5 modulates the response to IGF-1 (57) and it is dramatically down-regulated in several conditions of skeletal muscle atrophy (29). Results from transgenic mice models suggests that it could be a transcriptional target of FOXO1 (58). Collectively, these data show that the Akt/FOXO signaling axis promotes transcriptional changes in the heart that are highly analogous to the transcriptional changes that occur in skeletal muscle during atrophy, suggesting that similar mechanisms underlie the reduction in cell size in both systems.
Recently Li et al. (37) demonstrated that atrogin-1 is expressed in heart and inhibits calcineurin-dependent cardiac hypertrophy by priming calcineurin for ubiquitin-mediated proteolysis. It has been suggested that hypertrophy induced by IGF and calcineurin occurs via distinct signaling pathways (59). However, our current findings and the data of Li et al. (37) indicate that atrogin-1 might function as a common negative regulator of myocyte hypertrophy that links these two signaling systems. In this model, a decrease in PI 3-kinase/Akt signaling will lead to FOXO-mediated up-regulation of atrogin-1 and result in the targeting of calcineurin to the atrogin-1-SCF ubiquitin ligase complex. Thus NFAT-mediated hypertrophy will be rendered inoperable in hearts that are subjected to conditions that diminish PI 3-kinase/Akt signaling.
In summary, these data suggest that the FOXO transcription factors are negative regulators of cardiac hypertrophy. They are likely to be involved in the reverse remodeling of the heart that occurs during support with left ventricular assist devices (19), treatment of hypertension (60), nutrient deprivation, and weight loss (7). Because excessive cardiac hypertrophy is associated with an increased risk of sudden cardiac arrest and heart failure, further studies on the FOXO transcriptional regulators may result in the development of novel therapeutic interventions for the treatment of heart disease.
Footnotes
The abbreviations used are: IGF, insulin-like growth factor; NRVMs, neonatal rat ventricular myocytes; DMEM, Dulbecco’s modified Eagle’s medium; WT-FOXO3a, wild-type FOXO3a; GSK3β, glycogen synthase kinase 3β; FBS, fetal bovine serum; pfu, plaque forming unit(s); GFP, green fluorescent protein; PBS, phosphate-buffered saline; DAPI, 4,6-diamidino-2-phenylindole; QRT, quantitative reverse transcriptase; Ct, crossing threshold; PI, phosphatidylinositol; CIRKO, cardiac insulin receptor knock-out; Igfbp5, insulin-like growth factor binding protein 5.
I. Shiojima and K. Walsh, unpublished data.
This work was supported by National Institutes of Health United States Public Health Service Grants HL66957, AR40197, AG17241, and AG15052 (to K. W.) and DK062307 (to S. L.).
References
- 1.Hunter JJ, Chien KR. N Engl J Med. 1999;341:1276–1283. doi: 10.1056/NEJM199910213411706. [DOI] [PubMed] [Google Scholar]
- 2.Levy D, Garrison RJ, Savage DD, Kannel WB, Castelli WP. N Engl J Med. 1990;322:1561–1566. doi: 10.1056/NEJM199005313222203. [DOI] [PubMed] [Google Scholar]
- 3.Sugden PH. Circ Res. 2003;93:1179–1192. doi: 10.1161/01.RES.0000106132.04301.F5. [DOI] [PubMed] [Google Scholar]
- 4.Wilkins BJ, Molkentin JD. J Physiol. 2002;541:1– 8. doi: 10.1113/jphysiol.2002.017129. [DOI] [PMC free article] [PubMed] [Google Scholar]
- 5.Pham FH, Cole SM, Clerk A. Adv Enzyme Regul. 2001;41:73– 86. doi: 10.1016/s0065-2571(00)00007-8. [DOI] [PubMed] [Google Scholar]
- 6.Fujio Y, Nguyen T, Wencker D, Kitsis RN, Walsh K. Circulation. 2000;101:660– 667. doi: 10.1161/01.cir.101.6.660. [DOI] [PMC free article] [PubMed] [Google Scholar]
- 7.Shiojima I, Yefremashvili M, Luo Z, Kureishi Y, Takahashi A, Tao J, Rosenzweig A, Kahn CR, Abel ED, Walsh K. J Biol Chem. 2002;277:37670–37677. doi: 10.1074/jbc.M204572200. [DOI] [PubMed] [Google Scholar]
- 8.Saad MJ, Velloso LA, Carvalho CR. Biochem J. 1995;310:741–744. doi: 10.1042/bj3100741. [DOI] [PMC free article] [PubMed] [Google Scholar]
- 9.Petroff MG, Kim SH, Pepe S, Dessy C, Marban E, Balligand JL, Sollott SJ. Nat Cell Biol. 2001;3:867– 873. doi: 10.1038/ncb1001-867. [DOI] [PubMed] [Google Scholar]
- 10.Condorelli G, Drusco A, Stassi G, Bellacosa A, Roncarati R, Iaccarino G, Russo MA, Gu Y, Dalton N, Chung C, Latronico MV, Napoli C, Sadoshima J, Croce CM, Ross J., Jr Proc Natl Acad Sci U S A. 2002;99:12333–12338. doi: 10.1073/pnas.172376399. [DOI] [PMC free article] [PubMed] [Google Scholar]
- 11.Shiraishi I, Melendez J, Ahn Y, Skavdahl M, Murphy E, Welch S, Schaefer E, Walsh K, Rosenzweig A, Torella D, Nurzynska D, Kajstura J, Leri A, Anversa P, Sussman MA. Circ Res. 2004;94:884– 891. doi: 10.1161/01.RES.0000124394.01180.BE. [DOI] [PubMed] [Google Scholar]
- 12.Matsui T, Li L, Wu JC, Cook SA, Nagoshi T, Picard MH, Liao R, Rosenzweig A. J Biol Chem. 2002;277:22896–22901. doi: 10.1074/jbc.M200347200. [DOI] [PubMed] [Google Scholar]
- 13.Shioi T, McMullen JR, Kang PM, Douglas PS, Obata T, Franke TF, Cantley LC, Izumo S. Mol Cell Biol. 2002;22:2799–2809. doi: 10.1128/MCB.22.8.2799-2809.2002. [DOI] [PMC free article] [PubMed] [Google Scholar]
- 14.Thomas G, Hall MN. Curr Opin Cell Biol. 1997;9:782–787. doi: 10.1016/s0955-0674(97)80078-6. [DOI] [PubMed] [Google Scholar]
- 15.Haq S, Choukroun G, Kang ZB, Ranu H, Matsui T, Rosenzweig A, Molkentin JD, Alessandrini A, Woodgett J, Hajjar R, Michael A, Force T. J Cell Biol. 2000;151:117–130. doi: 10.1083/jcb.151.1.117. [DOI] [PMC free article] [PubMed] [Google Scholar]
- 16.de Simone G, Scalfi L, Galderisi M, Celentano A, Di Biase G, Tammaro P, Garofalo M, Mureddu GF, de Divitiis O, Contaldo F. Br Heart J. 1994;71:287–292. doi: 10.1136/hrt.71.3.287. [DOI] [PMC free article] [PubMed] [Google Scholar]
- 17.Himeno E, Nishino K, Nakashima Y, Kuroiwa A, Ikeda M. Am Heart J. 1996;131:313–319. doi: 10.1016/s0002-8703(96)90360-9. [DOI] [PubMed] [Google Scholar]
- 18.Zafeiridis A, Jeevanandam V, Houser SR, Margulies KB. Circulation. 1998;98:656– 662. doi: 10.1161/01.cir.98.7.656. [DOI] [PubMed] [Google Scholar]
- 19.Papadimitriou JM, Hopkins BE, Taylor RR. Circ Res. 1974;35:127–135. doi: 10.1161/01.res.35.1.127. [DOI] [PubMed] [Google Scholar]
- 20.Tomanek RJ, Searls JC, Lachenbruch PA. Circ Res. 1982;51:295–304. doi: 10.1161/01.res.51.3.295. [DOI] [PubMed] [Google Scholar]
- 21.Depre C, Shipley GL, Chen W, Han Q, Doenst T, Moore ML, Stepkowski S, Davies PJ, Taegtmeyer H. Nat Med. 1998;4:1269–1275. doi: 10.1038/3253. [DOI] [PubMed] [Google Scholar]
- 22.Razeghi P, Sharma S, Ying J, Li YP, Stepkowski S, Reid MB, Taegtmeyer H. Circulation. 2003;108:2536–2541. doi: 10.1161/01.CIR.0000096481.45105.13. [DOI] [PubMed] [Google Scholar]
- 23.Anderson MJ, Viars CS, Czekay S, Cavenee WK, Arden KC. Genomics. 1998;47:187–199. doi: 10.1006/geno.1997.5122. [DOI] [PubMed] [Google Scholar]
- 24.Brunet A, Bonni A, Zigmond MJ, Lin MZ, Juo P, Hu LS, Anderson MJ, Arden KC, Blenis J, Greenberg ME. Cell. 1999;96:857– 868. doi: 10.1016/s0092-8674(00)80595-4. [DOI] [PubMed] [Google Scholar]
- 25.Accili D, Arden KC. Cell. 2004;117:421– 426. doi: 10.1016/s0092-8674(04)00452-0. [DOI] [PubMed] [Google Scholar]
- 26.Skurk C, Maatz H, Kim HS, Yang J, Abid MR, Aird WC, Walsh K. J Biol Chem. 2004;279:1513–1525. doi: 10.1074/jbc.M304736200. [DOI] [PubMed] [Google Scholar]
- 27.Stitt TN, Drujan D, Clarke BA, Panaro F, Timofeyva Y, Kline WO, Gonzalez M, Yancopoulos GD, Glass DJ. Mol Cell. 2004;14:395– 403. doi: 10.1016/s1097-2765(04)00211-4. [DOI] [PubMed] [Google Scholar]
- 28.Sandri M, Sandri C, Gilbert A, Skurk C, Calabria E, Picard A, Walsh K, Schiaffino S, Lecker SH, Goldberg AL. Cell. 2004;117:399– 412. doi: 10.1016/s0092-8674(04)00400-3. [DOI] [PMC free article] [PubMed] [Google Scholar]
- 29.Lecker SH, Jagoe RT, Gilbert A, Gomes M, Baracos V, Bailey J, Price SR, Mitch WE, Goldberg AL. FASEB J. 2004;18:39–51. doi: 10.1096/fj.03-0610com. [DOI] [PubMed] [Google Scholar]
- 30.Gomes MD, Lecker SH, Jagoe RT, Navon A, Goldberg AL. Proc Natl Acad Sci U S A. 2001;98:14440–14445. doi: 10.1073/pnas.251541198. [DOI] [PMC free article] [PubMed] [Google Scholar]
- 31.Jagoe RT, Lecker SH, Gomes M, Goldberg AL. FASEB J. 2002;16:1697–1712. doi: 10.1096/fj.02-0312com. [DOI] [PubMed] [Google Scholar]
- 32.Sacheck JM, Ohtsuka A, McLary C, Goldberg AL. Am J Physiol. 2004;287:E591–E601. doi: 10.1152/ajpendo.00073.2004. [DOI] [PubMed] [Google Scholar]
- 33.Bodine SC, Latres E, Baumhueter S, Lai VK, Nunez L, Clarke BA, Poueymirou WT, Panaro FJ, Na E, Dharmarajan K, Pan ZQ, Valenzuela DM, DeChiara TM, Stitt TN, Yancopoulos GD, Glass DJ. Science. 2001;294:1704–1708. doi: 10.1126/science.1065874. [DOI] [PubMed] [Google Scholar]
- 34.Jiang J, Ballinger CA, Wu Y, Dai Q, Cyr DM, Hohfeld J, Patterson C. J Biol Chem. 2001;276:42938– 42944. doi: 10.1074/jbc.M101968200. [DOI] [PubMed] [Google Scholar]
- 35.Zheng N, Schulman BA, Song L, Miller JJ, Jeffrey PD, Wang P, Chu C, Koepp DM, Elledge SJ, Pagano M, Conaway RC, Conaway JW, Harper JW, Pavletich NP. Nature. 2002;416:703–709. doi: 10.1038/416703a. [DOI] [PubMed] [Google Scholar]
- 36.Bai C, Sen P, Hofmann K, Ma L, Goebl M, Harper JW, Elledge SJ. Cell. 1996;86:263–274. doi: 10.1016/s0092-8674(00)80098-7. [DOI] [PubMed] [Google Scholar]
- 37.Li HH, Kedar V, Zhang C, McDonough H, Arya R, Wang DZ, Patterson C. J Clin Investig. 2004;114:1058–1071. doi: 10.1172/JCI22220. [DOI] [PMC free article] [PubMed] [Google Scholar]
- 38.Thaik CM, Calderone A, Takahashi N, Colucci WS. J Clin Investig. 1995;96:1093–1099. doi: 10.1172/JCI118095. [DOI] [PMC free article] [PubMed] [Google Scholar]
- 39.Banes AJ, Gilbert J, Taylor D, Monbureau O. J Cell Sci. 1985;75:35– 42. doi: 10.1242/jcs.75.1.35. [DOI] [PubMed] [Google Scholar]
- 40.Fujio Y, Guo K, Mano T, Mitsuuchi Y, Testa JR, Walsh K. Mol Cell Biol. 1999;19:5073–5082. doi: 10.1128/mcb.19.7.5073. [DOI] [PMC free article] [PubMed] [Google Scholar]
- 41.Kim HS, Skurk C, Thomas SR, Bialik A, Suhara T, Kureishi Y, Birnbaum M, Keaney JF, Jr, Walsh K. J Biol Chem. 2002;277:41888– 41896. doi: 10.1074/jbc.M206657200. [DOI] [PubMed] [Google Scholar]
- 42.Smith RC, Branellec D, Gorski DH, Guo K, Perlman H, Dedieu JF, Pastore C, Mahfoudi A, Denèfle P, Isner JM, Walsh K. Genes Dev. 1997;11:1674–1689. doi: 10.1101/gad.11.13.1674. [DOI] [PubMed] [Google Scholar]
- 43.Yu Z, Redfern CS, Fishman GI. Circ Res. 1996;79:691– 697. doi: 10.1161/01.res.79.4.691. [DOI] [PubMed] [Google Scholar]
- 44.Cho H, Thorvaldsen JL, Chu Q, Feng F, Birnbaum MJ. J Biol Chem. 2001;276:38349–38352. doi: 10.1074/jbc.C100462200. [DOI] [PubMed] [Google Scholar]
- 45.Shibata R, Ouchi N, Ito M, Kihara S, Shiojima I, Pimentel DR, Kumada M, Sato K, Schiekofer S, Ohashi K, Funahashi T, Colucci WS, Walsh K. Nat Med. 2004;10:1384–1389. doi: 10.1038/nm1137. [DOI] [PMC free article] [PubMed] [Google Scholar]
- 46.Suhara T, Kim HS, Kirshenbaum LA, Walsh K. Mol Cell Biol. 2002;22:680– 691. doi: 10.1128/MCB.22.2.680-691.2002. [DOI] [PMC free article] [PubMed] [Google Scholar]
- 47.Brancaccio M, Fratta L, Notte A, Hirsch E, Poulet R, Guazzone S, De Acetis M, Vecchione C, Marino G, Altruda F, Silengo L, Tarone G, Lembo G. Nat Med. 2003;9:68–75. doi: 10.1038/nm805. [DOI] [PubMed] [Google Scholar]
- 48.McMullen JR, Shioi T, Huang WY, Zhang L, Tarnavski O, Bisping E, Schinke M, Kong S, Sherwood MC, Brown J, Riggi L, Kang PM, Izumo S. J Biol Chem. 2004;279:4782– 4793. doi: 10.1074/jbc.M310405200. [DOI] [PubMed] [Google Scholar]
- 49.Crackower MA, Oudit GY, Kozieradzki I, Sarao R, Sun H, Sasaki T, Hirsch E, Suzuki A, Shioi T, Irie-Sasaki J, Sah R, Cheng HY, Rybin VO, Lembo G, Fratta L, Oliveira-dos-Santos AJ, Benovic JL, Kahn CR, Izumo S, Steinberg SF, Wymann MP, Backx PH, Penninger JM. Cell. 2002;110:737–749. doi: 10.1016/s0092-8674(02)00969-8. [DOI] [PubMed] [Google Scholar]
- 50.McMullen JR, Shioi T, Zhang L, Tarnavski O, Sherwood MC, Kang PM, Izumo S. Proc Natl Acad Sci U S A. 2003;100:12355–12360. doi: 10.1073/pnas.1934654100. [DOI] [PMC free article] [PubMed] [Google Scholar]
- 51.Kovacic S, Soltys CL, Barr AJ, Shiojima I, Walsh K, Dyck JR. J Biol Chem. 2003;278:39422–39427. doi: 10.1074/jbc.M305371200. [DOI] [PubMed] [Google Scholar]
- 52.Mitch WE, Goldberg AL. N Engl J Med. 1996;335:1897–1905. doi: 10.1056/NEJM199612193352507. [DOI] [PubMed] [Google Scholar]
- 53.Yang H, Zhao R, Yang HY, Lee MH. Oncogene. 2005;24:1924–1935. doi: 10.1038/sj.onc.1208352. [DOI] [PubMed] [Google Scholar]
- 54.Wray CJ, Mammen JM, Hershko DD, Hasselgren PO. Int J Biochem Cell Biol. 2003;35:698–705. doi: 10.1016/s1357-2725(02)00341-2. [DOI] [PubMed] [Google Scholar]
- 55.Hatakeyama S, Yada M, Matsumoto M, Ishida N, Nakayama KI. J Biol Chem. 2001;276:33111–33120. doi: 10.1074/jbc.M102755200. [DOI] [PubMed] [Google Scholar]
- 56.Deval C, Mordier S, Obled C, Bechet D, Combaret L, Attaix D, Ferrara M. Biochem J. 2001;360:143–150. doi: 10.1042/0264-6021:3600143. [DOI] [PMC free article] [PubMed] [Google Scholar]
- 57.Schneider MR, Wolf E, Hoeflich A, Lahm H. J Endocrinol. 2002;172:423– 440. doi: 10.1677/joe.0.1720423. [DOI] [PubMed] [Google Scholar]
- 58.Kamei Y, Miura S, Suzuki M, Kai Y, Mizukami J, Taniguchi T, Mochida K, Hata T, Matsuda J, Aburatani H, Nishino I, Ezaki O. J Biol Chem. 2004;279:41114– 41123. doi: 10.1074/jbc.M400674200. [DOI] [PubMed] [Google Scholar]
- 59.Wilkins BJ, Dai YS, Bueno OF, Parsons SA, Xu J, Plank DM, Jones F, Kimball TR, Molkentin JD. Circ Res. 2004;94:110–118. doi: 10.1161/01.RES.0000109415.17511.18. [DOI] [PubMed] [Google Scholar]
- 60.Devereux RB, Wachtell K, Gerdts E, Boman K, Nieminen MS, Papademetriou V, Rokkedal J, Harris K, Aurup P, Dahlof B. Jama. 2004;292:2350–2356. doi: 10.1001/jama.292.19.2350. [DOI] [PubMed] [Google Scholar]