

Abstract
To identify new candidate therapeutic targets for Glioblastoma multiforme (GBM), we combined functional genetics and GBM network modeling to identify kinases required for the growth of patient-derived brain tumor initiating cells (BTICs), but which are dispensable to proliferating human neural stem cells (NSCs). This approach yielded BUB1B/BUBR1, a critical mitotic spindle checkpoint player, as the top scoring GBM-lethal kinase. Knockdown of BUB1B inhibited expansion of BTIC isolates, both in vitro and in vivo, without affecting proliferation of NSCs or astrocytes. Mechanistic studies revealed that BUB1B’s GLEBs domain activity is required to suppress lethal kinetochore-microtubule (KT-MT) attachment defects in GBM isolates and genetically transformed cells with altered sister KT dynamics, which likely favor KT-MT instability. These results indicate that GBM tumors have added requirement for BUB1B to suppress lethal consequences of altered KT function. They further suggest that sister KT measurements may predict cancer-specific sensitivity to BUB1B inhibition and perhaps other mitotic targets that affect KT-MT stability.
INTRODUCTION
Glioblastoma multiforme (GBM) is the most aggressive and common form of brain cancer in adults (1). There are currently no effective therapies for GBM. Even with standard of care treatments, such as surgery, radiation, and chemotherapy, ~90% of adult patients die within 2 years of diagnosis (2). Both adult and pediatric brain tumors appear to be hierarchically organized suggestive of a cancer stem cell origin (3–6). Consistent with this notion, brain tumor-initiating cells (BTICs) have recently been isolated that retain the development potential and specific genetic alterations found in the patient’s tumor (3, 4, 7, 8). When implanted into the cortex of rodents, BTICs give rise to GBM-like tumors with patient-specific molecular signatures and histological features (5–8). Expression of neural progenitor molecular networks may contribute to the aggressive behavior of GBM tumors through enhancing self-renewal or developmental programs (9), DNA repair pathways (10), angiogenesis (11), and/or invasiveness (12). Given the likelihood of BTIC-driven maintenance and spread of GBM, effective cell-based therapies will likely have to target the stem cell.
Recently, a new method for deriving and maintaining BTICs was developed in which adult BTICs can be isolated and grown in serum-free, defined monolayer culture (7, 8). By this method BTICs can retain tumor-initiating potential and tumor-specific genetic and epigenetic signatures over extended outgrowth periods (13). Here, we sought to take advantage of this BTIC culture system to find evidence for the cancer-lethal hypothesis: that transformed cells harbor novel molecular vulnerabilities compared to “normal” cells as a direct consequence of cancer-causing genetic alterations (14). Although multiple studies have addressed the question of cancer lethality in serum-derived cell lines (15, 16), there remain lingering questions of applicability to human cancers, since serum-derived lines may not faithfully represent the primary cancer (7).
By combining the results of shRNA kinome screens in BTICs and NSCs for genes required for progenitor expansion with a GBM bionetwork created from patient molecular signatures, we identified BUB1B, a critical mitotic checkpoint kinase (17), as the top GBM-specific hit. Our results suggest that GBM tumors and genetically transformed cells have added requirement for BUB1B to suppress lethal consequences of altered KT function. Importantly, these studies demonstrate that non-transformed cells do not require BUB1B/BubR1 for chromosome alignment, nor do they require the GLEBs domain to maintain the spindle assembly checkpoint. They further suggest that altered KT conformations, apparent in GBM and genetically transformed cells, may predict cancer-specific sensitivity to BUB1B inhibition and perhaps other mitotic targets that affect KT-MT stability.
RESULTS
An RNAi kinome screen for genes differentially required for BTIC expansion
To discover candidate therapeutic targets for GBM, we performed an shRNA screen targeting 713 human kinases to identify gene activities required for in vitro expansion of BTICs. To enrich for BTIC-specific hits, a parallel screen was conducted in human fetal NSC-CB660 cells (Fig. 1A) (18). NSCs share molecular and phenotypic features with BTICs, including: identical isolation and growth in serum-free conditions, similar doubling times, overlapping expression profiles, and similar developmental potential (18). However, they retain a normal karyotype and are not tumorigenic (18), and, thereby, represent ideal controls for BTICs.
Figure 1. Integration of RNAi screens in patient-derived BTICs and GBM bionetworks.

(A) Overview of shRNA screens, GBM network generation, and results of seeding screen hits into GBM network (see Methods and Supplementary Information for further details on GBM network construction and screen comparisons).
(B) BUB1B subnetworks from GBM tumors and also from normal brain networks. Also indicated are the node inhibition BTIC and NSC growth phenotypes.
(C) Down steam node analysis, a metric that helps predict the relative importance of nodes (14, 23) of BTIC-specific screen hits which appear in the GBM Bayesian network.
This screening approach (see Methods for details) revealed ~48 candidate kinase targets with shRNAs underrepresented in BTICs relative to NSCs (Table S1). To prioritize these hits, we examined whether hits could be parsed into distinct pathways and/or complexes using protein-protein interaction networks (19). By this analysis, most hits were connected in a single, large subnetwork, enriched for 248 GO biological processes (multiple testing adjusted p-value<0.01), such as protein kinase cascade (p-value= 5.57881e-085) and protein amino acid phosphorylation (p-value=1.10068e-082). This lack of specific biological processes likely reflected the fact that these kinases are well studied and involved in many biological processes and, thus, did not provide any useful information for prioritizing of candidate hits.
As an alternative strategy, we examined the occurrence of screen hits in GBM specific regulatory network, constructed de novo from over 421 TCGA GBM tumor samples (20) by integrating gene expression and DNA copy number variation data (21, 22) (Supplementary Information). By this analysis, 37 of 48 shRNA candidate hits appeared as nodes in the GBM network. Examination of subnetworks in the GBM network, revealed 15 biological processes significantly enriched (5 cell cycle related, 9 general phosphorylation related), including the M phase of mitotic cell cycle (p-value=1.64e-5). The largest GBM-specific subnetwork contained four screen hits, including AURKB, BUB1B, MELK, and PLK1 (Fig. 1B). Based on key driver node analysis (23), BUB1B scored as the top ranked screen hit (Fig. 1C).
To control for GBM network comparisons, we also examined screen hits in a normal brain network constructed from 160 non-dementia human prefrontal cortex samples. Only 20 of the 48 candidate hits appeared in the normal brain network, and produced smaller subnetworks enriched for general phosphorylation related GO biological processes (data not shown). Although BUB1B appeared in this network, it was connected to only one gene and had no down nodes (Fig. 1B), and, thus, was not a key driver node.
BUB1B is differentially required for BTIC expansion
Retests of AURKB, BUB1B, MELK, and PLK1 revealed that BUB1B inhibition gave the largest differential effect on BTICs from multiple GBM isolates, including common developmental subtypes (24), without observable toxicity in proliferating NSCs or astrocytes (Figs. 1A–D). In these studies, shRNA expressing cells were subjected to short- and long-term out growth assays (Fig. 2D and Supplementary Fig. S1A–B). Knockdown of KIF11 was used as a positive control. KIF11 encodes a microtubule motor protein required for mitotic progression in proliferating mammalian cells (13). During short and long term outgrowth shKIF11 blocked the growth of BTICs, NSCs, and astrocytes. Since shKIF11 only inhibits cycling cells entering mitosis, shKIF11-dependent growth inhibition indicates similar division rates for various cells used and that they have comparable RNAi pathway activity. However, BUB1B knockdown only triggered significant growth inhibition in BTIC lines (Figs. 2A & D). During longer-term outgrowth shBUB1B inhibited the growth of SSEA1+ BTIC subpopulations, which are enriched for tumor initiating cell activity (25) (Supplementary Fig. S1C–D). BUB1B knockdown was also deleterious to BTIC tumor sphere formation, which may reflect tumor initiating cell activity (5, 6), in both BTICs and primary tumor samples (Fig. 2E). However, knockdown did not profoundly alter expression of SSEA1 or other progenitor markers, including SOX2 and NESTIN, or neural lineage markers, including GFAP and TUJ1 (data not shown).
Figure 2. BUB1B validates as a candidate GBM-lethal gene in vitro.

(A) BTIC-specific effects of BUB1B knockdown, visualized using shRNA-GFP+ BTICs and NSCs 6 days after post-transduction with pGIPz-shRNA virus. Knockdown of KIF11/EG5, which encodes a microtubule motor protein critical for bi-polar spindle formation during mitosis, was used as a positive control for both RNAi pathway activity and cell proliferation.
(B–C) Examination of BUB1B knockdown by western blot and RT-qPCR analysis in BTIC-G166 and NSC-CB660 cells.
(D) Comparison of the effects of BUB1B knockdown on in vitro expansion of multiple BTIC and NSC lines and normal human astrocytes (NHAs). **indicates student’s t-test p <.01. See methods for a description of how BTIC isolates were developmentally subtyped.
(E) Limiting dilution assays (LDA) for in vitro tumor sphere formation. BTIC-0131 cells and also un-passaged primary GBM tumor cells (448T) were transduced with indicated LV-GFP-shRNAs, diluted and assayed for sphere formation after 14 days. Linear regression analysis was used to evaluate significance.
By contrast, PLK1 knockdown had a partial effect; MELK knockdown had no effect; and inhibition of AURKB was equally toxic to BTICs and NSCs (Supplementary Fig. S2A–C). Based on these results, we further pursued BUB1B as a candidate BTIC-lethal gene.
BUB1B is overexpressed in GBM isolates and its checkpoint activity is compromised by shBUB1B in both BTICs and NSCs
BUB1B encodes a highly conserved BUB1-like kinase, BubR1, whose activity is essential for mitotic spindle checkpoint signaling (17). The mitotic spindle checkpoint monitors the attachment of kinetochores to the plus ends of spindle microtubules and prevents anaphase onset until chromosomes are aligned and kinetochores are under tension at the metaphase plate (17). Due to its role in maintaining chromosome stability, mitotic spindle checkpoint activity has been touted as a mechanism for tumor suppression (17, 26). In rare instances partial loss of function mutations in checkpoint genes have been reported for certain cancers (26). However, many late-stage cancers, including glioma, exhibit high BUB1B expression (27, 28), suggestive of hyperactivity.
To begin to reconcile these observations with our results, we analyzed BUB1B expression patterns and activity in BTICs and NSCs. We observed that BUB1B and other spindle checkpoint genes were up regulated in BTIC isolates and also Ras-transformed astrocytes as judged by mRNA and protein abundance (Supplementary Fig. S3A–C). Moreover, both BTICs and NSCs had normal mitotic spindle arrest responses after taxol treatment, which were abrogated by BUB1B knockdown (Supplementary Fig. S4A–C). Thus, BUB1B knockdown achieves a similar level of suppression of BUB1B mRNA, protein, and activity in both BTICs and NSCs. The results suggest that BUB1B knockdown produces a hypomorphic state to which BTICs, but not NSCs or astrocytes, are sensitive. Below we provide further evidence to support this conclusion, by addressing BUB1B’s essential and non-essential functions in BTICs, transformed, and untransformed cells.
Shortened inter-kinetochore distances are indicative of sensitivity to shBUB1B in BTICs and genetically transformed cells
One possible explanation for BTIC’s observed sensitivity to hypomorphic BUB1B activity is that KT-MT dynamics could be altered to favor MT detachment. In order to properly segregate chromosomes during mitosis, stable attachments must occur between the “plus” end of mitotic spindle MTs and KTs, which are formed at centromeres of each sister chromatid as cells enter mitosis (29). Early in mitosis, KT-MT attachments are unstable and dynamic, allowing chromosomes to be towed toward MT plus ends during congression and improperly attached chromosomes to be released and re-attached to spindle MTs until they are bi-oriented and under tension (19, 29). The distance between KTs on sister chromatids can range from ~0.6 μm in prophase to >1 μm in metaphase, when sister KTs achieve stable MT attachment and are pulled toward opposing spindle poles (Fig. 3A) (30). In the prevailing model, this KT movement prevents outer kinetochore proteins from being phosphorylated by Aurora B kinase, which promotes KT-MT detachment (e.g., for error correction), by physically removing them from centromere-embedded Aurora B activity (29).
Figure 3. Measurement of inter-kinetochore distance (IKD) in BUB1B resistant and sensitive cells.

(A) Cartoon showing IKD measurement.
(B) Measurement of IKDs in BTICs, NSCs, MEF, MEF-Ras, RPE and Hela cells using immunofluorescent staining of kinetochores. Constitutive associated centromere network (CCAN/CREST) proteins (red) and outer kinetochore protein, Hec1, (green) were visualized to identify kinetochore pairs. IKDs were measured between Hec1 centroids using Applied Precision Softworx software package.
(C–D) Quantification of IKDs from (B). *denotes p<.001 by student’s t-test.
To examine KT-MT dynamics, we first investigated the possibility that KT dynamics may be altered in GBM cells. To this end, we measured inter-kinetochore distance (IKD): the maximum distance achieved between sister KTs when stable end-on MT attachment has occurred (31). We first measured IKDs for shBUB1B insensitive NSCs (CB660) and two shBUB1B sensitive BTIC isolates (G166 and 0131). The results were surprising. We found that IKDs were significantly shorter in both BTIC isolates (1.23 μm for CB660 vs. 1.13 μm for G166 and 1.09 μm for 0131) (Figs. 3B & C). Thus, BTICs IKDs were short by 100–140 nm, or 50–70 nm for each sister KT. This represents a significant change, since, for example, the outer kinetochore protein Hec1 moves ~40 nm toward the spindle pole as KTs come under tension (32, 33).
Next, we examined IKDs in two GBM patient isolates, 0827 and 1502, that we had observed were completely insensitive to shBUB1B. These isolates were insensitive despite having similar knockdown efficiencies to shBUB1B sensitive lines and among the fastest doubling times and tumor initiation rates (data not shown). Measuring IKDs in these cells revealed that they were indistinguishable from NSCs (1.23 μm), suggesting the possibility that IKDs may predict BUB1B sensitivity (Figs. 3B & C).
To further examine this possibility, we tested a hypothesis: that shortened IKDs and added BUB1B requirement arise as a result of oncogenic transformation and, specifically, oncogenic signaling. It was recently shown that expression of activated Ras oncogene can lead to mitotic stress and induce chromosome instability in mammalian cell, through an as yet undefined mechanism (16). Thereby, we examined IKDs in p53−/− mouse embryo fibroblasts with or without RasV12 expression. In p53−/− control MEFs, IKDs averaged 1.25 μm similar to NSCs and 827 cells. Surprisingly, RasV12 expression converted long IKDs to short, averaging 1.13 μm, indistinguishable from G166 and 0131 cells (Fig. 3D). Moreover, RasV12 transformation also converted MEFs from being resistant to BUB1B inhibition to being profoundly sensitive, which was also true for human astrocytes (Fig. 3D) as well (both experiments are presented below in Fig. 5 & Supplementary Figs. S8A–C). Importantly, all of the IKD measurements for BTICs, NSCs, and MEFs IKDs were scored blindly to avoid experimenter bias.
Figure 5. Allelic complementation studies with mouse Bub1b mutants in Bub1b−/− MEFs and BTICs.

(A) The mouse alleles used in these studies were previously published and include: full length; KD2, which harbors two point mutations in the kinase domain (K784>R in the ATP binding domain and K802>R in the catalytic domain); ΔN, which lacks the N-terminal Cdc20-binding domain 1; ΔM, which lacks the C-terminal Cdc20-binding domain 2; and E406K, which creates a point mutation in the GLEBS motif that interferes with kinetochore localization and Bub3 binding.
(B) Viability assessment of complementation studies using p53−/− MEFs with floxed alleles of Bub1b with and without transformation via H-RasV12.
Knockdown of BUB1B in Ras-transformed normal human astrocytes (NHAs) phenocopies BUB1B requirement observed in BTICs with respect to viability. MEFs were transduced with MSCV-GFP-mBub1b constructs, sorted for GFP+, outgrown, transduced with pMSCV-Puro-Cre, selected, and seeded into microtiter growth dishes for proliferation assays.
(C) Viability assessment of complementation studies using BTIC-G166 with shBUB1B (or controls) expressing each of five mBub1b alleles from (A). Assays were performed as in Figure 1C.
(D) & (E) Chromosome alignment after complementation of BUB1B knockdown with mBub1b alleles, as in Figure 4A & 4B. Scale bar indicates 10 microns.
Since most BUB1B/BubR1 experimentation has been performed in HeLa cells, which are derived from a cervical carcinoma (16), we next measured IKDs in these cells. As a control, we used immortalized retinal pigment epithelial (RPE-1) cells, which are untransformed. Hela cells showed IKDs similar to other BUB1B sensitive cells (1.11 μm), while RPE cells showed long IKD similar to insensitive cells (1.22 μm). Repeating the pattern above BUB1B knockdown only affected chromosome dynamics in Hela cells (detailed below).
These results suggest: 1) that IKDs occur in discrete intervals: long (~1.24 μm) and short (~1.12 μm); 2) that short IKDs predict sensitivity to BUB1B inhibition; and 3) that RasV12 transformation is sufficient to induce short IKDs and sensitivity to BUB1B.
GBM isolates with short inter-kinetochore distances require BUB1B to suppress severe KT-MT attachment defects
We next wished to determine whether BTICs with short IKDs have altered KT-MT dynamics that favor detachment. To this end, we used a metaphase chromosome alignment assay, in which KT-MT attachment defects are visualized as misaligned chromosomes during metaphase arrest induced by proteasome inhibition (34). By this assay, knockdown of BUB1B resulted in dramatic chromosome alignment defects only in BTICs with short IKDs, but did not affect alignment in NSCs, 0827 cells (Figs. 4A & 4B; Supplementary Fig. S5A) or astrocytes (see below). The alignment defects in G166 cells were accompanied by profound loss of KT-MT attachment, as indicated by lack of co-localization KTs with cold resistant MTs (Supplementary Fig. S5B). Moreover, examination of phospho-Ser44-Hec1/Ndc80 at KTs revealed that after BUB1B knockdown, G166s retain Ser44-P (35) (Supplementary Fig. S5C). This phosphorylation is dependent upon centromere-embedded Aurora B kinase activity, and has a KT-MT destabilizing effect (29). These results suggest that cells with short IKDs have KT-MT attachment defects, which BUB1B is required to suppress.
Figure 4. BTICs with short inter-kinetchore distances require BUB1B activity to suppress KT-MT attachment defects.

(A) Chromosome alignment assays in BTICs and NSCs with BUB1B knockdown. Transduced cells were treated by 10 μM MG-132 for 2 hours to arrest them at metaphase and then fixed, stained as indicated (CREST anti-serum stains human kinetochores) and visualized using deconvolution microscopy. Scale bar indicates 10 microns.
(B) Quantification of misaligned kinetochores (“n” indicates number of metaphase cells counted; ** indicates p<.001 by student’s t-test).
(C) Chromosome segregation defects observed in BTICs are exacerbated by BUB1B knockdown. Cells were transduced with LV-GFP-shRNA vectors, selected in puromycin, stained with an MPM-2 antibody, which marks mitotic cells, and DAPI, and examined for the appearance of lagging chromosomes in anaphase/telophase cells (n=3, >40 anaphases scored).
(D) Assays for lagging anaphase chromosomes were performed by overnight arrest with the KIF11 inhibitor monastrol (100 μM) followed by release for 2 hours in normal media. Lagging chromosomes were visualized by fluorescence microscopy after fixation and DAPI staining. White arrows in left panels show typical examples of lagging chromosomes scored in BTICs (scale bar = 10 μm). >400 nuclei were counted for each trial (n=5).
Consistent with this notion, G166 cells also displayed overt differences in chromosome dynamics during mitosis, with significantly more lagging chromosomes in anaphase compared to NSCs (Fig. 4C). BUB1B knockdown dramatically exacerbated these defects (Fig. 4D). In control experiments in NSCs, shBUB1B did not affect lagging chromosome frequency or karyotype after extended outgrowth (Fig. 4C; Supplementary Fig. S5D), again suggesting that cells with long IKDs do not utilize BUB1B in the same way.
Genetic dissection of added requirement of BUB1B in RasV12-expressing fibroblasts and BTIC cells
BUB1B has multiple functional domains that have been implicated in mitotic checkpoint control, mitotic timing, and stable kinetochore-microtubule attachment (17, 29). These include: N- and C-terminal KEN box domains required for Cdc20 binding and APC inhibition (36–38); a C-terminal kinase domain involved in checkpoint control (39, 40); and a GLEBS-like motif necessary for KT localization during mitosis (39, 41) (Fig. 5A). While BUB1B is essential for mammalian development (42), its essential function is contained solely within the N-terminal KEN box (36), which enables Bub1b to act as a pseudo-substrate inhibitor of APC/CCdc20 during G2 and pre-anaphase mitosis, preventing a precocious anaphase (36).
The above results suggested that BTICs with short IKDs have added requirement for BUB1B that helps facilitate KT-MT attachment. BUB1B’s GLEBS domain is necessary for its KT localization, interaction with Bub3, and helps facilitate KT-MT attachment (39, 41). Recently, Maulureanu et al (2009) demonstrated that this domain is non-essential for stable end-on KT-MT attachment and viability in mouse embryo fibroblasts (MEFs). Their results, however, were not consistent with previous work in HeLa cells that clearly demonstrated that the GLEBs domain is essential for KT-MT attachment (43). Intriguingly, our data sets inform these seemingly incompatible results with the following thesis: BUB1B’s GLEB domain is required in cells with abnormal KT conformations (e.g., Helas) to suppress lethal KT-MT instability. Furthermore, since our results above, demonstrate that RasV12 transformation can convert long IKDs to short, it would follow that oncogenic transformation gives rise to added BUB1B requirement.
To directly address this notion, we next performed allelic complementation studies using mouse Bub1b alleles (Fig. 5A) in mouse embryo fibroblasts (MEFs) harboring bi-allelic deletion of Bub1b (36), which were also transformed by H-RasV12. For these experiments, we used full-length mBub1b, the N-terminal deletion mutant and the E406K GLEB domain mutant allele, which cannot bind to KTs. Expression of each allele was verified by western blotting (Supplementary Fig. S6A–C). For non-transformed MEFs, the viability pattern was the same as previously published (36): both FL and E406K alleles fully complemented Bub1b−/− and only the N-terminal KEN box domain was required for Bub1b−/− cell growth (Fig. 5B). However, after Ras-dependent transformation of these cells, the results changed dramatically. The GLEBs domain became essential for viability, as evidenced by the complete failure of the E406K allele to complement (Fig. 5B). RasV12 activity, however, did not alter requirement N-terminal KEN box domain. These results demonstrate that RasV12 transformation leads to profound requirement for BUB1B’s GLEBs domain activity.
To further examine this result, we performed a similar set of complementation experiments in BTIC-G166 cells, using mouse Bub1b alleles to complement knockdown of endogenous human BUB1B. In this case, kinase defective and internal KEN box deletion alleles were also included (Fig. 5C). Expression of each allele was confirmed by western blotting (Supplementary Fig. S6A–B). Knockdown efficiency of endogenous BUB1B was also shown to be unaffected by expression of mouse Bub1b (shBUB1B is not predicted to target mouse Bub1b) (Supplementary Fig. S6C). As shown in Figure 5C, expression of full length and KD2 mBub1b alleles achieved near-complete rescue of the viability defects of BUB1B knockdown in G166 cells, indicating that the shBUB1B phenotype is due to on-target silencing of BUB1B, and that BUB1B’s kinase activity is not required in BTICs. By contrast the ΔN and E406K alleles, failed to complement viability, behaving exactly as the vector control, while ΔM showed a partial rescue (Fig. 5C). None of the alleles were able to complement control KIF11 knockdown. Thus, these results phenocopy those observed in RasV12-transformed MEFs.
To further investigate these results, we performed KT-MT attachment using chromosome alignment assays as described above. All alleles showed complete or partial suppression of alignment defects, except for E406K, which failed to complement (Figures 5D & 5E). This demonstrates that BUB1B’s GLEBs domain is essential for both viability and stable-end on attachment of MTs to KTs in BTICs with short IKDs.
Since BUB1B’s essential function is to prevent precocious anaphase through inhibiting APCCdc20 activity, we also examined mitotic transit times in the same series of complementation experiments. BUB1B knockdown causes significant reduction in transit times in BTICs, which all alleles were able to complement, except for ΔN (ΔM was not determined) (Supplementary Fig. S7). Since the E406K allele restored mitotic timing, but not viability or KT-MT attachment, this would suggest that requirement for BUB1B-GLEBs domain activity is distinct from BUB1B-dependent APC regulation.
To provide additional evidence for transformation dependent changes in BUB1B function in human cells, we examined viability and KT-MT attachment requirements for BUB1B in normal human astrocytes with and without expression of RasV12. Knockdown of BUB1B in RasV12- NHA, but not NHA controls, resulted in loss of viability and severe KT-MT defects (Supplementary Fig. S8A–B). These results were, again, consistent with the notion that oncogenic transformation leads to added requirement for BUB1B to stabilize KT-MT attachments. A similar pattern was observed in HeLa cells and non-transformed RPE cells. ~93% of HeLa cells treated with siBUB1B have severe KT-MT attatchment defects (n>100), compared to only 17% for control; while KT-MT attachment was similar regardless of siBUB1B treatment (n>150) (Supplementary Fig. S8C).
Several key conclusions can be drawn from these studies: 1) BUB1B is the relevant target of shBUB1B in BTICs; 2) BUB1B’s kinase activity is dispensable for added BUB1B requirement in BTICs; 3) promotion of KT-MT attachment, rather than restoration of BTIC-mitotic delay/timing, is a key BTIC-lethality suppressing activity; 4) GBM cells differ in their requirement for BUB1B’s GLEBS domain as compared to cells with long IKDs; and 5) that oncogenic transformation drives added requirement for BUB1B’s GLEBs domain.
ShBUB1B inhibits BTIC-driven tumor formation
Lastly, to ensure that the above results are applicable to patient tumor formation, we examined BUB1B requirement during BTIC tumor formation, for a BTIC line with short IKDs. We performed two different assays. In the first, shRNA-GFP+ 0131 cells competed against non-shRNA control 0131 cells at ~9:1 ratio (Fig. 6A) for injection into the cortex of immunodeficient mice. The end point was relative representation of shBUB1B. After 4 or 7 weeks post-injection, control cells had dramatically outcompeted shBUB1B-GFP+ cells (Fig. 6A). This was not simply due to inviability of injected cells at Day 0, since the most shBUB1B-GFP+ cells in the injection bolus could attach to laminin-coated dishes. For the second assay, survival was the end point for mice injected with either shControl or shBUB1B expressing 0131 cells (Fig. 6B). This assay ended at 250 days post-injection when 90% of control mice had succumbed to tumors. During this time none of the shBUB1B-0131 mice died. These results suggest that knockdown of BUB1B is deleterious to GBM tumor formation and that the in vivo tumor environment does not suppress requirement for BUB1B.
Figure 6. BUB1B knockdown inhibits BTIC-dependent tumor growth.
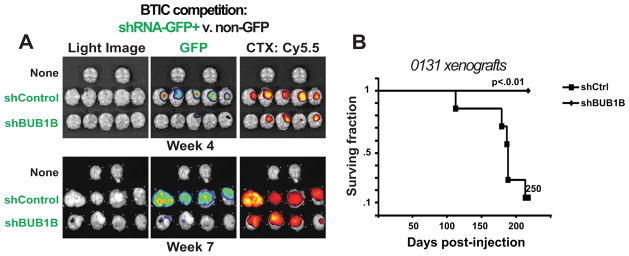
(A) Orthotopic xenotransplants of 131 BTIC cells after stable transduction with shControl or shBUB1B. Upper & lower panels: experimental NSG mice 4 and 7 weeks post injection, respectively. Right panels: light images of brains from control Middle panels: GFP+ fluorescence marking shRNA containing cells. Left panels: fluorescent signal from Chlorotoxin: Cy5.5 conjugate marking bulk tumor mass. Results indicate that GFP expressing shBUB1B cells were unable to contribute to formation of orthotopic tumors and yielded tumor masses dominated by wild type control cells with little to no detectible GFP expression. Quantification of GFP fluorescence in tumor 0131 orthotopic xenotransplants is shown in Figure S9.
(B) Survival plots for mice with BTIC-0131 brain xenografts with or without knockdown of BUB1B. (Median survival for shCtrl = 178 days; shCtrl n=7; shBUB1B n=6)
Discussion
Here we attempted to identify kinases differentially required for the expansion of GBM-derived BTICs by combining a functional genetic approach with a GBM bionetwork derived from patient sample molecular data sets (44). This approach produced BUB1B as the top-scoring screen hit. Validation studies bore out this prediction: knockdown of BUB1B differentially blocked expansion of 9 of 11 BTIC isolates examined, without effecting growth of human NSCs and astrocytes, which are both candidate cell types of origin for GBM (44).
BUB1B encodes a highly conserved BUB1-like kinase, BubR1, whose activity is essential for mitotic spindle checkpoint signaling (17). The mitotic spindle checkpoint monitors the attachment of kinetochores to the plus ends of spindle microtubules and prevents anaphase onset until chromosomes are aligned and kinetochores are under tension at the metaphase plate (17). To pursue the mechanism of BUB1B requirement in GBM cells, we tested a hypothesis: that KT-MT dynamics are fundamentally altered in GBM cells to favor KT-MT detachment, which BUB1B is required to suppress.
This hypothesis was supported by multiple observations (summarized in Fig. 7). First, in examining sister KT dynamics at metaphase, we demonstrated that GBM and other cancer cells sensitive to BUB1B inhibition have significantly shorter IKDs, indicating that KT dynamics are dramatically altered. Second, in BTICs with short IKDs, BUB1B activity is required to suppress lethal KT-MT instability and to directly or indirectly inhibit centromere-embedded Aurora B activity on outer KT proteins. Third, expression of the RasV12 oncogene is sufficient to induce the same changes in sister KTs observed in BTICs. Fourth, RasV12 also triggered requirement for BUB1B’s GLEBs domain for both viability and KT-MT attachment. Fifth, genetic dissection of BUB1B function in BTICs with short IKDs revealed the same requirement for BUB1B’s GLEBs domain to suppress lethal KT-MT instability.
Figure 7.

A model for BUB1B function in GBM and genetically transformed cells
These results support a model whereby oncogenic signaling alters KT regulation, resulting in short IKDs and KT-MT instability. As a direct result, BUB1B’s GLEBs domain activity becomes essential for KT-MT attachment. In the absence of GLEBs domain activity cells with short IKD undergo mitotic catastrophe and are inviable (Fig. 7). Importantly, our studies demonstrate that non-transformed cells do not require BUB1B/BubR1 for chromosome alignment, nor do they require the GLEBs domain to maintain the spindle assembly checkpoint or viability.
One key implication of this work is that short IKDs may be predictive of requirement for BUB1B’s GLEBs domain and sensitivity to disruption of KT function in cancer cells. For example, we have found patient GBM isolates (i.e., 0827, 1502) that are resistant to BUB1B knockdown and have IKDs indistinguishable from untransformed cells. Thus, it is conceivable that anti-cancer therapies targeting KT or mitotic checkpoint function (e.g., (45, 46)) would benefit from using IKDs as a biomarker or companion diagnostic. However, additional studies are required to determine the extent to which IKDs are shorter in cancer cells and also the mechanisms through which KT conformations become perturbed.
One possibility is that RTK-Ras signaling directly affects KT function. There is evidence that Ras effector kinases Erk1/2 can directly phosphorylate the C-terminal domain of CENPE, a key KT protein, which is predicted to decrease its MT binding ability (47, 48). Intriguingly, we observed that in both BTIC-G166 and RasV12-transformed astrocytes, which have short IKDs, there is significant up regulation of Erk1/2 activity in prophase and mitosis (Supplementary Fig. S9). Thus, it is conceivable that inappropriate regulation of RTK-Ras pathway in mitosis could directly effect KT-MT attachments and/or KT conformational states. Although RasV12-transformed astrocytes may not faithful recapitulate the mutation spectra of GBM (only ~2% have mutant Ras activity (20)), the Ras pathway is predicted inappropriately activated in the majority of GBM tumors (20) (e.g., by NF1 mutation or RTK activity). Future work is required to examine the relationship between Ras signaling and KT regulation.
Our results also shed light on a recent study that identified genes differentially required in cancer cell lines overexpressing the activated KRAS oncogene (16). Their results suggest that activated Ras oncogene activity triggers differential requirement for a PLK1-kinase-associated mitotic network (16), which they proposed resulted from Ras-induced “mitotic stress”. Our results suggest that these phenotypes likely result from KT-MT attachment defects arising from KT conformational abnormalities.
Lastly, our studies also inform the use of large collection of cancer patient molecular signatures. We used >300 GBM patient molecular signatures to create a Bayesian bionetwork, which when combined with our functional genetic data, predicted BUB1B inhibition to be differentially lethal for GBM cells. To our knowledge this is the first time a bionetwork derived solely from patient data has been used to successfully predict a gene activity specifically required for cancer cells. Intriguingly, integrating our BTIC kinome data set into bionetwork for breast cancer also yielded BUB1B as the top scoring hit (J. Zhu, personal communication), suggesting that our results should prove useful for other cancers.
In summary, our results suggest that GBM tumors and genetically transformed cells have added requirement for BUB1B to suppress lethal consequences of altered KT function. They further suggest that IKDs may predict cancer-specific sensitivity to BUB1B inhibition and perhaps other mitotic targets that affect KT-MT stability.
METHODS
ShRNA Bar-code screens and array analysis
For shRNA screen and Bar-code array analysis cells were infected with a pool of lentiviral shRNAs targeting 713 human kinases at a representation of ~1,000 fold (MOI<1). At day 3 post-infection an initial Day-0 sample was taken. The rest of the population was selected with puromycin (Sigma) (2 μg/ml) to remove uninfected cells. Afterwards, cells were propagated in culture for an additional 21 days and sampled for BC array analysis at 21 days. For each passage a minimal representation of 1000 fold was maintained. For each corresponding sample, shRNA barcodes were PCR-recovered from genomic samples, labeled with Cy5 or Cy3, and competitively hybridized to a microarray containing the corresponding probes (Agilent Technologies). Replicate array results were analyzed using the BioConductor package limma. The change in the relative abundance of each shRNA in the library over time was measured using the normalized Cy3/Cy5 ratio of its probe signal. Barcode probes depleted in the BTIC samples were considered candidate genes using the following criteria: 1) adjusted p-value ≤ 0.05 and 2) |log2(ratio)| ≥ 0.585.
Cell culture
BTIC and NSC lines used in these studies have been previously published (7,8) and were grown in N2B27 neural basal media (Stemcell Technologies) supplemented with EGF and FGF-2 (20 ng/mL each) (Peprotech) on laminin (Sigma) coated polystyrene plates and passaged according to Pollard (8). Immortalized neural stem cells, CX and VM (Millipore), were maintained in ReNcell maintenance medium with EGF and FGF-2 (20 ng/mL each) (Peprotech) and also grown on laminin coated tissue culture treated plates and passaged according to Pollard (8). NHA (StemCell Technologies) and NHA-Ras cells (Russell Pieper, UCSF) were grown in astrocyte growth medium (Clonetics) according to the manufacturer’s instructions and published protocols (49).
RNAi
ShRNAs were obtained from the RNAi Shared Resource (FHCRC) or Open Biosystems (Huntsville, AL) in the pGIPZ lentiviral vector. Target sequences for shRNAs are as follows: BUB1B, #1, CDS:1417, CCTACAAAGGAGACAACTA; BUB1B, #2, CDS:1547, AGGAACAACCTCATTCTAA; and KIF11, CDS:571, AAGAGAGGAGTGATAATTA. For virus production pGIPZ-shRNA plasmids were transfected into 293T cells along with psPAX and pMD2.G packaging plasmid to produce lentivirus. ~24 hours after transfection, neural stem cell expansion medium was added to replace original growth medium. Virus was harvested 24 hours after medium change and stored at −80C. BTICs and NSCs were infected at MOI<1 and selected with 2–4 μg of puromycin for 2–4 days.
RT-qPCR
Quantitect RT-qPCR primer sets and QuantiFast SYBR Green PCR Kits (Qiagen) were used according to the manufacturer’s instructions with the ABI Prism 7900 sequence detection system (Genomics Resource, FHCRC). Relative transcript abundance was analyzed using 2 ΔΔCt method. TRIZOL (Invitrogen) extraction was used to collect total RNA from cells.
Western Blot
Western Blots were carried out using standard laboratory practices, except that a modified RIPA buffer was used for protein extraction (150 mM NaCl, 50 mM Tris, 2 mM MgCl2, .1% SDS, .4% DOC, .4% Triton-X 100, 2 mM DTT, and complete protease inhibitors (Roche)) followed by a 15 min digestion with 125U of Benzonase (Merck) at RT. The following antibodies were used for detection: Bub1B (1:1000, Sigma), Actin (1:1000, Cell Signaling) and cleaved Parp (1:1000, Cell Signaling). An Odyssey infrared imaging system was used to visualize blots (Li-cor) following manufacture’s instruction.
Growth Assays
For short-term outgrowth assays, post-selection, shRNA transduced cells were harvested, counted (Nucleocounter, NBS), and plated onto a 96-well plate. After 7 days under standard growth conditions, cell proliferative rate was measured using Alamar blue reagent (Invitrogen). For long-term outgrowth assays, post-selection, shRNA transduced cells were mixed with non-transduced cells (9:1) and outgrown for 14–24 days using our standard passaging protocol. The GFP+ fraction, which marks shRNA containing cells, of each population was measured by FACS (BD LSR2 flow cytometer; FHCRC Shared Resources) at 5–8 day intervals.
Spindle checkpoint arrest
For image-based assessment, cells were plated in a 96 well plate and then treated with paciltaxol (Sigma) and nocodozole (Sigma) for various time points (6–18 hrs). After treatment, cells were fixed with 2% paraformaldehyde for 30 minutes, permeabilized with 0.25% Triton X-100, and blocked in PBS containing 3% BSA and 5% goat serum. After 3 washes with PBS, cells were stained with MPM-2 (1:300, Millipore) at room temperature for 1 hour. Next, cells were washed and incubated with Alexaflour-568 secondary antibody (Invitrogen) and DAPI for 1 hour in dark. Staining was visualized by Nikon eclipse Ti microscope. For FACS-based assessment, cells were then collected and fixed in 70% ethanol for 1 hour at 4°C, then rinsed with ice-cold PBS+2% FCS, and stained with anti-MPM-2 (1:300, Millipore), anti-mouse Alexafluor-568 (1:200, Invitrogen), and DAPI (1 μg/ml). Cells were washed, re-suspended in PBS and filtered. Mitotic index was measured by BD LSR2 flow cytometer (FHCRC Shared Resources).
Mitotic transit time
NSC and BTIC cells were transduced with control and BUB1B hairpins, respectively. After selection, cells were plated into a 96 well plate for time-lapse microscopy. During imaging, the atmosphere was maintained at a temperature of 37°C and 5% CO2. Imaging was performed using a Nikon Eclipse Ti microscope equipped with a live imaging system. Nikon elements software was used to collect and process data. Images were captured at 5.3 minute intervals for 16 hours.
Lagging chromosome assay
For one-step arrest in prometaphase, cells were treated overnight with the Eg5 kinesin inhibitor monastrol (100 μM final concentration) overnight. DAPI staining was performed to visualize abnormal anaphase frequency. Monastrol inhibits the mitotic kinesin Eg5/Kif11, a motor protein required for spindle bipolarity, and specifically arrest cells in G2/M (26, 34). Cells were washed and released into fresh media for 2 hours and then fixed (4% PF), permeabilized, stained with DAPI, and visualized using a Nikon Eclipse E800 (Scientific Imaging, FHCRC). >400 nuclei will be counted for each trial (n=5) and student’s t-test will determine significance. For asynchronous populations, cells were additionally stained with an MPM-2 antibody (Millipore), which marks mitotic cells, and counter stained with DAPI (Sigma). Approximately one third of MPM-2 positive cells in asynchronous cultures where in anaphase/telophase, while the other two thirds where in prometaphase or metaphase.
Chromosome alignment assays
For metaphase staining, cells were treated by 10 μM MG-132 (TOCRIS Bioscience) for 2 hours to arrest them at metaphase and then fixed for 20 min at room temperature with 4% formaldehyde in PBS and 0.2% Triton X-100. For cold stable microtubules, cells were incubated on ice for 15 min prior to fixation. After fixation, cells were blocked and stained with α-tubulin (Sigma, DM1A; 1:1000) and CREST anti-serum (Immunovision; 1:1000) at room temperature for 1 hour. Cells were washed and incubated with secondary antibody and DAPI for 1 hour in the dark. Immunolabeled cells were imaged on a Deltavision RT deconvolution microscope (Applied Precision Inc., Issaquah, WA). Optical sections were acquired at 0.2 micron spacing with an Olympus 100x/1.4 NA UPLS Apo objective. 3-D image stacks were deconvolved with Applied Precision’s proprietary software Softworx, using a constrained iterative algorithm. Deconvolved 3-D data were loaded into the visualization software Velocity (PerkinElmer, Waltham MA). The number of misaligned microtubule-attached kinetochores was counted based on CREST staining on 3-D rendered images, and confirmed by visual inspection of maximum intensity projections of whole cells. Misaligned kinetochores were defined as those with normalized distance <0.2. At least 30 cells were analyzed for each RNAi experiment.
Xenotransplantation
131 BTIC cells were infected with pGIPZ-shRNA virus and selected for 3 days in puromycin (2 μg/mL), such that >80% of cells were GFP+. Cells were then harvested using Accutase (Sigma), counted, resuspended in an appropriate volume of culture media, and kept on ice prior to immediate transplantation. NOD-scid IL2Rgammanull mice (Jackson Labs #005557) were anesthetized by IP injection of 0.2 ml/10 grams 1.25% Avertin Solution and kept at 37°C. A small bore hole was made in the skull using a hand drill with a Meisinger #009 steel burr bit (Hager & Meisinger GmbH). 2×10^5 cells were slowly injected by pipet into the right frontal cortex approximately 2 mm rostral to Bregma, 2 mm lateral and 3 mm deep through a 0.2–10 ul disposable sterile aerosol barrier tip (Fisher Scientific #02-707-30). The burr hole was closed using SURGIFOAM (Johnson & Johnson) and the skin rejoined using TISSUMEND II (Veterinary Product Laboratories, Phoenix AZ).
Brain Tumor Imaging
Seven weeks after initial transplantation mice were injected intravenously with 50 μl of 40 μM Chlorotoxin: Cy5.5 conjugate (50) 2 hours prior to sacrifice by carbon dioxide inhalation. The brain and tumor were removed from the skull and imaged for Cy5.5 and GFP fluorescence using the Xenogen IVIS Spectrum imaging system (Caliper Life Sciences).
Supplementary Material
Significance.
There are currently no effective therapies for GBM, the most frequent and aggressive brain tumor. Our results suggest that targeting BUB1B’s GLEBs domain activity may provide a therapeutic window for GBM, since the GLEBs domain is non-essential in untransformed cells. Moreover, the results further suggest that sister KT distances at metaphase may predict sensitivity to anti-cancer therapeutics targeting KT function.
Acknowledgments
We thank: Sue Biggins for critical reading of this manuscript; Jan van Deursen, Howard Fine, Russell Pieper, Xiao-Nan Li, Julian Simon, and Austin Smith for providing cell lines and/or reagents; Stacey Hansen and Sally Ditzler for technical help; Pam Lindberg and Laima Abele for administrative support; members of the Paddison and Olson labs for helpful discussions. This work was supported by grants from: the PEW scholar program (PP), the Accelerate Brain Cancer Cure foundation (PP), a UK-US Stem Cell Collaboration Development Award program (SP/PP), NCI/NIH CA15704 (PP), NCI/NIH CA170722-01 (PP), Phi Beta Psi Sorority cancer grant program (PP), the Listwin Family Foundation (PP), DoD translational new investigator award #W81XWH-11-1-0756 (PP), Association of American Cancer Institutes (YD), and NIH Interdisciplinary Training in Cancer Research Program #T32CA080416 (CH).
Footnotes
Disclosure of Potential Conflicts of Interest:
No potential conflicts of interest are disclosed by the authors.
Additional methods can be found in the Supplementary Information.
References
- 1.American Cancer Society. American Cancer Society: Cancer Facts and Figures. 2010. [Google Scholar]
- 2.Stupp R, Mason WP, van den Bent MJ, Weller M, Fisher B, Taphoorn MJ, et al. Radiotherapy plus concomitant and adjuvant temozolomide for glioblastoma. N Engl J Med. 2005 Mar 10;352(10):987–96. doi: 10.1056/NEJMoa043330. [DOI] [PubMed] [Google Scholar]
- 3.Hemmati HD, Nakano I, Lazareff JA, Masterman-Smith M, Geschwind DH, Bronner-Fraser M, et al. Cancerous stem cells can arise from pediatric brain tumors. Proc Natl Acad Sci U S A. 2003 Dec 9;100(25):15178–83. doi: 10.1073/pnas.2036535100. [DOI] [PMC free article] [PubMed] [Google Scholar]
- 4.Singh SK, Clarke ID, Terasaki M, Bonn VE, Hawkins C, Squire J, et al. Identification of a cancer stem cell in human brain tumors. Cancer Res. 2003 Sep 15;63(18):5821–8. [PubMed] [Google Scholar]
- 5.Singh SK, Hawkins C, Clarke ID, Squire JA, Bayani J, Hide T, et al. Identification of human brain tumour initiating cells. Nature. 2004 Nov 18;432(7015):396–401. doi: 10.1038/nature03128. [DOI] [PubMed] [Google Scholar]
- 6.Galli R, Binda E, Orfanelli U, Cipelletti B, Gritti A, De Vitis S, et al. Isolation and characterization of tumorigenic, stem-like neural precursors from human glioblastoma. Cancer Res. 2004 Oct 1;64(19):7011–21. doi: 10.1158/0008-5472.CAN-04-1364. [DOI] [PubMed] [Google Scholar]
- 7.Lee J, Kotliarova S, Kotliarov Y, Li A, Su Q, Donin NM, et al. Tumor stem cells derived from glioblastomas cultured in bFGF and EGF more closely mirror the phenotype and genotype of primary tumors than do serum-cultured cell lines. Cancer Cell. 2006 May;9(5):391–403. doi: 10.1016/j.ccr.2006.03.030. [DOI] [PubMed] [Google Scholar]
- 8.Pollard SM, Yoshikawa K, Clarke ID, Danovi D, Stricker S, Russell R, et al. Glioma Stem Cell Lines Expanded in Adherent Culture Have Tumor-Specific Phenotypes and Are Suitable for Chemical and Genetic Screens. Cell Stem Cell. 2009;4(6):568–80. doi: 10.1016/j.stem.2009.03.014. [DOI] [PubMed] [Google Scholar]
- 9.Stiles CD, Rowitch DH. Glioma stem cells: a midterm exam. Neuron. 2008 Jun 26;58(6):832–46. doi: 10.1016/j.neuron.2008.05.031. [DOI] [PubMed] [Google Scholar]
- 10.Bao S, Wu Q, McLendon RE, Hao Y, Shi Q, Hjelmeland AB, et al. Glioma stem cells promote radioresistance by preferential activation of the DNA damage response. Nature. 2006 Dec 7;444(7120):756–60. doi: 10.1038/nature05236. [DOI] [PubMed] [Google Scholar]
- 11.Bao S, Wu Q, Sathornsumetee S, Hao Y, Li Z, Hjelmeland AB, et al. Stem cell-like glioma cells promote tumor angiogenesis through vascular endothelial growth factor. Cancer Res. 2006 Aug 15;66(16):7843–8. doi: 10.1158/0008-5472.CAN-06-1010. [DOI] [PubMed] [Google Scholar]
- 12.Liu Q, Nguyen DH, Dong Q, Shitaku P, Chung K, Liu OY, et al. Molecular properties of CD133+ glioblastoma stem cells derived from treatment-refractory recurrent brain tumors. J Neurooncol. 2009 Aug;94(1):1–19. doi: 10.1007/s11060-009-9919-z. [DOI] [PMC free article] [PubMed] [Google Scholar]
- 13.Sawin KE, LeGuellec K, Philippe M, Mitchison TJ. Mitotic spindle organization by a plus-end-directed microtubule motor. Nature. 1992 Oct 8;359(6395):540–3. doi: 10.1038/359540a0. [DOI] [PubMed] [Google Scholar]
- 14.Hartwell LH, Szankasi P, Roberts CJ, Murray AW, Friend SH. Integrating genetic approaches into the discovery of anticancer drugs. Science. 1997 Nov 7;278(5340):1064–8. doi: 10.1126/science.278.5340.1064. [DOI] [PubMed] [Google Scholar]
- 15.Barbie DA, Tamayo P, Boehm JS, Kim SY, Moody SE, Dunn IF, et al. Systematic RNA interference reveals that oncogenic KRAS-driven cancers require TBK1. Nature. 2009 Nov 5;462(7269):108–12. doi: 10.1038/nature08460. [DOI] [PMC free article] [PubMed] [Google Scholar]
- 16.Luo J, Emanuele MJ, Li D, Creighton CJ, Schlabach MR, Westbrook TF, et al. A genome-wide RNAi screen identifies multiple synthetic lethal interactions with the Ras oncogene. Cell. 2009 May 29;137(5):835–48. doi: 10.1016/j.cell.2009.05.006. [DOI] [PMC free article] [PubMed] [Google Scholar]
- 17.Musacchio A, Salmon ED. The spindle-assembly checkpoint in space and time. Nat Rev Mol Cell Biol. 2007 May;8(5):379–93. doi: 10.1038/nrm2163. [DOI] [PubMed] [Google Scholar]
- 18.Sun Y, Pollard S, Conti L, Toselli M, Biella G, Parkin G, et al. Long-term tripotent differentiation capacity of human neural stem (NS) cells in adherent culture. Mol Cell Neurosci. 2008 Jun;38(2):245–58. doi: 10.1016/j.mcn.2008.02.014. [DOI] [PubMed] [Google Scholar]
- 19.Lens SM, Voest EE, Medema RH. Shared and separate functions of polo-like kinases and aurora kinases in cancer. Nat Rev Cancer. 2010 Dec;10(12):825–41. doi: 10.1038/nrc2964. [DOI] [PubMed] [Google Scholar]
- 20.Cancer Genome Atlas Research Network. Comprehensive genomic characterization defines human glioblastoma genes and core pathways. Nature. 2008 Oct 23;455(7216):1061–8. doi: 10.1038/nature07385. [DOI] [PMC free article] [PubMed] [Google Scholar]
- 21.Zhu J, Zhang B, Smith EN, Drees B, Brem RB, Kruglyak L, et al. Integrating large-scale functional genomic data to dissect the complexity of yeast regulatory networks. Nat Genet. 2008 Jul;40(7):854–61. doi: 10.1038/ng.167. [DOI] [PMC free article] [PubMed] [Google Scholar]
- 22.Tran LM, Zhang B, Zhang Z, Zhang C, Xie T, Lamb JR, et al. Inferring causal genomic alterations in breast cancer using gene expression data. BMC Syst Biol. 2011;5:121. doi: 10.1186/1752-0509-5-121. [DOI] [PMC free article] [PubMed] [Google Scholar]
- 23.Yang X, Deignan JL, Qi H, Zhu J, Qian S, Zhong J, et al. Validation of candidate causal genes for obesity that affect shared metabolic pathways and networks. Nat Genet. 2009 Apr;41(4):415–23. doi: 10.1038/ng.325. [DOI] [PMC free article] [PubMed] [Google Scholar]
- 24.Verhaak RG, Hoadley KA, Purdom E, Wang V, Qi Y, Wilkerson MD, et al. Integrated genomic analysis identifies clinically relevant subtypes of glioblastoma characterized by abnormalities in PDGFRA, IDH1, EGFR, and NF1. Cancer Cell. 2010 Jan 19;17(1):98–110. doi: 10.1016/j.ccr.2009.12.020. [DOI] [PMC free article] [PubMed] [Google Scholar]
- 25.Son MJ, Woolard K, Nam DH, Lee J, Fine HA. SSEA-1 is an enrichment marker for tumor-initiating cells in human glioblastoma. Cell Stem Cell. 2009 May 8;4(5):440–52. doi: 10.1016/j.stem.2009.03.003. [DOI] [PMC free article] [PubMed] [Google Scholar]
- 26.Cahill DP, Lengauer C, Yu J, Riggins GJ, Willson JK, Markowitz SD, et al. Mutations of mitotic checkpoint genes in human cancers. Nature. 1998 Mar 19;392(6673):300–3. doi: 10.1038/32688. [DOI] [PubMed] [Google Scholar]
- 27.Bie L, Zhao G, Cheng P, Rondeau G, Porwollik S, Ju Y, et al. The accuracy of survival time prediction for patients with glioma is improved by measuring mitotic spindle checkpoint gene expression. PLoS One. 2011;6(10):e25631. doi: 10.1371/journal.pone.0025631. [DOI] [PMC free article] [PubMed] [Google Scholar]
- 28.Yuan B, Xu Y, Woo JH, Wang Y, Bae YK, Yoon DS, et al. Increased expression of mitotic checkpoint genes in breast cancer cells with chromosomal instability. Clin Cancer Res. 2006 Jan 15;12(2):405–10. doi: 10.1158/1078-0432.CCR-05-0903. [DOI] [PubMed] [Google Scholar]
- 29.Santaguida S, Musacchio A. The life and miracles of kinetochores. Embo J. 2009 Sep 2;28(17):2511–31. doi: 10.1038/emboj.2009.173. [DOI] [PMC free article] [PubMed] [Google Scholar]
- 30.DeLuca JG, Moree B, Hickey JM, Kilmartin JV, Salmon ED. hNuf2 inhibition blocks stable kinetochore-microtubule attachment and induces mitotic cell death in HeLa cells. J Cell Biol. 2002 Nov 25;159(4):549–55. doi: 10.1083/jcb.200208159. [DOI] [PMC free article] [PubMed] [Google Scholar]
- 31.DeLuca JG, Gall WE, Ciferri C, Cimini D, Musacchio A, Salmon ED. Kinetochore microtubule dynamics and attachment stability are regulated by Hec1. Cell. 2006 Dec 1;127(5):969–82. doi: 10.1016/j.cell.2006.09.047. [DOI] [PubMed] [Google Scholar]
- 32.Maresca TJ, Groen AC, Gatlin JC, Ohi R, Mitchison TJ, Salmon ED. Spindle assembly in the absence of a RanGTP gradient requires localized CPC activity. Curr Biol. 2009 Jul 28;19(14):1210–5. doi: 10.1016/j.cub.2009.05.061. [DOI] [PMC free article] [PubMed] [Google Scholar]
- 33.Uchida KS, Takagaki K, Kumada K, Hirayama Y, Noda T, Hirota T. Kinetochore stretching inactivates the spindle assembly checkpoint. J Cell Biol. 2009 Feb 9;184(3):383–90. doi: 10.1083/jcb.200811028. [DOI] [PMC free article] [PubMed] [Google Scholar]
- 34.Lampson MA, Kapoor TM. The human mitotic checkpoint protein BubR1 regulates chromosome-spindle attachments. Nat Cell Biol. 2005 Jan;7(1):93–8. doi: 10.1038/ncb1208. [DOI] [PubMed] [Google Scholar]
- 35.DeLuca KF, Lens SM, DeLuca JG. Temporal changes in Hec1 phosphorylation control kinetochore-microtubule attachment stability during mitosis. J Cell Sci. 2011 Feb 15;124(Pt 4):622–34. doi: 10.1242/jcs.072629. [DOI] [PMC free article] [PubMed] [Google Scholar]
- 36.Malureanu LA, Jeganathan KB, Hamada M, Wasilewski L, Davenport J, van Deursen JM. BubR1 N terminus acts as a soluble inhibitor of cyclin B degradation by APC/C(Cdc20) in interphase. Dev Cell. 2009 Jan;16(1):118–31. doi: 10.1016/j.devcel.2008.11.004. [DOI] [PMC free article] [PubMed] [Google Scholar]
- 37.Tang Z, Bharadwaj R, Li B, Yu H. Mad2-Independent inhibition of APCCdc20 by the mitotic checkpoint protein BubR1. Dev Cell. 2001 Aug;1(2):227–37. doi: 10.1016/s1534-5807(01)00019-3. [DOI] [PubMed] [Google Scholar]
- 38.Davenport J, Harris LD, Goorha R. Spindle checkpoint function requires Mad2-dependent Cdc20 binding to the Mad3 homology domain of BubR1. Exp Cell Res. 2006 Jun 10;312(10):1831–42. doi: 10.1016/j.yexcr.2006.02.018. [DOI] [PubMed] [Google Scholar]
- 39.Harris L, Davenport J, Neale G, Goorha R. The mitotic checkpoint gene BubR1 has two distinct functions in mitosis. Exp Cell Res. 2005 Aug 1;308(1):85–100. doi: 10.1016/j.yexcr.2005.03.036. [DOI] [PubMed] [Google Scholar]
- 40.Mao Y, Desai A, Cleveland DW. Microtubule capture by CENP-E silences BubR1-dependent mitotic checkpoint signaling. J Cell Biol. 2005 Sep 12;170(6):873–80. doi: 10.1083/jcb.200505040. [DOI] [PMC free article] [PubMed] [Google Scholar]
- 41.Wang X, Babu JR, Harden JM, Jablonski SA, Gazi MH, Lingle WL, et al. The mitotic checkpoint protein hBUB3 and the mRNA export factor hRAE1 interact with GLE2p-binding sequence (GLEBS)-containing proteins. J Biol Chem. 2001 Jul 13;276(28):26559–67. doi: 10.1074/jbc.M101083200. [DOI] [PubMed] [Google Scholar]
- 42.Wang Q, Liu T, Fang Y, Xie S, Huang X, Mahmood R, et al. BUBR1 deficiency results in abnormal megakaryopoiesis. Blood. 2004 Feb 15;103(4):1278–85. doi: 10.1182/blood-2003-06-2158. [DOI] [PubMed] [Google Scholar]
- 43.Elowe S, Dulla K, Uldschmid A, Li X, Dou Z, Nigg EA. Uncoupling of the spindle-checkpoint and chromosome-congression functions of BubR1. J Cell Sci. 2010 Jan 1;123(Pt 1):84–94. doi: 10.1242/jcs.056507. [DOI] [PubMed] [Google Scholar]
- 44.Park DM, Rich JN. Biology of glioma cancer stem cells. Mol Cells. 2009 Jul 31;28(1):7–12. doi: 10.1007/s10059-009-0111-2. [DOI] [PubMed] [Google Scholar]
- 45.Sudakin V, Yen TJ. Targeting mitosis for anti-cancer therapy. BioDrugs. 2007;21(4):225–33. doi: 10.2165/00063030-200721040-00003. [DOI] [PubMed] [Google Scholar]
- 46.Wood KW, Lad L, Luo L, Qian X, Knight SD, Nevins N, et al. Antitumor activity of an allosteric inhibitor of centromere-associated protein-E. Proc Natl Acad Sci U S A. 2010 Mar 30;107(13):5839–44. doi: 10.1073/pnas.0915068107. [DOI] [PMC free article] [PubMed] [Google Scholar]
- 47.Zecevic M, Catling AD, Eblen ST, Renzi L, Hittle JC, Yen TJ, et al. Active MAP kinase in mitosis: localization at kinetochores and association with the motor protein CENP-E. J Cell Biol. 1998 Sep 21;142(6):1547–58. doi: 10.1083/jcb.142.6.1547. [DOI] [PMC free article] [PubMed] [Google Scholar]
- 48.Liao H, Li G, Yen TJ. Mitotic regulation of microtubule cross-linking activity of CENP-E kinetochore protein. Science. 1994 Jul 15;265(5170):394–8. doi: 10.1126/science.8023161. [DOI] [PubMed] [Google Scholar]
- 49.Sonoda Y, Ozawa T, Hirose Y, Aldape KD, McMahon M, Berger MS, et al. Formation of intracranial tumors by genetically modified human astrocytes defines four pathways critical in the development of human anaplastic astrocytoma. Cancer Res. 2001 Jul 1;61(13):4956–60. [PubMed] [Google Scholar]
- 50.Veiseh M, Gabikian P, Bahrami SB, Veiseh O, Zhang M, Hackman RC, et al. Tumor paint: a chlorotoxin: Cy5.5 bioconjugate for intraoperative visualization of cancer foci. Cancer Res. 2007;67(14):6882–8. doi: 10.1158/0008-5472.CAN-06-3948. [DOI] [PubMed] [Google Scholar]
Associated Data
This section collects any data citations, data availability statements, or supplementary materials included in this article.