

MR imaging with proton density fat fraction (PDFF) permitted high overall accuracy with moderate sensitivity and high specificity for classification of dichotomized steatosis grade, and these results support the conduct of further studies to help validate MR imaging–PDFF as a biomarker of hepatic steatosis in nonalcoholic fatty liver disease.
Abstract
Purpose:
To evaluate the diagnostic performance of magnetic resonance (MR) imaging–estimated proton density fat fraction (PDFF) for assessing hepatic steatosis in nonalcoholic fatty liver disease (NAFLD) by using centrally scored histopathologic validation as the reference standard.
Materials and Methods:
This prospectively designed, cross-sectional, internal review board–approved, HIPAA-compliant study was conducted in 77 patients who had NAFLD and liver biopsy. MR imaging–PDFF was estimated from magnitude-based low flip angle multiecho gradient-recalled echo images after T2* correction and multifrequency fat modeling. Histopathologic scoring was obtained by consensus of the Nonalcoholic Steatohepatitis (NASH) Clinical Research Network Pathology Committee. Spearman correlation, additivity and variance stabilization for regression for exploring the effect of a number of potential confounders, and receiver operating characteristic analyses were performed.
Results:
Liver MR imaging–PDFF was systematically higher, with higher histologic steatosis grade (P < .001), and was significantly correlated with histologic steatosis grade (ρ = 0.69, P < .001). The correlation was not confounded by age, sex, lobular inflammation, hepatocellular ballooning, NASH diagnosis, fibrosis, or magnetic field strength (P = .65). Area under the receiver operating characteristic curves was 0.989 (95% confidence interval: 0.968, 1.000) for distinguishing patients with steatosis grade 0 (n = 5) from those with grade 1 or higher (n = 72), 0.825 (95% confidence interval: 0.734, 0.915) to distinguish those with grade 1 or lower (n = 31) from those with grade 2 or higher (n = 46), and 0.893 (95% confidence interval: 0.809, 0.977) to distinguish those with grade 2 or lower (n = 58) from those with grade 3 (n = 19).
Conclusion:
MR imaging–PDFF showed promise for assessment of hepatic steatosis grade in patients with NAFLD. For validation, further studies with larger sample sizes are needed.
© RSNA, 2013
Introduction
Nonalcoholic fatty liver disease (NAFLD) is an emerging epidemic that is identified in approximately 10% of children and 20%–30% of adults in the Western world (1,2). It is associated with obesity and type 2 diabetes mellitus (3), and patients with NAFLD may develop nonalcoholic steatohepatitis (NASH), cirrhosis, and end-stage liver failure (4). Liver steatosis is the excessive and pathologic intrahepatocellular accumulation of fat (mainly as triglyceride), and it is a histologic hallmark and possible pathogenic factor in this disease (5). Currently, liver biopsy is the reference standard for the diagnosis and grading (semiquantitative assessment) of hepatic steatosis (6,7). However, liver biopsy is invasive and observer dependent (8–12). These limitations make liver biopsy an inappropriate tool for screening, frequent monitoring, and epidemiologic studies, and they hamper its use for many other aspects of clinical care and research. Noninvasive alternatives to biopsy for assessment of hepatic steatosis are desirable.
Magnetic resonance (MR) spectroscopy is widely regarded as the most accurate noninvasive method to assess hepatic steatosis. Performed correctly, MR spectroscopy measures the hepatic proton density fat fraction (PDFF), which represents the proportion of the mobile proton density of the liver that is attributable to fat and that can thus be utilized as an objective biomarker of liver fat content. MR spectroscopy is not widely available, is time consuming to perform and analyze, and typically samples only a portion of the liver. Because of the limitations of spectroscopy, rapid MR imaging–based techniques that estimate the hepatic PDFF across the entire liver have been developed (13–18). These MR imaging–based PDFF estimation techniques address confounding factors (eg, T1 bias, T2* decay, multifrequency signal interference effects caused by protons in fat) that introduce errors into fat quantification by using simpler MR imaging techniques, such as a 2- or 3-point Dixon technique (13,16,19).
While MR imaging–PDFF estimation techniques have been shown to be accurate by using fat-water phantoms (20,21) and MR spectroscopy (13–18,21) as the reference standard, they have not been fully validated in patients by using histologic validation as the reference standard. In the validation of these techniques, the use of histologic validation as the reference standard has two important advantages over the use of fat-water phantoms or MR spectroscopy. First, histologic validation is the current clinical and research reference standard for grading hepatic steatosis. Second, only histologic validation can evaluate whether MR imaging–PDFF estimation is confounded by concomitant histologic abnormalities (eg, lobular inflammation, hepatocellular ballooning, fibrosis, and iron) that may alter MR signals and potentially corrupt the MR imaging–PDFF estimation. For these reasons, histologic validation of MR imaging–PDFF techniques is needed before they can be implemented as noninvasive alternatives to liver biopsy for assessment of hepatic steatosis.
The purpose of this study was to evaluate the diagnostic performance of an MR imaging–PDFF estimation technique for grading hepatic steatosis in NAFLD by using histopathologic validation as the reference standard.
Materials and Methods
Study Design and Patients
This prospectively designed, cross-sectional, single-site study was approved by the University of California, San Diego, institutional review board, is compliant with the Health Insurance Portability and Accountability Act, and was performed as an ancillary study to the NASH Clinical Research Network (CRN) and is sponsored by the National Institute of Diabetes and Digestive and Kidney Diseases.
Consecutive eligible patients were recruited over a 4-year period (August 2005 to May 2009) from pediatric and adult research participants who were already enrolled at the University of California, San Diego NASH CRN clinical center. Because they were NASH CRN research participants, all patients who were recruited for this ancillary study had NAFLD. These patients had already undergone an extensive clinical, laboratory, and histologic evaluation by NASH CRN investigators to exclude moderate, heavy, or binge alcohol consumption; chronic liver disease other than NAFLD, such as viral, cholestatic, or autoimmune liver disease; use of drugs associated with steatosis, such as amiodarone or methotrexate; or exposure to other known hepatotoxins (22,23).
Patients were enrolled in this ancillary study if they were able to undergo MR imaging, if a liver biopsy was performed for clinical care or as a NASH CRN research procedure, and if the liver biopsy was reviewed by the NASH CRN Pathology Committee. Patients were excluded if the time interval between biopsy and MR imaging examination exceeded 180 days.
MR Imaging Examination
Patients were examined while they were in the supine position with a standard torso phased-array coil centered over the liver at 1.5 T (Symphony; Siemens Medical Systems, Erlangen, Germany; four-channel coil) or 3 T (Signa Excite HD; GE Medical Systems, Milwaukee, Wis; eight-channel coil). The 1.5-T MR imager was used in the first 4 years of the study and the 3-T imager in the last year of the study, when it became the designated research imager at our institution. MR imaging–PDFF estimation by the two imagers has previously been shown (24) to be highly correlated (r = 0.992) with an average absolute discrepancy of less than 1 percentage point.
To estimate MR imaging–PDFF, unenhanced axial images were obtained by using a two-dimensional spoiled gradient-recalled echo sequence with all array coil elements. To minimize T1 effects, a 10° flip angle was used (13,20,25) at repetition time (TR) 120–270 msec, adjusted by the technologist to individual breath-hold capacity. To permit estimation of fat-water signal interference and T2* effects (13,25,26), six echoes were obtained at serial opposed-phase and in-phase echo time (TE) (2.3, 4.6, 6.9, 9.2, 11.5, and 13.8 msec at 1.5 T; 1.15, 2.3, 3.45, 4.6, 5.75, and 6.9 msec at 3.0 T) during a single breath hold of 12–34 seconds. Other imaging parameters were 8-mm section thickness, 100% intersection gap, 500 Hz/pixel (1.5 T) or 1480 Hz/pixel (3.0 T) receiver bandwidth, one signal average, and rectangular field of view with a 192–256 × 160–256 matrix adjusted to individual body habitus and breath-hold capacity. The number of sections ranged from eight to over 20, depending on TR, number of phase encodes, and the TE of the last echo (13.8 msec at 1.5 T; 6.9 msec at 3.0 T). The entire liver was not necessarily imaged in the version of the MR imaging technique used in this study. The multiecho source images were sent offline for postprocessing.
MR Imaging Post Processing
MR imaging–PDFF maps were generated offline from the source images, pixel by pixel, by using a custom plug-in algorithm created for open-source software (Osirix; Osirix Foundation, Geneva, Switzerland). The algorithm simultaneously estimated T2* and PDFF in each pixel on the image by using nonlinear least-squares fitting from all six echoes (16) by assuming exponential decay. To address multifrequency interference effects of protons in fat, the algorithm incorporated a triglyceride model derived from spectroscopy measurements of human liver fat in vivo by Hamilton et al (27). The triglyceride model normalized the proton density of the fat peaks as follows: 4.7% (5.3 ppm), 3.9% (4.2 ppm), 0.6% (2.75 ppm), 12.0% (2.1 ppm), 70.0% (1.3 ppm) and 8.8% (0.9 ppm). The PDFF in each pixel then was calculated as the ratio of the fat proton density to the total (fat and water) proton density (28,29).
Image Analysis
Two trained image analysts (1 and 2 years of experience) reviewed images by using Osirix; they manually placed circular regions of interest that were approximately 20 mm in diameter in each of the nine Couinaud liver segments on the PDFF maps in each patient. The mean PDFF in each of the nine regions of interest was recorded. As recently shown by Hines et al (30), multiple regions of interest averaged across the liver improved the precision of MR imaging–PDFF estimation.
Liver Biopsy
Fifteen- to 18-gauge percutaneous liver biopsies were performed by NASH CRN investigators for clinical care or as NASH CRN research procedures. Only one biopsy was performed per patient. Hematoxylin-eosin, periodic acid–Schiff, and reticulin stains were used.
Histopathologic Analysis
The NASH CRN Pathology Committee, comprised of nine hepatopathologists with expertise in NAFLD (one pathologist from each of the eight main NASH CRN clinical centers and one from the National Cancer Institute), provided consensus for those in attendance at the meeting on the interpretation of the biopsy according to the standardized NASH CRN histologic scoring system for NAFLD (31) (Table 1). Steatosis was graded according to the proportion of hepatocytes that contained macrovesicles of fat by using the following ordinal scale: grade 0 for less than 5%, grade 1 for 5%–33%, grade 2 for 33%–66%, and grade 3 for more than 66%. Lobular inflammation was graded on an ordinal scale from 0 to 3 according to the number of inflammatory foci per ×200 magnification field; hepatocellular ballooning was graded on an ordinal scale from 0 to 2 according to number of ballooned cells; and hepatocellular iron was graded on an ordinal scale from 0 to 4 according to the magnification needed to visualize hepatocellular iron deposits. Fibrosis was staged on an ordinal scale from 0 to 4 according to extent and distribution of fibrosis and degree of architectural remodeling. Steatohepatitis diagnosis was categorized as absent, possible, or definite (31,32). Histologic scores were recorded.
Table 1.
Characteristics in 77 Patients
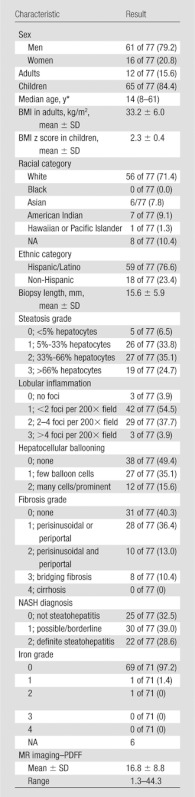
Note.—Numbers in parentheses are percentages, unless otherwise specified. NA = not applicable.
Numbers in parentheses are range.
Blinding
The image analysts were blinded to histopathologic results. Pathologists were blinded to imaging results.
Other Data
Patient demographics and height and weight measurements contemporaneous with MR examinations were provided by the NASH CRN. Body mass index (BMI) was calculated in adults, and normalized BMI z scores were calculated in children. In adults, a BMI of 25.0–29.9 kg/m2 indicated overweight and a BMI greater than 30 indicated obesity. In children, the BMI z score reflected the number of standard deviations above or below the mean. A z score above 2 indicated obesity, and a z score above 3 indicated severe obesity.
Statistical Analysis
Statistical analyses were supervised by a professor of statistics (A.C.G., more than 15 years of experience) and performed by both a senior level biostatistician (T.W., more than 15 years of experience) with statistical computing software (R, version 2.10.1; R Foundation for Statistical Computing, Vienna, Austria) and A.T. (2 years of experience) with statistical software (SPSS for Macintosh, version 19.0; SPSS, Chicago, Ill). The average MR imaging–PDFF value across the nine segmental regions of interest in each patient was calculated and recorded as the per-patient MR imaging–PDFF. The demographic, histologic, and imaging information of the study patients were summarized. Categoric variables were expressed as numbers and percentages. Continuous variables were expressed as the mean ± standard deviation.
Grading comparison.—The per-patient MR imaging–PDFF estimates were compared across histologic steatosis grades by using the Jonckheere-Terpstra test for ordered alternatives.
Correlation analysis.—The Spearman correlation coefficient between per-patient MR imaging–PDFF and steatosis grade as determined by histologic analysis was computed and its significance assessed. To explore the effect of the time interval between MR imaging and biopsy on the agreement between MR imaging–PDFF and steatosis grade, the correlation coefficient was recomputed in subsets of the cohort with progressively narrower MR imaging–biopsy time intervals (≤84 days, ≤42 days, ≤28 days, ≤14 days, ≤7 days).
Confounding variables.—The potential confounding effects of numerous covariates (age, sex, lobular inflammation, hepatocellular ballooning, NASH diagnosis, fibrosis, iron, and magnetic field strength) on the relationship between histologic steatosis grade and per-patient MR imaging–PDFF were explored. We used additivity and variance stabilization for regression to monotonically transform steatosis grade, MR imaging–PDFF, and potential covariates in such a way that the regression of steatosis grade and the regression of MR imaging–PDFF on new covariates were approximately linear with constant variance (33). We performed two Spearman correlations: a correlation between transformed steatosis grade and transformed MR imaging–PDFF, and a partial correlation between steatosis grade and MR imaging–PDFF (a correlation between two sets of partial residuals, which is the correlation between steatosis grade and MR imaging–PDFF adjusted for the covariates of interest). The two correlations were then compared by using a nonparametric test based on the bootstrap method.
Diagnostic accuracy.—The discriminatory capability of per-patient MR imaging–PDFF for different steatosis grades was tested by using the following dichotomizations: 0 versus 1 or greater; 1 or less versus 2 or greater; 2 or less versus 3.
For each set of dichotomized steatosis grades, the area under the receiver operating characteristic curve was calculated. The lowest MR imaging–PDFF threshold value that provided 90% or greater specificity to distinguish between dichotomized steatosis grades was selected. At that MR imaging–PDFF threshold value, the raw sensitivity, specificity, accuracy, positive predictive value, and negative predictive value to distinguish between dichotomized steatosis grades were calculated. Jackknife leave-one-out cross validation was applied to all the obtained performance parameters to generate cross-validated parameters. Exact binomial confidence intervals were constructed around each performance parameter, both raw and cross validated. To explore the effect of MR imaging–biopsy time interval on the observed accuracy of MR imaging–PDFF for grading hepatic steatosis, the area under the receiver operating characteristic curve was recomputed in a subset of the cohort with an MR imaging–biopsy time interval of 42 days or fewer.
Results
Patients
Seventy-eight patients underwent MR imaging. One patient was excluded because the time interval between biopsy and MR imaging exceeded 180 days (216 days). Thus, this study included 77 patients with both MR imaging and liver biopsy (Fig 1, Table 1). The time interval between MR imaging and biopsy ranged from 0 to 167 days (median, 11 days; mean, 29 days). Sixty-eight MR imaging examinations were performed at 1.5 T from 2005 to 2009, and nine were performed at 3.0 T in 2009. Of the patients, 84.4% (65 of 77) were children. Fifty-six of 77 patients (72.7%) were white. Fifty-nine of 77 patients (76.6%) were of Hispanic descent. The majority (79.2% [61 of 77]) of patients were men. Among 12 adults, five were overweight and seven were obese; the mean BMI in adults was 33.2 ± 6.0.
Figure 1:

Flowchart of patient selection.
Among 65 children, 45 were obese and one was severely obese; the mean BMI z score in children was 2.3 ± 0.4.
MR Imaging PDFF
The MR imaging–PDFF was 3.8% ± 2.4% in patients with steatosis grade 0 (n = five), 12.5% ± 4.6% in patients with grade 1 (n = 26), 16.5% ± 6.2% in patients with grade 2 (n = 27), and 26.5% ± 8.3% in patients with grade 3 (n = 19). Mean MR imaging–PDFF was 17.0% in children and 16.2% in adult patients. Figure 2 shows source MR images at a representative section in a child with grade-3 steatosis determined by histologic validation, the signal model for a representative pixel, and the MR imaging–PDFF map on which segmental regions of interest were placed.
Figure 2:

NAFLD in a 8-year-old girl with grade-3 steatosis determined by histologic validation. Average PDFF across the nine segments in this patient was 39%. A–F, Multiecho MR imaging with TEs of 2.3, 4.6, 6.9, 9.2, 11.5, and 13.8 msec, respectively. G, Plot of signal intensity (in arbitrary units) in a representative pixel acquired over the range 2.3–13.8 msec. H, Estimated grayscale MR imaging–PDFF map with the multiecho multi-interference image analysis technique. PDFF for the individual pixel at the tip of the arrows was estimated to be 38%, and T2* was estimated to be 25 msec.
Grading Comparison
MR imaging–PDFF differed significantly between steatosis grades (Fig 3). A Jonckheere-Terpstra test indicated statistical significance of the data: higher steatosis grades determined by histologic validation corresponded to higher MR imaging–PDFF medians (z score, 6.47; P < .001).
Figure 3:

Box and whisker plot shows MR imaging–estimated PDFF is higher with progressively larger steatosis grade. The percentage range of hepatocytes with macrovesicular steatosis is shown in parentheses along the x-axis. MRI = MR imaging.
Correlation Analysis
Overall, the Spearman correlation coefficient between the steatosis grade and MR imaging–PDFF was positive and statistically significant (ρ = 0.69; 95% confidence interval: 0.50, 0.81; P < .001). The correlation between steatosis grade and MR imaging–PDFF increased in subsets of the cohort with progressively narrower MR imaging–biopsy time intervals (Table 2), although this effect was not formally tested. In the 24 patients with an MR imaging–biopsy time interval of 7 days or less, ρ = 0.85.
Table 2.
Spearman Correlation between Steatosis Grade and MR Imaging–PDFF in Subsets of Patients with Progressively Narrower MR Imaging–Biopsy Time Intervals
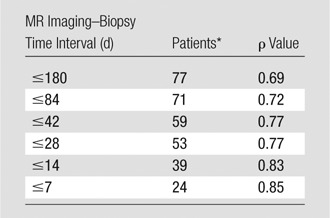
Number of patients in each specified MR imaging–biopsy time interval.
Confounding Variables
In six patients, iron staining was not performed. Among the 71 patients in whom iron staining was performed, the majority of patients (97.2%, 69 of 71) had no excess iron deposition detected by histologic validation. In the two patients with excess hepatocellular iron, the iron grades were 1 and 2 on a 0–4 ordinal scale. Because of the low prevalence and mildness of hepatic iron overload in our cohort, the potential confounding effect of hepatic iron on the relationship between histologic steatosis grade and per-patient MR imaging–PDFF was not analyzed.
The partial correlation coefficient between steatosis and MR imaging–PDFF, adjusted for the effect of covariates other than iron, was 0.64 (95% confidence interval: 0.47, 0.78). The difference between the unadjusted and adjusted correlation coefficients (0.69 and 0.64, respectively) was not statistically significant (P = .65), which suggested that age, sex, magnetic field strength, and concomitant histologic features (lobular inflammation, hepatocellular ballooning, NASH diagnosis, fibrosis) did not modify the relationship between steatosis and MR imaging–PDFF in our cohort.
Diagnostic Accuracy
Raw estimates of sensitivity, specificity, positive predictive value, and negative predictive value to detect specific grades of steatosis with MR imaging were calculated by using receiver operating characteristic curve analysis (Table 3, Fig 4). Cross-validated estimates of diagnostic accuracy are reported in Table 4.
Table 3.
Diagnostic Accuracy of MR Imaging–PDFF for Grading Hepatic Steatosis: Raw Performance Parameters
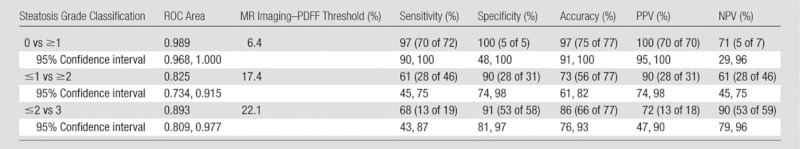
Note.—Numbers in parentheses were used to calculate percentages. NPV = negative predictive value, PPV = positive predictive value, ROC = receiver operating characteristic.
Figure 4:

Receiver operating characteristic curve analysis of MR imaging–PDFF for classification of dichotomized steatosis grades determined by histologic validation: 0 versus ≥1 (area under the curve = 0.989), ≤1 versus ≥2 (area under the curve = 0.825), and ≤2 versus 3 (area under the curve = 0.893).
Table 4.
Diagnostic Accuracy of MR Imaging–PDFF for Grading Hepatic Steatosis: Cross-validated Performance Parameters
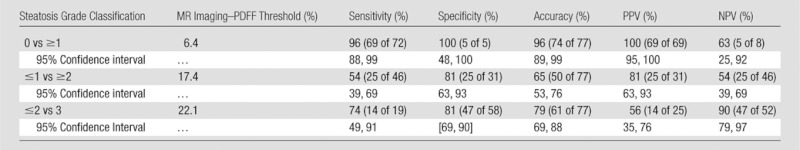
Note.—Data in parentheses are raw. NPV = negative predictive value, PPV = positive predictive value.
To distinguish patients with steatosis grade 0 (n = five) from those with grade 1 or greater (n = 72), MR imaging–PDFF had an area under the receiver operating characteristic curve of 0.989 (95% confidence interval: 0.968, 1.000). A 6.4% MR imaging–PDFF threshold provided 97% raw sensitivity (96% cross validated), 100% raw specificity (100% cross validated), 100% raw positive predictive value (100% cross validated), and 71% raw negative predictive value (63% cross validated). Two patients had false-negatives: one had MR imaging–PDFF of 4.9% and the other 4.3%; they had histologic steatosis grades 1 and 2, respectively. No patient had a false-positive.
To distinguish patients with steatosis grade 1 or less (n = 31) from patients with grade 2 or greater (n = 46), MR imaging–PDFF had an area under the receiver operating characteristic curve of 0.825 (95% confidence interval: 0.734, 0.915). A 17.4% MR imaging–PDFF threshold provided 61% raw sensitivity (54% cross validated), 90% raw specificity (81% cross validated), 90% raw positive predictive value (81% cross validated), and 61% raw negative predictive value (54% cross validated). Eighteen patients had false negatives: they had MR imaging–PDFFs from 4% to 17% and histologic steatosis grades 2 or 3. Three patients had false positives: they had MR imaging–PDFFs from 18% to 23% and histologic steatosis grade 1.
To distinguish patients with steatosis grade 2 or less (n = 58) from patients with grade 3 (n = 19), MR imaging–PDFF had an area under the receiver operating characteristic curve of 0.893 (95% confidence interval: 0.809, 0.977). A 22.1% MR imaging–PDFF threshold provided 68% raw sensitivity (74% cross validated), 91% raw specificity (81% cross validated), 72% raw positive predictive value (56% cross validated), and 90% raw negative predictive value (90% cross validated). Six patients had false negatives: they had MR imaging–PDFFs from 11% to 22% and histologic steatosis grade 3. Five patients had false positives: they had MR imaging–PDFFs from 23% to 31% and histologic steatosis grades 1 or 2.
In the 59 patients who had biopsy time intervals of 42 days or less, MR imaging–PDFF had areas under the receiver operating characteristic curve that were the following: 0.991 to distinguish patients with steatosis grade 0 (n = 4) from those with grade 1 or greater (n = 55); 0.870 to distinguish those with steatosis grade 1 or less (n = 24) from those with grade 2 or greater (n = 35); and 0.940 to distinguish those with steatosis grade 2 or less (n = 14) from those with grade 3 (n = 55) (Table 2).
Discussion
This prospective clinical study evaluated MR imaging–PDFF as a biomarker of hepatic steatosis by using histopathologic analysis as the reference standard. All patients were NASH CRN participants and had NAFLD that was confirmed by previous histologic analysis, but steatosis had resolved in five patients by the time biopsy was obtained for this study. Liver biopsy specimens were read in consensus according to the NAFLD histologic scoring system by the NASH CRN Pathology Committee (31).
We found that the median MR imaging–PDFF was progressively higher with greater histologic steatosis grades, and that MR imaging–PDFF correlated with the steatosis grade. Several potential confounders (age, sex, lobular inflammation, hepatocellular ballooning, NASH diagnosis, fibrosis, and magnetic field strength) did not demonstrably affect the correlation between MR imaging–PDFF and histologic steatosis grades in our cohort. We also derived MR imaging–PDFF thresholds that accurately distinguished patients with dichotomized steatosis grades.
While strong correlations were achieved, we did not expect a perfect agreement between MR imaging–PDFF and the histologic grade. Some of the inaccuracy may be inherent to the MR imaging technique. However, additional factors may play a role. One source of disparity may be that MR imaging–PDFF estimates the proportion of mobile protons contained within fat molecules in a three-dimensional liver voxel (19), whereas histologic analysis assesses the proportion of hepatocytes that contain macrovesicles of fat in a two-dimensional slide (31,32). Hence, the two parameters (MR imaging–PDFF and histologic grade) assess different aspects of steatosis. Moreover, hepatic fat content may change over time (34), and any meaningful change in fat content during the biopsy–MR imaging interim would be expected to weaken the observed correlation between MR imaging–PDFF and steatosis grade. In keeping with this supposition, we found that the correlation between MR imaging–PDFF and steatosis grade increased as the MR imaging–biopsy time interval was incrementally narrowed; informally, the highest correlation was observed in the subset of patients in whom the time interval was 7 days or less. Similarly, we also observed that the area under the receiver operating characteristic curve that distinguished dichotomized steatosis grades was higher in the subset of patients with MR imaging–biopsy time interval of 42 days or less than in the entire cohort. Based on these observations, we speculated that even higher MR imaging–PDFF grading accuracy may be found in future studies with MR imaging–biopsy time intervals that are smaller than the 180 days selected for this study. Sampling variability in hepatic steatosis grading by biopsy has been documented (12), and may have contributed to the observed disparity.
The strong correlation between MR imaging–PDFF and steatosis grade agrees with observations from different research groups by using MR imaging–based methods for fat quantification in mouse models of hepatic steatosis. For example, Hines et al (35) compared MR imaging fat fraction with histologic analysis and lipid extraction in ob/ob mice fed ad libitum. The authors found that a chemical shift-based MR technique, known as iterative decomposition of water and fat with echo asymmetry and least-squares estimation, corrected for T1 bias and T2* decay and, by applying a spectral model of fat (as done in our study), accurately quantifies fat in vivo in an animal model.
Similarly, Marsman et al (36) found high correlations between MR spectroscopy fat fraction with histopathologic and lipid extraction in rats fed a methionine and choline-deficient diet. The authors also found that MR spectroscopy could accurately discriminate between steatosis grades.
In a study of human subjects, Qayyum et al (37) found relatively low correlations between histologic analysis–determined steatosis grade and liver fat content estimated by a gradient-recalled echo sequence. The authors attributed the relatively low accuracy of fat quantification by gradient-recalled echo sequences to the confounding effects of cirrhosis, which is associated with liver iron deposition and T2* shortening. The technique used in our study corrected for T2* and other confounding effects, unlike the two-point Dixon method used by Qayyum et al. Addressing T2* and other confounding effects may explain the higher accuracy of steatosis grades achieved by the gradient-recalled echo technique used in this study. However, our cohort consisted exclusively of patients with NAFLD, none of whom had cirrhosis and the vast majority of whom did not have excess liver iron deposition. Therefore, further studies are needed to evaluate the performance of the MR imaging–PDFF estimation technique used in our study in patients with cirrhosis and iron overload as well. Recent in vivo studies (38,39) simulated hepatic iron overload in patients by intravenous administration of iron oxides. These studies reported that experimentally induced T2* shortening caused underestimation of fat content with dual-echo methods (which neglect T2* decay), but had only minimal effects on fat estimation by using multiecho methods (which correct for T2* decay).
Most prior studies that evaluated MR imaging–PDFF for fat quantification relied on either fat-water phantoms (20,21) or MR spectroscopy (13–18,21) as the reference standard, rather than histologic validation. A few prior studies have evaluated the correlation between histologic validation and MR imaging–PDFF measured with magnitude-based (40) or complex-based (41,42) MR imaging fat quantification methods, but these studies did not analyze MR imaging thresholds to distinguish patients with dichotomized steatosis grades. Other studies suggested MR imaging thresholds based on out-of-phase signal loss (43,44) or T2* corrected fat fraction (45), but these studies did not evaluate MR imaging–PDFF. To our knowledge, our study is the first to identify MR imaging thresholds based on PDFF. This is important because PDFF addresses the confounding effects that corrupt fat fraction estimation with simpler techniques, and it therefore shows promise as a standardized biomarker, reproducible across platforms and field strengths (24), and robust to acquisition parameter variation (46).
To distinguish steatosis at the high thresholds of specificity that were preselected to provide 90% or greater raw specificity, we found moderate to high sensitivity (61%–100% for raw estimates and 54%–96% for cross-validated estimates) for grade 0 versus 1 or greater, grade 1 or less versus 2 or greater, and grade 2 or less versus 3. The cross-validated specificity at these thresholds ranged from 81%–100%. These findings suggested that MR imaging–PDFF may be useful for noninvasive grading of steatosis. Considering the excellent agreement demonstrated between MR imaging–PDFF and MR spectroscopy–PDFF in prior studies of magnitude-based (16,17) and complex-based (18,30) MR imaging methods, it is likely that any advanced MR imaging–PDFF quantification method, whether magnitude or complex based, would show a similar diagnostic performance to distinguish histologic grades.
Our study was limited by small sample size in each dichotomized steatosis class and overall. Hence, the confidence intervals for many of the diagnostic parameter estimates were wide. In particular, the wide confidence interval around the specificity for steatosis grade 0 versus other steatosis grades reflected the instability of an estimate based on five patients in the steatosis grade–0 group. Moreover, the thresholds were derived from the cohort in which they were tested. While the derivation and testing of diagnostic thresholds in the same cohort is common in radiology studies, caution should be applied to the interpretation and implementation of thresholds that are not externally validated. For these reasons, diagnostic thresholds should be regarded as preliminary, and we do not recommend that these thresholds be applied as either clinical care or endpoints in clinical trials until they are validated in larger independent cohorts. Such studies should be conducted by using narrow time intervals between MR imaging and biopsy.
Another limitation of our study was that we were unable to address the potentially confounding effect of iron on the accuracy of fat quantification (47), as described earlier. A more fundamental limitation is that MR imaging–PDFF estimation is insufficient to evaluate many critical histologic features of NAFLD, including presence of NASH, degree of necroinflammatory activity, and stage of fibrosis. Therefore, additional biomarkers to evaluate these critical features are necessary before MR imaging–based methods can completely replace biopsy (48,49). Finally, the location of the biopsies was not recorded, and thus we are unable to assess the affect of biopsy location on the correlation between MR imaging–PDFF and histologic steatosis grade.
In conclusion, this cross-sectional study showed agreement between MR imaging–PDFF histologic steatosis grades that were centrally scored in a small cohort of research patients who were suspected of having or who had known NAFLD. In our cohort, MR imaging–PDFF permitted high overall accuracy with moderate sensitivity and high specificity for classification of dichotomized steatosis grade. These results support the conduct of further studies to help validate MR imaging–PDFF as a biomarker of hepatic steatosis in NAFLD.
Advances in Knowledge.
• Liver proton density fat fraction (PDFF) estimated with a magnitude-based chemical shift magnetic resonance (MR) imaging technique incorporated an area under the receiver operating characteristic curve of 0.989 for distinguish patients with grade 0 (n = 5) from those with steatosis grade 1 or higher (n = 72) (95% confidence interval [CI]: 0.968, 1.000), 0.825 for distinguishing grade 1 or lower (n = 31) from grade 2 or higher (n = 46) (95% CI: 0.734, 0.915), and 0.893 for distinguishing grade 2 or lower (n = 58) from grade 3 (n = 19) (95% CI: 0.809, 0.977).
• MR imaging–PDFF significantly correlated with hepatic steatosis grade, determined by histologic validation, with a correlation coefficient of 0.69 (P < .001).
Implication for Patient Care.
• MR imaging–PDFF shows promise as a noninvasive biomarker for grading hepatic steatosis in patients with nonalcoholic fatty liver disease, but larger studies that use alternative cohorts are needed to confirm MR imaging–PDFF as an alternative to biopsy for grading hepatic steatosis in clinical care and clinical trials.
Disclosures of Conflicts of Interest: A.T. No conflicts of interest to disclose. J.T. No conflicts of interest to disclose. M.S. No conflicts of interest to disclose. G.H. No conflicts of interest to disclose. M.B. Financial activities related to the present article: none to disclose. Financial activities not related to the present article: consultancy for Merck, VirtualScopics; receives royalties from VirtualScopics. Other relationships: none to disclose. T.W. No conflicts of interest to disclose. A.C.G. No conflicts of interest to disclose. M.M. Financial activities related to the present article: none to disclose. Financial activities not related to the present article: consultancy for Bayer, Siemens, Takeda, Synegeva, Isis, General Electric, Gilead; provided expert testimony for medical device identification; stockholder in General Electric. Other relationships: none to disclose. E.M.B. No conflicts of interest to disclose. R.L. No conflicts of interest to disclose. J.E.L. No conflicts of interest to disclose. J.B.S. No conflicts of interest to disclose. C.B.S. Financial activities related to the present article: none to disclose. Financial activities not related to the present article: consultancy for Bayer. Other relationships: none to disclose.
Acknowledgments
We acknowledge the contribution of the Nonalcoholic Steatohepatitis Clinical Research Network for the preparation and review of this manuscript. Funding for this project was supported by the National Institute of Diabetes and Digestive and Kidney Diseases (grant nos. R01 DK075128, U01 DK061734), National Center of Minority Health and Health Disparities (grant no. P60 MD00220), National Center for Research Resources for the General Clinical Research Center at the University of California, San Diego grant (grant no. M01 RR000827), the Fulbright Program (Fulbright Scholarship to A.T.), and the Canadian Institutes of Health Research (Fellowship Award 242199 to A.T.).
Received April 21, 2012; revision requested June 13; revision received September 3; accepted October 8; final version accepted October 15.
Funding: This research was supported by the National Institutes of Health (grants R01 DK075128 and U01 DK061734).
Abbreviations:
- BMI
- body mass index
- CRN
- Clinical Research Network
- NAFLD
- nonalcoholic fatty liver disease
- NASH
- nonalcoholic steatohepatitis
- PDFF
- proton density fat fraction
- TE
- echo time
- TR
- repetition time
References
- 1.Bellentani S, Scaglioni F, Marino M, Bedogni G. Epidemiology of non-alcoholic fatty liver disease. Dig Dis 2010;28(1):155–161 [DOI] [PubMed] [Google Scholar]
- 2.Schwimmer JB, Deutsch R, Kahen T, Lavine JE, Stanley C, Behling C. Prevalence of fatty liver in children and adolescents. Pediatrics 2006;118(4):1388–1393 [DOI] [PubMed] [Google Scholar]
- 3.Angulo P, Lindor KD. Non-alcoholic fatty liver disease. J Gastroenterol Hepatol 2002;17(Suppl):S186–S190 [DOI] [PubMed] [Google Scholar]
- 4.Jou J, Choi SS, Diehl AM. Mechanisms of disease progression in nonalcoholic fatty liver disease. Semin Liver Dis 2008;28(4):370–379 [DOI] [PubMed] [Google Scholar]
- 5.Pais R, Pascale A, Fedchuck L, Charlotte F, Poynard T, Ratziu V. Progression from isolated steatosis to steatohepatitis and fibrosis in nonalcoholic fatty liver disease. Clin Res Hepatol Gastroenterol 2011;35(1):23–28 [DOI] [PubMed] [Google Scholar]
- 6.Bravo AA, Sheth SG, Chopra S. Liver biopsy. N Engl J Med 2001;344(7):495–500 [DOI] [PubMed] [Google Scholar]
- 7.Gaidos JK, Hillner BE, Sanyal AJ. A decision analysis study of the value of a liver biopsy in nonalcoholic steatohepatitis. Liver Int 2008;28(5):650–658 [DOI] [PubMed] [Google Scholar]
- 8.Fernández-Salazar L, Velayos B, Aller R, Lozano F, Garrote JA, González JM. Percutaneous liver biopsy: patients’ point of view. Scand J Gastroenterol 2011;46(6):727–731 [DOI] [PubMed] [Google Scholar]
- 9.El-Badry AM, Breitenstein S, Jochum W, et al. Assessment of hepatic steatosis by expert pathologists: the end of a gold standard. Ann Surg 2009;250(5):691–697 [DOI] [PubMed] [Google Scholar]
- 10.Regev A, Berho M, Jeffers LJ, et al. Sampling error and intraobserver variation in liver biopsy in patients with chronic HCV infection. Am J Gastroenterol 2002;97(10):2614–2618 [DOI] [PubMed] [Google Scholar]
- 11.Bedossa P, Dargère D, Paradis V. Sampling variability of liver fibrosis in chronic hepatitis C. Hepatology 2003;38(6):1449–1457 [DOI] [PubMed] [Google Scholar]
- 12.Ratziu V, Charlotte F, Heurtier A, et al. Sampling variability of liver biopsy in nonalcoholic fatty liver disease. Gastroenterology 2005;128(7):1898–1906 [DOI] [PubMed] [Google Scholar]
- 13.Bydder M, Yokoo T, Hamilton G, et al. Relaxation effects in the quantification of fat using gradient echo imaging. Magn Reson Imaging 2008;26(3):347–359 [DOI] [PMC free article] [PubMed] [Google Scholar]
- 14.Guiu B, Petit JM, Loffroy R, et al. Quantification of liver fat content: comparison of triple-echo chemi cal shift gradient-echo imaging and in vivo proton MR spectroscopy. Radiology 2009;250(1):95–102 [DOI] [PubMed] [Google Scholar]
- 15.Reeder SB, Robson PM, Yu H, et al. Quantification of hepatic steatosis with MRI: the effects of accurate fat spectral modeling. J Magn Reson Imaging 2009;29(6):1332–1339 [DOI] [PMC free article] [PubMed] [Google Scholar]
- 16.Yokoo T, Bydder M, Hamilton G, et al. Nonalcoholic fatty liver disease: diagnostic and fat-grading accuracy of low-flip-angle multiecho gradient-recalled-echo MR imaging at 1.5 T. Radiology 2009;251(1):67–76 [DOI] [PMC free article] [PubMed] [Google Scholar]
- 17.Yokoo T, Shiehmorteza M, Hamilton G, et al. Estimation of hepatic proton-density fat fraction by using MR imaging at 3.0 T. Radiology 2011;258(3):749–759 [DOI] [PMC free article] [PubMed] [Google Scholar]
- 18.Meisamy S, Hines CD, Hamilton G, et al. Quantification of hepatic steatosis with T1-independent, T2-corrected MR imaging with spectral modeling of fat: blinded comparison with MR spectroscopy. Radiology 2011;258(3):767–775 [DOI] [PMC free article] [PubMed] [Google Scholar]
- 19.Reeder SB, Cruite I, Hamilton G, Sirlin CB. Quantitative assessment of liver fat with magnetic resonance imaging and spectroscopy. J Magn Reson Imaging 2011;34(4):729–749 [DOI] [PMC free article] [PubMed] [Google Scholar]
- 20.Liu CY, McKenzie CA, Yu H, Brittain JH, Reeder SB. Fat quantification with IDEAL gradient echo imaging: correction of bias from T(1) and noise. Magn Reson Med 2007;58(2):354–364 [DOI] [PubMed] [Google Scholar]
- 21.O’Regan DP, Callaghan MF, Wylezinska-Arridge M, et al. Liver fat content and T2*: simultaneous measurement by using breath-hold multiecho MR imaging at 3.0 T—feasibility. Radiology 2008;247(2):550–557 [DOI] [PubMed] [Google Scholar]
- 22.Chalasani NP, Sanyal AJ, Kowdley KV, et al. Pioglitazone versus vitamin E versus placebo for the treatment of non-diabetic patients with non-alcoholic steatohepatitis: PIVENS trial design. Contemp Clin Trials 2009;30(1):88–96 [DOI] [PMC free article] [PubMed] [Google Scholar]
- 23.Lavine JE, Schwimmer JB, Molleston JP, et al. Treatment of nonalcoholic fatty liver disease in children: TONIC trial design. Contemp Clin Trials 2010;31(1):62–70 [DOI] [PMC free article] [PubMed] [Google Scholar]
- 24.Kang GH, Cruite I, Shiehmorteza M, et al. Reproducibility of MRI-determined proton density fat fraction across two different MR scanner platforms. J Magn Reson Imaging 2011;34(4):928–934 [DOI] [PMC free article] [PubMed] [Google Scholar]
- 25.Hussain HK, Chenevert TL, Londy FJ, et al. Hepatic fat fraction: MR imaging for quantitative measurement and display—early experience. Radiology 2005;237(3):1048–1055 [DOI] [PubMed] [Google Scholar]
- 26.Yu H, McKenzie CA, Shimakawa A, et al. Multiecho reconstruction for simultaneous water-fat decomposition and T2* estimation. J Magn Reson Imaging 2007;26(4):1153–1161 [DOI] [PubMed] [Google Scholar]
- 27.Hamilton G, Yokoo T, Bydder M, et al. In vivo characterization of the liver fat ¹H MR spectrum. NMR Biomed 2011;24(7):784–790 [DOI] [PMC free article] [PubMed] [Google Scholar]
- 28.Longo R, Pollesello P, Ricci C, et al. Proton MR spectroscopy in quantitative in vivo determination of fat content in human liver steatosis. J Magn Reson Imaging 1995;5(3):281–285 [DOI] [PubMed] [Google Scholar]
- 29.Szczepaniak LS, Nurenberg P, Leonard D, et al. Magnetic resonance spectroscopy to measure hepatic triglyceride content: prevalence of hepatic steatosis in the general population. Am J Physiol Endocrinol Metab 2005;288(2):E462–E468 [DOI] [PubMed] [Google Scholar]
- 30.Hines CD, Frydrychowicz A, Hamilton G, et al. T(1) independent, T(2) (*) corrected chemical shift based fat-water separation with multi-peak fat spectral modeling is an accurate and precise measure of hepatic steatosis. J Magn Reson Imaging 2011;33(4):873–881 [DOI] [PMC free article] [PubMed] [Google Scholar]
- 31.Kleiner DE, Brunt EM, Van Natta M, et al. Design and validation of a histological scoring system for nonalcoholic fatty liver disease. Hepatology 2005;41(6):1313–1321 [DOI] [PubMed] [Google Scholar]
- 32.Brunt EM, Janney CG, Di Bisceglie AM, Neuschwander-Tetri BA, Bacon BR. Nonalcoholic steatohepatitis: a proposal for grading and staging the histological lesions. Am J Gastroenterol 1999;94(9):2467–2474 [DOI] [PubMed] [Google Scholar]
- 33.Tibshirani R. Estimating transformations for regression via additivity and variance stabilization. J Am Stat Assoc 1988;83(402):394–405 [Google Scholar]
- 34.Adams LA, Sanderson S, Lindor KD, Angulo P. The histological course of nonalcoholic fatty liver disease: a longitudinal study of 103 patients with sequential liver biopsies. J Hepatol 2005;42(1):132–138 [DOI] [PubMed] [Google Scholar]
- 35.Hines CD, Yu H, Shimakawa A, et al. Quantification of hepatic steatosis with 3-T MR imaging: validation in ob/ob mice. Radiology 2010;254(1):119–128 [DOI] [PMC free article] [PubMed] [Google Scholar]
- 36.Marsman HA, van Werven JR, Nederveen AJ, et al. Noninvasive quantification of hepatic steatosis in rats using 3.0 T 1H-magnetic resonance spectroscopy. J Magn Reson Imaging 2010;32(1):148–154 [DOI] [PubMed] [Google Scholar]
- 37.Qayyum A, Goh JS, Kakar S, Yeh BM, Merriman RB, Coakley FV. Accuracy of liver fat quantification at MR imaging: comparison of out-of-phase gradient-echo and fat-saturated fast spin-echo techniques—initial experience. Radiology 2005;237(2):507–511 [DOI] [PubMed] [Google Scholar]
- 38.Bydder M, Shiehmorteza M, Yokoo T, et al. Assessment of liver fat quantification in the presence of iron. Magn Reson Imaging 2010;28(6):767–776 [DOI] [PMC free article] [PubMed] [Google Scholar]
- 39.Guiu B, Petit JM, Loffroy R, et al. Liver methylene fraction by dual- and triple-echo gradient-echo imaging at 3.0T: Correlation with proton MR spectroscopy and estimation of robustness after SPIO administration. J Magn Reson Imaging 2011;33(1):119–127 [DOI] [PubMed] [Google Scholar]
- 40.Permutt Z, Le TA, Peterson MR, et al. Correlation between liver histology and novel magnetic resonance imaging in adult patients with non-alcoholic fatty liver disease - MRI accurately quantifies hepatic steatosis in NAFLD. Aliment Pharmacol Ther 2012;36(1):22–29 [DOI] [PMC free article] [PubMed] [Google Scholar]
- 41.Reed TD, Agni RM, Hines C, et al. Quantification of hepatic steatosis with MRI: histological validation [abstr]. In: Proceedings of the Nineteenth Meeting of the International Society for Magnetic Resonance in Medicine. Berkeley, Calif: International Society for Magnetic Resonance in Medicine, 2011 [Google Scholar]
- 42.Roldán-Alzate A, Hines C, Agni RM, et al. Complex and magnitude MRI for quantification of hepatic steatosis–correlation with MR spectroscopy and biopsy [abstr]. In: Proceedings of the Twentieth Meeting of the International Society for Magnetic Resonance in Medicine. Berkeley, Calif: International Society for Magnetic Resonance in Medicine, 2012 [Google Scholar]
- 43.McPherson S, Jonsson JR, Cowin GJ, et al. Magnetic resonance imaging and spectroscopy accurately estimate the severity of steatosis provided the stage of fibrosis is considered. J Hepatol 2009;51(2):389–397 [DOI] [PubMed] [Google Scholar]
- 44.Qayyum A, Nystrom M, Noworolski SM, Chu P, Mohanty A, Merriman R. MRI steatosis grading: development and initial validation of a color mapping system. AJR Am J Roentgenol 2012;198(3):582–588 [DOI] [PubMed] [Google Scholar]
- 45.Lee SS, Park SH, Kim HJ, et al. Non-invasive assessment of hepatic steatosis: prospective comparison of the accuracy of imaging examinations. J Hepatol 2010;52(4):579–585 [DOI] [PubMed] [Google Scholar]
- 46.Hansen KH, Schroeder ME, Hamilton G, Sirlin CB, Bydder M. Robustness of fat quantification using chemical shift imaging. Magn Reson Imaging 2012;30(2):151–157 [DOI] [PMC free article] [PubMed] [Google Scholar]
- 47.Boll DT, Marin D, Redmon GM, Zink SI, Merkle EM. Pilot study assessing differentiation of steatosis hepatis, hepatic iron overload, and combined disease using two-point dixon MRI at 3 T: in vitro and in vivo results of a 2D decomposition technique. AJR Am J Roentgenol 2010;194(4):964–971 [DOI] [PubMed] [Google Scholar]
- 48.Chen J, Talwalkar JA, Yin M, Glaser KJ, Sanderson SO, Ehman RL. Early detection of nonalcoholic steatohepatitis in patients with nonalcoholic fatty liver disease by using MR elastography. Radiology 2011;259(3):749–756 [DOI] [PMC free article] [PubMed] [Google Scholar]
- 49.Salameh N, Larrat B, Abarca-Quinones J, et al. Early detection of steatohepatitis in fatty rat liver by using MR elastography. Radiology 2009;253(1):90–97 [DOI] [PubMed] [Google Scholar]