

We have showed that quantitative susceptibility mapping has superior sensitivity in the assessment of multiple sclerosis-related tissue changes in the basal ganglia than does R2* relaxation rate mapping, with susceptibility changes already observable in patients with clinically isolated syndrome.
Abstract
Purpose:
To apply quantitative susceptibility mapping (QSM) in the basal ganglia of patients with multiple sclerosis (MS) and relate the findings to R2* mapping with regard to the sensitivity for clinical and morphologic measures of disease severity.
Materials and Methods:
The local ethics committee approved this study, and all subjects gave written informed consent. Sixty-eight patients (26 with clinically isolated syndrome, 42 with relapsing-remitting MS) and 23 control subjects underwent 3-T magnetic resonance (MR) imaging. Susceptibility and R2* maps were reconstructed from the same three-dimensional multiecho spoiled gradient-echo sequence. Mean susceptibilities and R2* rates were measured in the basal ganglia and were compared between different phenotypes of the disease (clinically isolated syndrome, MS) and the control subjects by using analysis of variance, and regressing analysis was used to identify independent predictors.
Results:
Compared with control subjects, patients with MS and clinically isolated syndrome had increased (more paramagnetic) magnetic susceptibilities in the basal ganglia. R2* mapping proved less sensitive than QSM regarding group differences. The strongest predictor of magnetic susceptibility was age. Susceptibilities were higher with increasing neurologic deficits (r = 0.34, P < .01) and lower with normalized volumes of gray matter (r = -0.35, P < .005) and the cortex (r = -0.35, P < .005).
Conclusion:
QSM provides superior sensitivity over R2* mapping in the detection of MS-related tissue changes in the basal ganglia. With QSM but not with R2* mapping, changes were already observed in patients with clinically isolated syndrome, which suggests that QSM can serve as a sensitive measure at the earliest stage of the disease.
© RSNA, 2013
Introduction
Hypointensities in the basal ganglia of patients with multiple sclerosis (MS) are a frequent finding on T2-weighted images and have already been observed in the early days of clinical magnetic resonance (MR) imaging (1,2). While these T2 hypointensities can also be observed in healthy aging subjects, they appear more pronounced in patients with MS and are strongly associated with disease duration and severity (3). Histochemical analyses have identified increased iron levels as a source of microscopic field variations, which in turn elicit T2 hypointensity (4).
With the availability of quantitative MR imaging techniques, assessment of iron levels became more accurate and sensitive compared with visual rating of the degree of hypointensity. Several MR imaging methods have been proposed to assess brain iron levels (5,6), but only few so far have been validated postmortem. As such, a recent study validated both R2 and R2* relaxation rates as linear measures for iron concentration in gray matter (GM) structures, with R2* being more sensitive (5).
In fact, R2* mapping in the basal ganglia of patients with clinically definite MS revealed significantly increased iron levels, which were linked to disease duration and loss of cortical GM (6). In contrast, there was no evidence for abnormal R2* rates in the basal ganglia of patients with a clinically isolated syndrome (CIS) suggestive of MS, suggesting increased iron deposition to be a subsequent phenomenon in the evolution of MS (7,8), and consequently R2* relaxometry has been proposed as a potential marker secondary to inflammatory pathophysiologic processes of the disease.
However, depending on its distribution in brain tissue, iron not only causes microscopic field gradients, but also increases the magnetic susceptibility of tissue. Susceptibility-weighted and phase imaging are simple approaches to directly depict susceptibility-related tissue changes (9) but they do not provide quantitative measures for an intrinsic tissue property. However, a recent study found increased susceptibility-weighted filtered phase values in CIS patients when compared with healthy control subjects (10), indicating that the susceptibility is sensitive to MS disease. In this context, more insights are expected from quantitative susceptibility mapping (QSM), which allows overcoming several nonlocal restrictions of susceptibility-weighted and phase imaging and enables quantification of magnetic susceptibility. While the applicability of previous QSM methods in clinical cohorts was clearly hampered by the necessity of tilting the head, recent developments now overcome these limitations, allowing determination of magnetic susceptibility from a single MR imaging (11–18). This progress was achieved by solving the challenging inverse problem with, for example, regularized dipole inversion and by the availability of sufficient computational power for image postprocessing.
In this context, it needs to be emphasized that the sources of the pathophysiologic processes contributing to MR-measurable signal changes are complex. More specifically, the magnetic susceptibility of brain tissue is not only determined by the paramagnetic contribution of iron-loaded ferritin, but also by the counteracting diamagnetic contribution of myelin, as it has only been noted most recently (19–21). We therefore hypothesized QSM to be more sensitive to MS-related tissue changes than R2* mapping, as with this technique, the effect of iron accumulation and demyelination (both important pathophysiologic processes in MS) is additive (both cause a positive increase of magnetic susceptibility), while in R2* mapping, they exert opposing effects (demyelination reduces the R2* rate while iron deposition increases R2*) (22).
The aim of this explorative study was to apply quantitative susceptibility mapping in the basal ganglia of MS patients and relate the findings to R2* mapping regarding the sensitivity for clinical and morphologic measures of disease severity.
Materials and Methods
Subjects
From July 2006 until February 2010, we prospectively enrolled 75 patients from our MS outpatient clinic. Inclusion criteria were a diagnosis of MS or CIS suggestive of MS (23) and the patient’s willingness to undergo a detailed neurologic examination and a comprehensive MR imaging examination. Seven patients were excluded because no gradient-echo phase data were available, which resulted in a total number of 68 included patients (mean age, 34.3 years; range, 19–59 years). R2* data of most of these patients and of control subjects have been reported previously in a study that solely focused on R2* mapping (7). Of the 68 subjects, 26 had a diagnosis of CIS suggestive of MS and 42, of MS. Additionally, we recruited control subjects (n = 23) in the same age range as the patients and without a known neuropsychiatric disorder. Characteristics of the study participants are summarized in Table 1. The local ethics committee approved this study, and all subjects gave written informed consent.
Table 1.
Clinical and Demographic Data of the Study Cohort

Data in parentheses are percentages.
Data are means ± standard deviation.
Mann-Whitney U test.
Data are medians with interquartile range in parentheses.
MR Imaging
All participants underwent MR imaging of the brain with a 3-T imager (TimTrio; Siemens Healthcare, Erlangen, Germany) equipped with a head array coil and 12 receiver channels by using identical protocols. Gradient-echo images for QSM reconstruction and calculation of R2* rates were acquired with identical spoiled three-dimensional fast low-angle shot sequence with 12 equally spaced echoes (repetition time msec/echo time msec, 68/4.92; flip angle, 20°; interecho spacing, 4.92 msec; in-plane resolution, 1 × 1 mm2; section thickness, 4 mm; number of sections acquired, 32; acquisition time, 4 minutes 51 seconds).
The MR imaging protocol also included a fluid-attenuated inversion recovery sequence (repetition time msec/echo time msec/inversion time msec, 9000/69/2500; in-plane resolution, 0.9 × 0.9 mm2; section thickness, 3 mm; acquisition time, 4 minutes 22 seconds) for assessment of MS lesions. A T1-weighted three-dimensional magnetization-prepared rapid acquisition gradient-echo sequence (1900/2.19/900; flip angle, 9°; acquisition time, 6 minutes 1 second) with 1-mm isotropic resolution was used for brain tissue segmentation.
Image Processing and Analysis
Trained and experienced technicians and MR imaging readers blinded to clinical information performed all image analyses (C.L. T.L., M.J., with 5, 6, and 6 years, respectively, of experience in neuroimaging; M.K., with 6 years of experience in clinical neurology; C.E., with 15 years of experience in neuroradiology).
For R2* mapping, all magnitude images of the gradient-echo sequence were registered to the first echo to correct for image shifts induced by the bipolar readout gradient. Subsequently, R2* was calculated pixel-wise by fitting a monoexponential decay function into the multiecho data and by applying a truncation model to consider non-Gaussian noise at later echoes (24).
QSM images were reconstructed according to an algorithm described elsewhere in detail (11,25). In short, QSM images were generated by using a morphology-enabled dipole inversion method, which inverts an estimated local magnetic field to generate a magnetic susceptibility distribution that is structurally consistent with an anatomic prior, which is derived from the magnitude image obtained during the same imaging. The local magnetic field was calculated from a field map derived from MR phase images (26), followed by a projection onto dipole fields method for removal of the background field induced by susceptibility sources outside the brain parenchyma. The process of QSM from raw gradient-echo images (magnitude, wrapped phase), the generation of the morphology mask, and the resulting reconstructed QSM images are shown in Figure 1.
Figure 1:

Overview of the image processing steps for QSM. A morphology mask (B) is calculated from the multiecho magnitude data (A,), which enables inclusion of morphologic information in the reconstruction process. The raw phase image (C) is unwrapped (D) and is then used to estimate the local field distribution by using projection onto dipole field (E). When solving the inverse problem from the local field (E), the morphologic information (B) is included in the morphology-enabled dipole inversion (MEDI), resulting in a quantitative susceptibility map (F).
On the basis of high-resolution magnetization-prepared rapid acquisition gradient-echo imaging, bilateral deep GM structures (caudate nucleus, globus pallidus, putamen, and thalamus) were segmented automatically for all subjects by using FIRST (27), a segmentation and registration algorithm based on deformable models, which is part of FSL software (FMRIB Software Library, available at www.fmrib.ox.ac.uk/fsl/) (28). Resulting three-dimensional models of these structures were eroded by 1 pixel to reduce partial volume effects and then were used to mask all regions of interest on the QSM images and R2* maps. Subsequently, the mean magnetic susceptibility and standard deviations were calculated for each structure bilaterally. Additionally, a global measure for the basal ganglia was calculated by averaging either magnetic susceptibilities or R2* rates of the caudate nucleus, the globus pallidus, and the putamen. Normalized brain volume and regional volumes of white matter and cortical and overall GM were measured by using SIENAX, which is part of FSL software (29).
In patients, T2 lesion load was assessed on fluid-attenuated inversion recovery images by segmenting the lesions semiautomatically with a region-growing algorithm developed in-house. The total lesion load was then calculated by multiplying the area of all lesion masks with the section thickness.
Statistical Methods
All analyses were performed by C.L. and M.K. using GNU R software, version 2.15.0 (R Foundation for Statistical Computing, http://www.r-project.org). A P value of less than .05 was considered to indicate a statistically significant difference. Normal distribution of data was tested with the Kolmogorov-Smirnov test. Differences in brain volumes, R2*, and magnetic susceptibility were tested by using one-way analysis of variance. Fisher least significant difference post hoc test was used to assess differences of R2* mapping and QSM between the cohorts (control subjects, CIS patients, MS patients). This analysis was performed individually for the caudate, globus pallidus, putamen, thalamus, and the global basal ganglia. Paired t tests and Mann-Whitney U tests were used for assessing differences between CIS and MS patients with regard to the Expanded Disability Status Scale (EDSS) score (29), disease duration, and T2 lesion load.
Pearson and Spearman correlation analyses served to investigate the relation of clinical and demographic data (EDSS score, disease duration, and age), T2 lesion load, and brain volumes on basal ganglia magnetic susceptibility and R2* (Pearson: age, global and regional brain volumes; Spearman: EDSS score, disease duration, T2 lesion load). All tests were separately performed for CIS and MS patients, as well as for the entire patient group, whereas the latter analysis considered partial correlations after controlling for the disease phenotype. Because of the exploratory nature of this analysis, no adjustment for multiple testing was made (30). In the next step, we performed stepwise forward multiple linear regression analysis to identify independent predictors of magnetic susceptibility and R2* relaxation rate. Independent variables were excluded when colinearities were found (eg, gray and cortical GM volumes). To reduce the number of possible associations, only the global basal ganglia magnetic susceptibility and global basal ganglia R2* rate were used as dependent variables for the multivariate analyses.
Results
Patient Characteristics and Morphology
Characteristics of the study participants are presented in Table 1. Most notable, mean age and EDSS score did not vary significantly between the CIS and MS subgroup. Control subjects were in the same age range as the patients because brain iron is accumulating in the process of normal aging (31). Morphologic characteristics for patients and control subjects are presented in Table 2. T2 lesion load was higher in MS patients compared with CIS patients. The normalized volumes of GM, cortex, white matter, and the entire brain were lower in MS patients than in control subjects. MS patients also had significantly lower white matter volumes than CIS patients.
Table 2.
Morphologic Data

Note.—Data are means ± standard deviation and have been normalized to the standard brain volume.
Data in parentheses are P values.
Mann–Whitney U Test.
Group Differences as Assessed with QSM and R2* Mapping
Maps of magnetic susceptibility and R2* were successfully obtained from all subjects. Figure 2 provides representative magnetic susceptibility and R2*, where the MS patient demonstrates higher (more paramagnetic) susceptibility in the basal ganglia than does the control subject.
Figure 2:

Representative R2* maps (top row) and quantitative susceptibility maps (bottom row) of two 29-year-old individuals, a healthy control subject and an MS patient. Note increased (more paramagnetic) susceptibility in the basal ganglia in the MS patient. Differences are most evident in the putamen (arrow, 0.049 vs 0.092 ppm). Image window settings were identical: R2* mapping, from 0 (black) to 40 sec−1(white); QSM, from −0.1 (black) to 0.25 ppm (white).
Mean magnetic susceptibility values and R2* rates in the caudate nucleus, globus pallidus, putamen, and the global basal ganglia are summarized in Table 3. A higher susceptibility (more paramagnetic) was found in all basal structures in the patients when compared with control subjects. Magnetic susceptibilities were higher in the caudate nucleus and the putamen of CIS patients compared with control subjects (Fig 3). No differences between CIS and MS patients were found regarding susceptibility.
Table 3.
Regional Magnetic Susceptibility and R2* Values
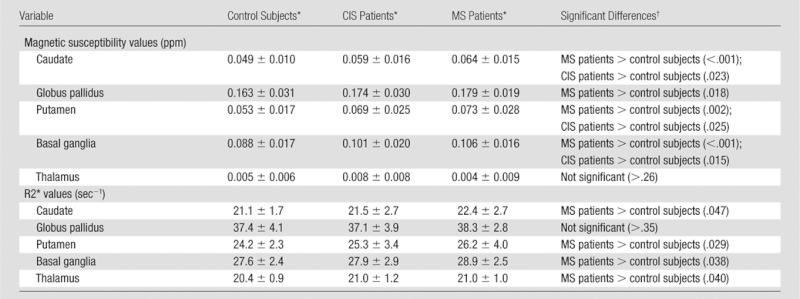
Data are means ± standard deviation.
Data in parentheses are P values.
Figure 3:

Box plots show mean regional R2* relaxation rates and magnetic susceptibilities in components of the basal ganglia (BG) and their average in CIS and MS patients and in control subjects (HC). Horizontal bars = significant differences. * = P < .05, ** = P < .01, *** = P < .001.
Mean R2* relaxation rates were increased in the caudate nucleus, putamen, and the thalamus of MS patients compared with control subjects. With respect to R2* rates, no differences between CIS patients and control subjects nor CIS and MS patients were found.
Univariate Correlations of Basal Ganglia Magnetic Susceptibility with Demographic, Clinical, and Morphologic Parameters
Table 4 shows results of univariate regression analyses in CIS patients, MS patients, and both groups combined. The strongest correlation for global basal ganglia magnetic susceptibility was found for age (r = 0.48, P < .001). EDSS score and basal ganglia susceptibility were also correlated (r = 0.34, P < .01), and this association was driven by the group of MS patients (Table 4). T2 lesion load correlated with basal ganglia susceptibilities only in CIS patients (r = 0.48, P <.05), but not in MS patients.
Table 4.
Univariate Regression Analyses
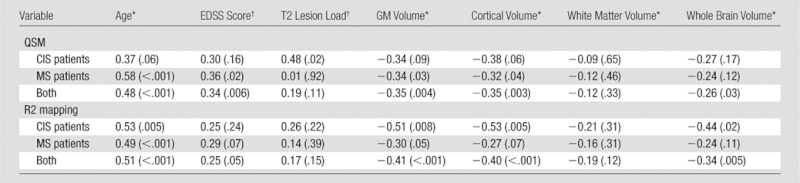
Note.—Data in parentheses are P values.
Pearson correlation coefficients.
Spearman correlation coefficients.
GM and whole brain volumes negatively correlated with basal ganglia susceptibility in the entire patient group. When patient groups were analyzed separately, the significance of these correlations got lost in CIS, while MS patients showed a correlation only between basal ganglia susceptibility and GM volume (r= −0.34, P < .05) and with cortical volume (r= −0.32, P < .05).
Univariate Correlations of R2* Rate of Basal Ganglia with Demographic, Clinical, and Morphologic Parameters
The strongest association for global basal ganglia R2* rate was found for age (r = 0.51, P < .001), and also in parallel to the observations with QSM, regional and global brain volumes negatively correlated with basal ganglia R2* rates. However, basal ganglia R2* did not show any association with EDSS score, disease duration, or T2 lesion load. When all patients were considered, correlations were found for cortical GM and global brain volumes (Table 4).
Determinants of Basal Ganglia Magnetic Susceptibility and R2* Rate
All variables showing significant univariate correlations were considered in stepwise multiple regression models that included CIS and MS patients. When R2* was considered, only age (β = 0.50, P < .001) independently predicted changes in the basal ganglia. The magnetic susceptibility in the basal ganglia was independently predicted by age (β = 0.48, P < .001) and T2 lesion load (β = 0.23, P < .05).
Discussion
In the current study we applied QSM, an emerging technique for determination of the magnetic susceptibility of tissue, to assess tissue changes in CIS and MS patients. Unlike other susceptibility-related MR parameters, including R2* and gradient-echo phase mapping, QSM directly reveals to which extent tissue is magnetized when it is exposed to a magnetic field. It therefore provides a true quantitative parameter with direct reflection of an intrinsic tissue property. As a main finding in our current study, QSM demonstrated higher sensitivity in the assessment of MS-related tissue changes in the basal ganglia than did R2* relaxation rate mapping, allowing the detection of changes already present in CIS patients.
While these findings favor QSM as a more sensitive measure for such disease-related susceptibility changes in MS, their origin is not fully clear. Considering that R2* mapping and QSM were derived from the same data set, a possible explanation is the additive effect of demyelination. The proteins composing myelin have an overall diamagnetic susceptibility (in relation to water) and thus are counteracting the paramagnetic contribution of iron. A reduction of the myelin content therefore has the same effect on susceptibility as does increased iron content (22). Recent histologic work with proteolipid protein staining in tissue of 14 patients confirmed to have MS showed that overall 28.8% of the GM (including deep GM), compared with 15.6% of the white matter, was demyelinated, highlighting that the extent of GM damage in MS may be underestimated (32). Furthermore, it is well known that subcortical nuclei are involved already at the earliest stages of the disease–in part probably via damage to traversing myelinated fiber tracts–and may contribute to subsequent disease evolution (33–35). Given these observations, it seems plausible that demyelination in the basal ganglia contributed to the higher sensitivity of QSM. In contrast, both iron accumulation and demyelination exert a counteracting effect on R2*, which reduces the sensitivity of R2* mapping to capture MS-related tissue changes and which may also explain why R2* mapping did not reveal significant changes in the CIS cohort in this and previous work.
Iron accumulation in CIS patients has been scarcely investigated so far. In a previous study, no differences in the basal ganglia between control subjects and CIS patients were observed by using R2* mapping (7). While at first glance this appears to contradict present findings, it has to be highlighted that also in the current study no differences between control subjects and CIS patients were observed with R2* mapping. Such differences were only found by using the putative more sensitive QSM approach and might be partly ascribed to demyelination (22). Supporting evidence for an involvement of the basal ganglia in CIS patients comes from the observation of T2 hypointensity in the left caudate nucleus that was viewed as an indicator for progression to clinically definite MS (36). CIS patients were also noted to show basal ganglia atrophy (37). Additional evidence comes from a recent study that demonstrated abnormal susceptibility-weighted phase values in the basal ganglia of CIS patients when compared with those of control subjects (10). In this context, we would like to mention that susceptibility-weighted imaging, although related, does not assess the magnetic susceptibility of tissue but merely reflects a convolution of the susceptibility distribution (as it is assess with QSM) with the unit dipole response function and additionally involves a high-pass filtering step. This renders the interpretation of the reported changes on susceptibility-weighted images more complex and complementary to the results of the present QSM work.
Another interesting finding is the observation that basal ganglia susceptibility is correlated with T2 lesion load in CIS but not in MS patients. This might imply that tissue changes in the basal ganglia at earlier stages are more directly coupled to the extent of visible white matter damage than they are in more advanced MS. In this context, it seems plausible that demyelination increases basal ganglia susceptibility in this early stage of MS in a more direct manner than later on, where excessive secondary iron deposition becomes the overwhelming effect and is dominating the magnetic susceptibility independent of lesion load. Although clinically not severely affected, brain atrophy was noted in MS patients and was most pronounced in the cortex and GM. GM volume of CIS patients lay between control subjects and MS patients, further supporting the notion that CIS patients may already show involvement of GM disease (38,39). Interestingly, basal ganglia susceptibility negatively correlated with cortical and GM volumes but not with white matter volumes. This is in line with a similar observation with use of R2* mapping that suggested tissue changes in the basal ganglia to mainly scale parallel to disease progression (7). Whether possible neurodegenerative mechanisms triggered or promoted by the toxic effects of reactive oxygen in the basal ganglia also account for some loss of GM volume remains unclear. There is some evidence that mitochondrial dysfunction or the accumulation of iron-related degradation products from neuronal loss in the basal ganglia may amplify neuronal damage (40). Assessment of magnetic susceptibility also in cortical structures will help clarify whether this mechanism is focally limited to deep GM nuclei or whether this occurs more globally in GM.
When interpreting our results, some limitations must be considered. The patients enrolled in our study do not reflect the entire spectrum of MS as they were selected on the basis of their age rather than their clinical status. Age is a crucial factor for iron deposition and is accumulating in deep GM structures during the process of normal aging. This physiologic process may also have prevented finding an association between susceptibility and disease duration. Additionally, the thalamus did not follow the trends observed in the basal ganglia. This is most likely caused by the known unusual course of iron accumulation in the thalamus. In contrast to all other brain regions, there is no plateauing of iron concentration but a decline after the 3rd to 4th decade of life, which is further confounding the interpretation of susceptibility changes in the thalamus (31).
While this current work focused on deep GM, QSM in white matter could also contribute to our understanding of MS. However, the interpretation of susceptibility changes in white matter is more complex since the diagmagnetic effect of myelin has to be disentangled from the paramagnetism of iron. In addition, the dependency on the orientation of the fiber bundles has to be considered. Further methodological developments will therefore be needed to account for all these effects. Future studies will also have to assess the predictive value of QSM in CIS patients for converting to clinically definite MS and for the subsequent course of the disease.
In conclusion, we have shown that QSM has superior sensitivity in the assessment of MS-related tissue changes in the basal ganglia than does R2* relaxation rate mapping, with susceptibility changes already observable in CIS patients. We interpret this increased susceptibility as the consequence of higher iron content, but demyelination might have an additive role.
Advances in Knowledge.
• By using quantitative susceptibility mapping, basal ganglia susceptibility was higher in patients with clinically isolated syndrome (0.101 ppm) and multiple sclerosis (0.106 ppm) than in control subjects (0.088 ppm).
• Quantitative susceptibility mapping was more sensitive than R2* mapping for assessing subtle tissue change in patients with clinically isolated syndrome.
Implication for Patient Care.
• Quantitative susceptibility mapping allows the investigation of tissue changes even in the very early stages of multiple sclerosis.
Disclosures of Conflicts of Interest: C.L. No relevant conflicts of interest to disclose. T.L. Financial activities related to the present article: institution received a grant from NIH (NIHRO1EB013443). Financial activities not related to the present article: institution received a grant from MedImageMedtric. Other relationships: none to disclose. M.K. Financial activities related to the present article: none to disclose. Financial activities not related to the present article: institution received a grant from Austrian Science Fund (J2992-B09). Other relationships: none to disclose. C.E. No relevant conflicts of interest to disclose. M.J. No relevant conflicts of interest to disclose. S.F. No relevant conflicts of interest to disclose. F.F. No relevant conflicts of interest to disclose. Y.W. Financial activities related to the present article: institution received a research grant from NIH (NIHRO1EB013443). Financial activities not related to the present article: QSM patents have been applied. Other relationships: none to disclose. S.R. No relevant conflicts of interest to disclose.
Received March 26, 2012; revision requested May 8; revision received August 14; accepted September 12; final version accepted September 27.
C.L. supported by the Austria Science Fund (FWF, project number P23576).
Funding: This research was supported by the National Institutes of Health (grant NIHRO1EB013443).
Abbreviations:
- CIS
- clinically isolated syndrome
- EDSS
- Expanded Disability Status Scale
- GM
- gray matter
- MS
- multiple sclerosis
- QSM
- quantitative susceptibility mapping
References
- 1.Drayer B, Burger P, Hurwitz B, Dawson D, Cain J. Reduced signal intensity on MR images of thalamus and putamen in multiple sclerosis: increased iron content? AJR Am J Roentgenol 1987;149(2):357–363 [DOI] [PubMed] [Google Scholar]
- 2.Bakshi R, Benedict RH, Bermel RA, et al. T2 hypointensity in the deep gray matter of patients with multiple sclerosis: a quantitative magnetic resonance imaging study. Arch Neurol 2002;59(1):62–68 [DOI] [PubMed] [Google Scholar]
- 3.Neema M, Stankiewicz J, Arora A, et al. T1- and T2-based MRI measures of diffuse gray matter and white matter damage in patients with multiple sclerosis. J Neuroimaging 2007;17(Suppl 1):16S–21S [DOI] [PubMed] [Google Scholar]
- 4.Drayer B, Burger P, Darwin R, Riederer S, Herfkens R, Johnson GA. MRI of brain iron. AJR Am J Roentgenol 1986;147(1):103–110 [DOI] [PubMed] [Google Scholar]
- 5.Langkammer C, Krebs N, Goessler W, et al. Quantitative MR imaging of brain iron: a postmortem validation study. Radiology 2010;257(2):455–462 [DOI] [PubMed] [Google Scholar]
- 6.Khalil M, Enzinger C, Langkammer C, et al. Quantitative assessment of brain iron by R(2)* relaxometry in patients with clinically isolated syndrome and relapsing-remitting multiple sclerosis. Mult Scler 2009;15(9):1048–1054 [DOI] [PubMed] [Google Scholar]
- 7.Khalil M, Langkammer C, Ropele S, et al. Determinants of brain iron in multiple sclerosis: a quantitative 3T MRI study. Neurology 2011;77(18):1691–1697 [DOI] [PubMed] [Google Scholar]
- 8.Rovira A, Montalban X. MR brain iron mapping in MS: a potential neurodegenerative marker or just another technique? Neurology 2011;77(18):1660–1661 [DOI] [PubMed] [Google Scholar]
- 9.Reichenbach JR, Haacke EM. High-resolution BOLD venographic imaging: a window into brain function. NMR Biomed 2001;14(7-8):453–467 [DOI] [PubMed] [Google Scholar]
- 10.Hagemeier J, Weinstock-Guttman B, Bergsland N, et al. Iron deposition on SWI-filtered phase in the subcortical deep gray matter of patients with clinically isolated syndrome may precede structure-specific atrophy. AJNR Am J Neuroradiol 2012;33(8):1596–1601 [DOI] [PMC free article] [PubMed] [Google Scholar]
- 11.Liu T, Liu J, de Rochefort L, et al. Morphology enabled dipole inversion (MEDI) from a single-angle acquisition: comparison with COSMOS in human brain imaging. Magn Reson Med 2011;66(3):777–783 [DOI] [PubMed] [Google Scholar]
- 12.Wharton S, Bowtell R. Whole-brain susceptibility mapping at high field: a comparison of multiple- and single-orientation methods. Neuroimage 2010;53(2):515–525 [DOI] [PubMed] [Google Scholar]
- 13.Bilgic B, Pfefferbaum A, Rohlfing T, Sullivan EV, Adalsteinsson E. MRI estimates of brain iron concentration in normal aging using quantitative susceptibility mapping. Neuroimage 2012;59(3):2625–2635 [DOI] [PMC free article] [PubMed] [Google Scholar]
- 14.Wu B, Li W, Guidon A, Liu C. Whole brain susceptibility mapping using compressed sensing. Magn Reson Med 2012;67(1):137–147 [DOI] [PMC free article] [PubMed] [Google Scholar]
- 15.Schweser F, Deistung A, Lehr BW, Reichenbach JR. Quantitative imaging of intrinsic magnetic tissue properties using MRI signal phase: an approach to in vivo brain iron metabolism? Neuroimage 2011;54(4):2789–2807 [DOI] [PubMed] [Google Scholar]
- 16.Li W, Wu B, Liu C. Quantitative susceptibility mapping of human brain reflects spatial variation in tissue composition. Neuroimage 2011;55(4):1645–1656 [DOI] [PMC free article] [PubMed] [Google Scholar]
- 17.Liu T, Spincemaille P, de Rochefort L, Kressler B, Wang Y. Calculation of susceptibility through multiple orientation sampling (COSMOS): a method for conditioning the inverse problem from measured magnetic field map to susceptibility source image in MRI. Magn Reson Med 2009;61(1):196–204 [DOI] [PubMed] [Google Scholar]
- 18.Shmueli K, de Zwart JA, van Gelderen P, Li TQ, Dodd SJ, Duyn JH. Magnetic susceptibility mapping of brain tissue in vivo using MRI phase data. Magn Reson Med 2009;62(6):1510–1522 [DOI] [PMC free article] [PubMed] [Google Scholar]
- 19.He X, Yablonskiy DA. Biophysical mechanisms of phase contrast in gradient echo MRI. Proc Natl Acad Sci U S A 2009;106(32):13558–13563 [DOI] [PMC free article] [PubMed] [Google Scholar]
- 20.Liu C, Li W, Johnson GA, Wu B. High-field (9.4 T) MRI of brain dysmyelination by quantitative mapping of magnetic susceptibility. Neuroimage 2011;56(3):930–938 [DOI] [PMC free article] [PubMed] [Google Scholar]
- 21.Langkammer C, Schweser F, Krebs N, et al. Quantitative susceptibility mapping (QSM) as a means to measure brain iron? a post mortem validation study. Neuroimage 2012;62(3):1593–1599 [DOI] [PMC free article] [PubMed] [Google Scholar]
- 22.Langkammer C, Krebs N, Goessler W, et al. Susceptibility induced gray-white matter MRI contrast in the human brain. Neuroimage 2012;59(2):1413–1419 [DOI] [PMC free article] [PubMed] [Google Scholar]
- 23.Polman CH, Reingold SC, Edan G, et al. Diagnostic criteria for multiple sclerosis: 2005 revisions to the “McDonald Criteria”. Ann Neurol 2005;58(6):840–846 [DOI] [PubMed] [Google Scholar]
- 24.He T, Gatehouse PD, Smith GC, Mohiaddin RH, Pennell DJ, Firmin DN. Myocardial T2* measurements in iron-overloaded thalassemia: an in vivo study to investigate optimal methods of quantification. Magn Reson Med 2008;60(5):1082–1089 [DOI] [PMC free article] [PubMed] [Google Scholar]
- 25.Liu J, Liu T, de Rochefort L, et al. Morphology enabled dipole inversion for quantitative susceptibility mapping using structural consistency between the magnitude image and the susceptibility map. Neuroimage 2012;59(3):2560–2568 [DOI] [PMC free article] [PubMed] [Google Scholar]
- 26.Cusack R, Papadakis N. New robust 3-D phase unwrapping algorithms: application to magnetic field mapping and undistorting echoplanar images. Neuroimage 2002;16(3 Pt 1):754–764 [DOI] [PubMed] [Google Scholar]
- 27.Patenaude B, Smith SM, Kennedy DN, Jenkinson M. A Bayesian model of shape and appearance for subcortical brain segmentation. Neuroimage 2011;56(3):907–922 [DOI] [PMC free article] [PubMed] [Google Scholar]
- 28.Smith SM, Jenkinson M, Woolrich MW, et al. Advances in functional and structural MR image analysis and implementation as FSL. Neuroimage 2004;23(Suppl 1):S208–S219 [DOI] [PubMed] [Google Scholar]
- 29.Kurtzke JF. Rating neurologic impairment in multiple sclerosis: an expanded disability status scale (EDSS). Neurology 1983; 33(11):1444–1452 [DOI] [PubMed] [Google Scholar]
- 30.Bender R, Lange S. Adjusting for multiple testing: when and how? J Clin Epidemiol 2001;54(4):343–349 [DOI] [PubMed] [Google Scholar]
- 31.Hallgren B, Sourander P. The effect of age on the non-haemin iron in the human brain. J Neurochem 1958;3(1):41–51 [DOI] [PubMed] [Google Scholar]
- 32.Gilmore CP, Donaldson I, Bö L, Owens T, Lowe J, Evangelou N. Regional variations in the extent and pattern of grey matter demyelination in multiple sclerosis: a comparison between the cerebral cortex, cerebellar cortex, deep grey matter nuclei and the spinal cord. J Neurol Neurosurg Psychiatry 2009;80(2):182–187 [DOI] [PubMed] [Google Scholar]
- 33.Cifelli A, Arridge M, Jezzard P, Esiri MM, Palace J, Matthews PM. Thalamic neurodegeneration in multiple sclerosis. Ann Neurol 2002;52(5):650–653 [DOI] [PubMed] [Google Scholar]
- 34.Miller DH, Thompson AJ, Filippi M. Magnetic resonance studies of abnormalities in the normal appearing white matter and grey matter in multiple sclerosis. J Neurol 2003;250(12):1407–1419 [DOI] [PubMed] [Google Scholar]
- 35.Fernando KT, Tozer DJ, Miszkiel KA, et al. Magnetization transfer histograms in clinically isolated syndromes suggestive of multiple sclerosis. Brain 2005;128(Pt 12):2911–2925 [DOI] [PubMed] [Google Scholar]
- 36.Ceccarelli A, Rocca MA, Neema M, et al. Deep gray matter T2 hypointensity is present in patients with clinically isolated syndromes suggestive of multiple sclerosis. Mult Scler 2010;16(1):39–44 [DOI] [PubMed] [Google Scholar]
- 37.Audoin B, Zaaraoui W, Reuter F, et al. Atrophy mainly affects the limbic system and the deep grey matter at the first stage of multiple sclerosis. J Neurol Neurosurg Psychiatry 2010;81(6):690–695 [DOI] [PubMed] [Google Scholar]
- 38.Calabrese M, Rinaldi F, Mattisi I, et al. The predictive value of gray matter atrophy in clinically isolated syndromes. Neurology 2011;77(3):257–263 [DOI] [PubMed] [Google Scholar]
- 39.Bergsland N, Horakova D, Dwyer MG, et al. Subcortical and cortical gray matter atrophy in a large sample of patients with clinically isolated syndrome and early relapsing-remitting multiple sclerosis. AJNR Am J Neuroradiol 2012;33(8):1573–1578 [DOI] [PMC free article] [PubMed] [Google Scholar]
- 40.Núñez MT, Urrutia P, Mena N, Aguirre P, Tapia V, Salazar J. Iron toxicity in neurodegeneration. Biometals 2012;25(4):761–776 [DOI] [PubMed] [Google Scholar]