Abstract
Echinocandins, such as caspofungin, are commonly used to treat candidemia and aspergilllosis. Success rates for candidemia treatment are approximately 70%. Dose optimization may further help improve these success rates, given that the microbial effect of these agents is concentration dependent. There are conflicting data as regards the effect of weight and/or obesity on caspofungin drug concentrations. We designed a prospective study to evaluate the population pharmacokinetics of caspofungin in adults with a weight difference range of 100 kg. Caspofungin pharmacokinetics were best described using a two-compartment pharmacokinetic model. There were 18 subjects studied, of whom half were women. The central volume was typically 4.2 liters but increased by a factor of (weight/53.6)3/4. The peripheral compartment volume was typically 2.53 liters but increased by a factor of (weight/53.6)3/2, an unusual power law signature. Similarly, the 3/4 power law best described the relationship between weight and systemic clearance for persons weighing >66.3 kg, whereas intercompartmental clearance was best described by the 3/2 power signature. There are two implications of our findings. First, lower caspofungin area-under-the-concentration-time curves are achieved in obese persons than thinner ones. This suggests that dose optimization in heavier patients may improve clinical success rates. Second, the 3/2 exponent is unusual in fractal geometry-based scaling and warrants further study. Moreover, this suggests that use of a “floating” instead of a fixed exponent may be more useful in studies where weight is under investigation as a potential cause of pharmacokinetic variability within adult patients. (This study protocol was registered at www.clinicaltrials.gov under registration number NCT01062165.)
INTRODUCTION
Caspofungin was the first echinocandin to be licensed and has enjoyed wide clinical success for treatment of candidiasis and aspergillosis over the past decades. There is now clear evidence of the superiority of echinocandins over azoles and polyenes for the treatment of candidemia, when both success rates and mortality are considered (1, 2). Nevertheless, the success rates with these agents are still around 70%. Thus, there is room to further improve outcomes; dose manipulation is one method for trying to improve treatment success. In order to achieve this, a greater understanding of population pharmacokinetics of caspofungin in the most frequently encountered types of patients is needed. Here, we examined the population pharmacokinetics of caspofungin, especially with relationship to patient weight.
The human species is becoming more overweight and obese, with estimates that about 2 out of 9 billion people on the planet are obese (3–6). This unfortunate development means that overweight and obese people more and more characterize the usual patient encountered in hospitals all over the world. Candidiasis is one of the top five nosocomial infections and the most common fungal infection in hospitalized patients. Thus, echinocandins, such as caspofungin, are used with increasing frequency in overweight and obese patients. The pharmacokinetics of caspofungin in obese people are poorly characterized, so it is unclear if doses should be changed as weight increases. In our study with the sister echinocandin, micafungin, we found that the drug's clearance increased as weight increased above 66.3 kg (7–9). However, a previous study found no relationship between caspofungin pharmacokinetics and patient weight (10). The reasons for this finding are unclear but likely include a narrow weight range in the patients examined. Here, we examined the pharmacokinetics of caspofungin in patients with weights differing over a 100-kg range and applied higher-order complexity fractal geometry relationships to investigate them (9, 11, 12).
MATERIALS AND METHODS
Regulatory compliance.
This study was approved by the Institutional Review Boards (IRB) of Texas Tech University Health Sciences Center (A09-3566) and University of Texas Southwestern Medical Center (082009-013).
Study population.
Recruitment began in February 2010 at the UT Southwestern Clinical Trials Research Center (CTRC) and ended in December 2010. Any person 18 years of age or older who provided written informed consent was eligible for study participation regardless of gender, race, or ethnicity. Pregnant and nursing women were excluded, as were women who did not use reliable contraception, since the effects of caspofungin on pregnancy are unknown, as well as the major impact of pregnancy on drug pharmacokinetics. A history of allergy to echinocandins, other medical contraindications to echinocandins, and abnormal liver function tests were exclusion criteria. Anyone who had transaminase levels >10 times the upper limit of normal, alkaline phosphatase levels >5 times the upper limit of normal, or a total bilirubin level >5 times upper limit of normal was considered to have abnormal liver function tests.
Experimental design.
Six normal-weight persons (BMI < 25 kg/m2), six overweight and obese persons (BMI 25 to 40 kg/m2), and six persons with a BMI of >40 kg/m2 completed the study. Each BMI category was comprised of 50% men and 50% women.
Study and sampling procedures.
Each person had history taken and received a physical examination prior to caspofungin administration. Intravenous doses of 70 mg of caspofungin were prepared at UT Southwestern Medical Center by the Aston Investigational Drug Service. CTRC personnel obtained and recorded vital signs prior to caspofungin administration as well as 0.5, 1, 2, and 24 h thereafter. The study drug was administered intravenously as a single dose over 60 min. The intravenous line used for caspofungin administration was removed after the infusion was completed. A second intravenous line was utilized for blood draws and was flushed between draws. The blood draws (10 ml) for each person were obtained at seven predetermined time points. The times were 0 h (predose) and 1, 8, 16, 24, 48, and 72 h following the start of the 1 h caspofungin infusion. The blood was centrifuged for plasma separation, and the plasma was stored at −80°C until transported for measurement of caspofungin concentration. At the time of discharge from the CTRC, a blood sample was collected for a complete blood count and a comprehensive metabolic profile.
Subject safety and data monitoring.
The IRB was notified of any serious adverse events within 24 h. Data safety monitoring meetings that included the study coordinators and three investigators (R.G.H., M.A.S., and T.G.) occurred at the time of continuing review (May 2010) and study enrollment closure (January 2011).
Measurement of caspofungin concentration.
Plasma samples were quantitated for caspofungin content using a validated liquid chromatography-tandem mass spectrometry (LC-MS/MS) analytical method that used a Shimadzu (Columbia, MD) liquid chromatograph and an AB Sciex (Foster City, CA) API 3000 tandem mass spectrometer. All method development, validation, and analyses were performed at the Clinical Pharmacology & Experimental Therapeutics Center, School of Pharmacy, Texas Tech University Health Sciences Center, Dallas, TX. Unknown plasma samples (100 μl) were mixed with citric acid, 1-propanol, and azithromycin (internal standard [IS]) and prepared for analyses following protein precipitation using cold acetonitrile and centrifugation at 14,000 × g. The supernatant was dried and reconstituted with 100 μl mobile phase (0.1% formic acid in water–0.1% formic acid in methanol) for injection. The prepared samples were injected (10 μl) into the LC-MS/MS system and separated using a gradient flow (0.3 ml/min) and a Sunrise (Milford, MA) C18 column (3.5 μm, 50 cm by 2.1 mm) over 12 min. Caspofungin and IS were quantitated using positive electrospray ionization (+ESI) combined with multiple reaction monitoring (MRM) for the respective precursor-product ion combinations of 547.5–538.7 m/z for caspofungin and 749.5–591.3 m/z for IS. The standard curve was linear (r2 = 0.9873) and ranged from 40 ng/ml to 8 μg/ml.
Pharmacokinetic analysis.
A total of 125 caspofungin concentrations were comodeled using ADAPT 5 software (13). We utilized the following steps in performing population pharmacokinetic analysis. We did not assume a priori how many compartments the model has, even though one recent study has suggested that caspofungin pharmacokinetics in humans are best described by a two-compartment model (10). One-, two-, and three-compartment models with first-order input and elimination were examined. First, initial guesses of pharmacokinetic parameter values for each model were generated using the standard two-stage approach in ADAPT. The results were then used for further estimation of pharmacokinetic parameters based on the maximum-likelihood solution via the expectation-maximization (MLEM) algorithm in ADAPT. The number of compartments was then chosen by comparing Akaike's information criterion (AIC), Bayesian information criterion (BIC), and −2 negative log likelihood (−2LL) scores for each model. The chosen model was designated the base model. Next, the relationship between pharmacokinetic parameters in the base model and either patient weight, age, gender, creatinine clearance as calculated by the Cockcroft-Gault equation, or comorbid conditions was examined in scatter plots. Categorical variables were compared using the Mann-Whitney U test. For continuous variables, especially patient weight, double-log plots were also examined and the slope determined. For patient weight, we also performed an analysis in which patients with a weight of ≤66.3 kg were excluded, based on our findings for the sister echinocandin, micafungin (8, 9). Double-log plots are commonly used in fractal mathematics and in allometry, to allow ease of identification of power signatures (14, 15). A relationship was said to exist if the slope of the double-log plots deviated significantly from zero. Next, each of the significant variables was then further examined in new MLEM analysis, with the initial estimates of slope from scatter plots added in the COVMOD subroutine of ADAPT. These new models were then compared to the base model using AIC, BIC, and −2LL.
RESULTS
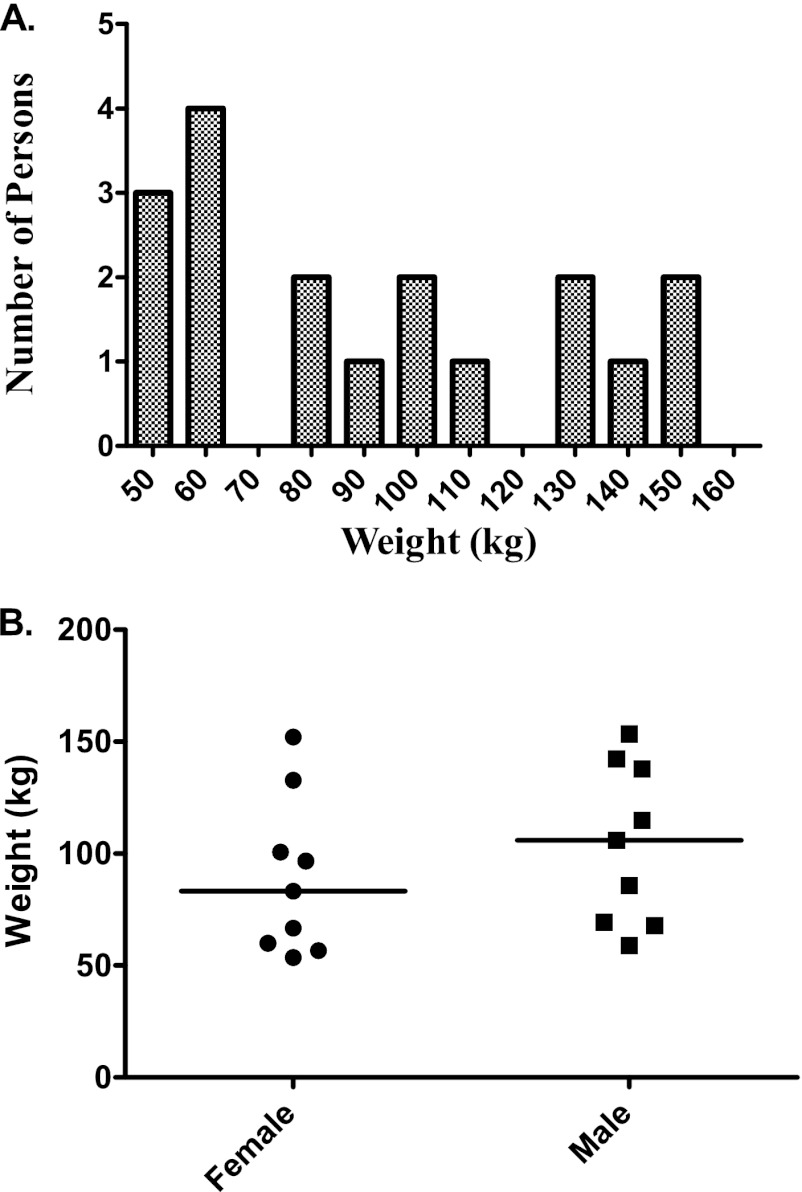
A total of 18 people had blood draws after receiving a single 70-mg dose of caspofungin. Their demographic features are shown in Table 1. The weight distribution is shown in Fig. 1, which also breaks down weight by gender. Two persons developed adverse events, none of which were considered severe. One person developed a mild headache, which resolved about 30 min after the participant was given 650 mg of acetaminophen. The participant had reported a history of headaches and migraines. Another participant developed hot flashes and sweating after being discharged from the CTRC, where she had completed the 24-h procedures without any adverse events. These symptoms resolved on their own after a few hours without an intervention.
Table 1.
Demographic characteristics of study participants
| Demographic parameter | Value |
|---|---|
| Age (yrs) (mean ± SD) | 41.1 ± 13.2 |
| Gender (% men/% women) | 50/50 |
| Self-identified race (%) | |
| White | 61 |
| African American | 33 |
| Asian | 6 |
| % of patients: | |
| With chronic comorbid condition | 50 |
| With metabolic syndrome component(s) | 61 |
| On chronic medication(s) | 44 |
Fig 1.
Weight distribution in people recruited into the caspofungin study. (A) The recruitment was meant to capture all extremes of weight; thus, the weight is not normally distributed. (B) Distribution of weight by gender. Weight did not differ significantly by gender based on a Mann-Whitney U-test comparison.
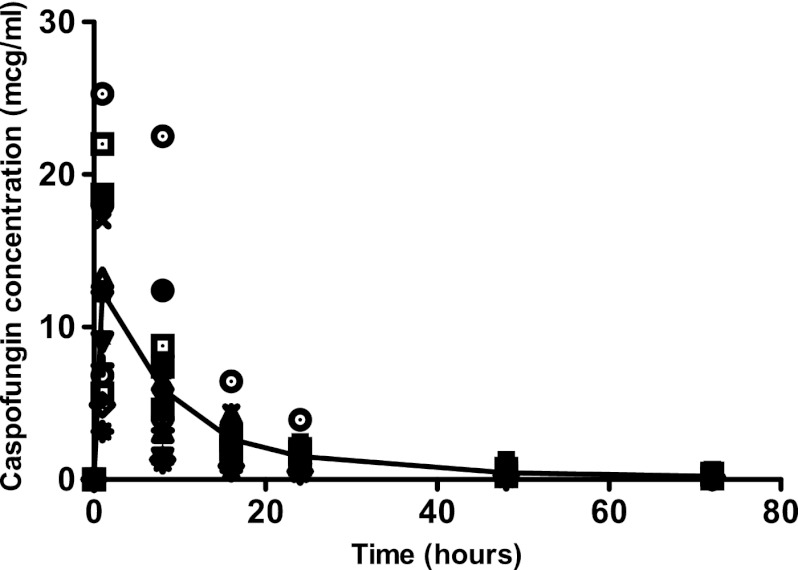
Naïve pooled data of caspofungin concentrations are shown in Fig. 2. The immediate postinfusion peak concentration varied from 3.14 mg/liter to 25.3 mg/liter. The 72-h trough varied from 0 to 2.7 mg/liter. Thus, there is wide variability even after receipt of the same dose. Figure 2 also demonstrates a biphasic decline in the naïve pooled concentrations in the patients. This suggests that the pharmacokinetics are likely described by at least a two-compartment model.
Fig 2.
Concentrations of caspofungin achieved after administration of a single 70-mg dose of caspofungin. The line is the median concentration using naïve pooling and demonstrates a biphasic decline consistent with a two-compartment model.
Examination of different compartmental models using the MLEM algorithm led to the information criterion scores shown in Table 2. In this case, AIC and −2LL would suggest that the two-compartment model is the best model. The evidence ratio calculated using the AIC score is that the two-compartment model is >4 × 10⁸ more likely to be the model than the one-compartment model. However, the BIC score, which penalizes for more complexity of the model, suggests that the one-compartment model is better than the two-compartment model. Nevertheless, based on the preponderance of evidence, a two-compartment model was chosen as the base model. The observed versus predicted concentrations in this model are shown Fig. 3. Pharmacokinetic parameter estimates in this model are shown in Table 3.
Table 2.
Comparison of compartment models for caspofungin pharmacokineticsa
| Compartment | Akaike information criterion | Bayesian information criterion | −2-log likelihoods |
|---|---|---|---|
| 1 | −33.9602 | 11.2928* | −65.9602 |
| 2 | −78.9369* | 25.7107 | −152.937* |
| 3 | 34.3997 | 192.785 | −77.6003 |
*, best compartment model fit according to each criterion.
Fig 3.
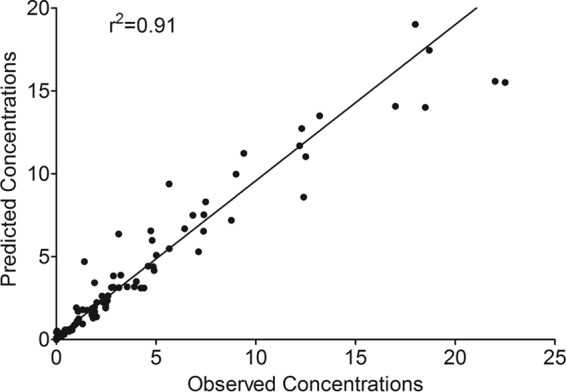
Observed versus model predicted plots for base model.
Table 3.
Caspofungin base model
| Pharmacokinetic parameter | Mean (% RSEa) | 95% Confidence interval |
|---|---|---|
| Total clearance (liters h−1) | 0.508 (11.94) | 0.429–0.693 |
| Volume of central compartment (liters) | 6.28 (15.53) | 5.04–10.01 |
| Intercompartmental clearance (liters h−1) | 0.211 (33.32) | 0.14–0.62 |
| Volume of peripheral compartment (liters) | 4.58 (37.93) | 2.13–20.96 |
RSE, relative standard error.
Next, the relationships between caspofungin pharmacokinetic parameter estimates in the base model and demographic characteristics were examined. There were no obvious relationships between any of the pharmacokinetic parameters and many of the demographic factors. Specifically, BMI demonstrated no obvious relationships to any pharmacokinetic parameter. However, the slopes of patient weight or mass (M) versus either the volume of the central compartment (Vc) or the volume of the peripheral compartment (Vp) were found to differ significantly from zero (Fig. 4). The double-log plot for M versus Vc had a slope of 0.75 or 3/4 (Fig. 4A). This suggests that the relationship between weight and Vc obeyed the 3/4 power law that has been used to scale weight to systemic clearance (SCL) for several anti-infective agents, including micafungin (7, 9, 11, 12, 16). Therefore, we examined if inclusion of M as covariate for Vc in the MLEM algorithm of ADAPT improved the two-compartment model. The AIC score was −91.98, the BIC score 12.67, and −2LL is −165.98; all were an improvement over the base models scores in Table 2. Vc and M were related as follows: Vc = 4.2(M/53.6)3/4 liters, with a total clearance of 0.506 ± 0.221 liters/h, intercompartmental clearance of 0.242 ± 0.231 liters/h, and a Vp of 4.51 ± 5.90 liters.
Fig 4.
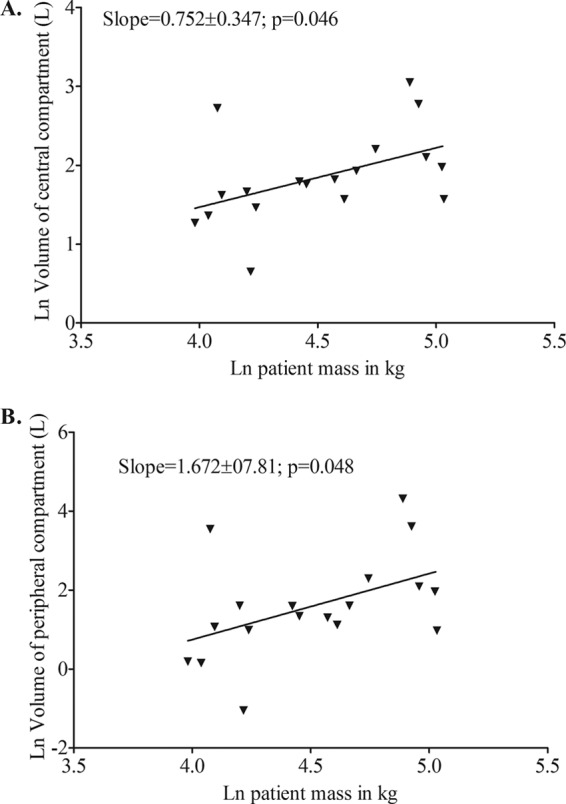
Relationship between natural logarithm (ln) patient mass (kg) and ln volume (liters). (A) Central compartment; (B) peripheral compartment.
On the other hand, while the log-log slope of plot for M versus Vp significantly differed from zero, the slope was 1.67 ± 0.78 (Fig. 4B). We were interested in determining whether this was a reflection of some b/4 power laws that have been used to scale the relationship between M and various physiological functions (17–19). In this case, given the large standard deviation, the values encompassed include 4/4, 5/4, 6/4, 7/4, and 8/4; they just miss encompassing 3/4. We examined M as a covariate of Vp for M raised to either 3/4, 4/4, 5/4, 6/4, or 7/4 in ADAPT and compared these models to the base model using several information criteria. All led to worse scores than the base model, except the 6/4 power model (i.e., a 3/2 exponent), which improved the AIC score to −99.75, BIC to 4.89, and −2LL to −173.75. The relative likelihood that the M3/2 covariate led to an improved model compared to the base model was 33,076. Thus, scaling using the 3/2 power law markedly improved the scores over those of the base model in Table 2. The relationship between Vp and M was as follows: Vp = 2.53(M/53.6)6/4 liters.
Next, based on our results with micafungin in which systemic clearance changed with weight only above 66.3 kg, we examined the relationship between weight and pharmacokinetic parameters only in the 14 patients with higher weights than this. Scatter plots demonstrated that slopes differed significantly from zero for Vp and Vc; however the slopes were identical to those of the entire data set of 18 patients, as discussed above. However, in this subset of patients, weight was now significantly associated with both SCL and intercompartmental clearance (Fig. 5). The slope for the intercompartmental clearance was negative and the inverse of 3/2. However, the standard deviations were large, likely due to the diminished sample size when leaner patients were excluded. We then examined inclusion of M3/4 as a covariate for SCL and compared information criterion scores to those of a base model derived for the 14 patients. This was followed by inclusion of M−3/2 as a covariate for intercompartmental clearance. Scores are shown in Table 4, which demonstrates that the model improved with inclusion of M as a covariate. Moreover, the BIC score, which penalizes for more complexity of the model, also improved (Table 4), which means that the improved model performance was not due merely to an increased number of parameters.
Fig 5.
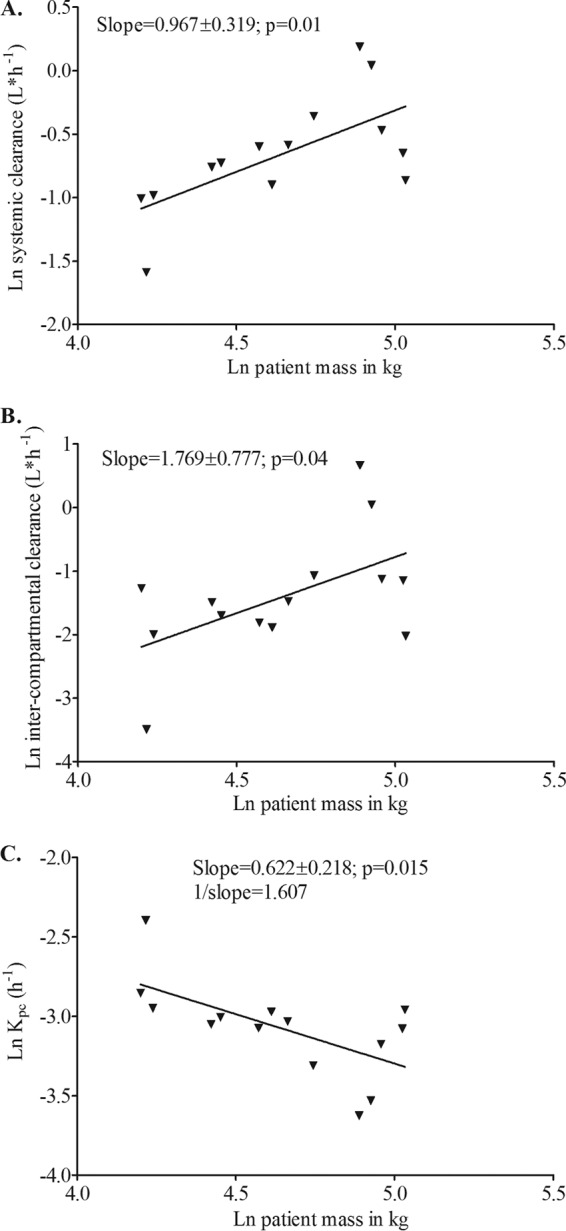
Relationship between natural logarithm (ln) patient mass (kg) and ln systemic clearance (A), ln intercompartmental clearance (B), and ln Kpc (elimination rate constant from the peripheral compartment to the central compartment) (C).
Table 4.
Effect of weight as a covariate using different quarter power laws
| Model | Akaike information criterion | Bayesian information criterion | −2-log likelihood |
|---|---|---|---|
| Base | −42.16 | 53.10 | −116.16 |
| Systemic clearance | −55.81 | 39.45 | −129.81 |
| Intercompartmental clearance | −53.82 | 41.44 | −127.82 |
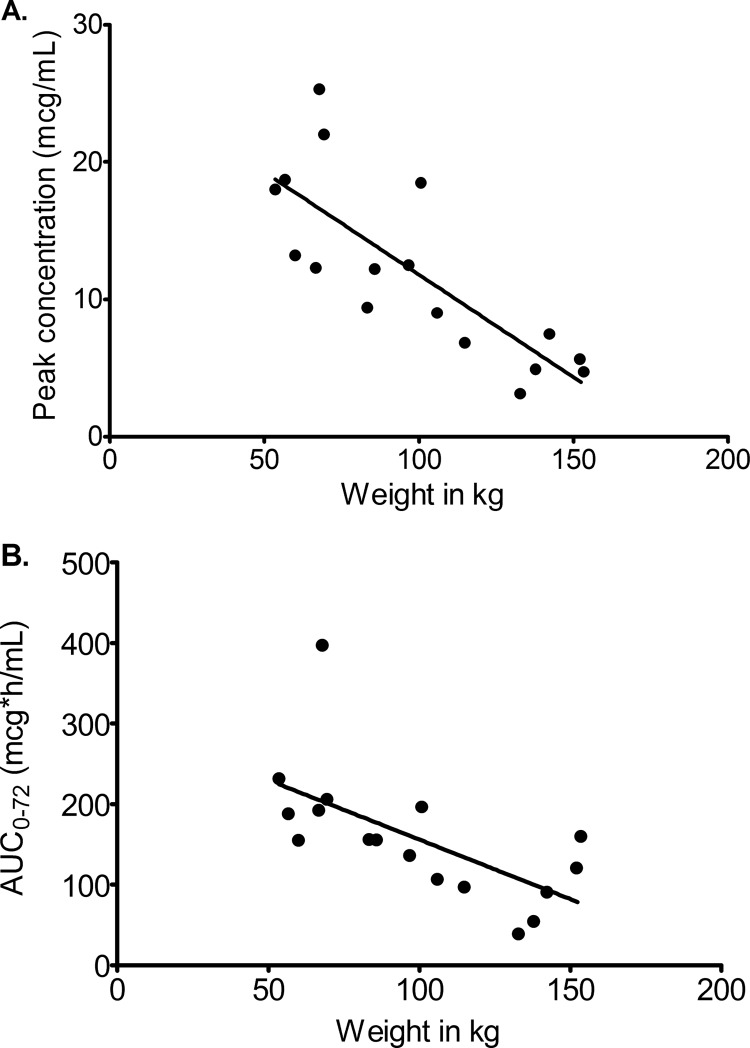
If it is true that there is an increased central volume with increase in M, then one would expect there to be a decrease in observed (or measured) peak concentration, since peak is inversely proportional to the volume of distribution. Figure 6A demonstrates that indeed the relationship between observed caspofungin peak concentration and M was characterized by a slope of −0.15 ± 0.03, which deviated significantly from zero (P < 0.001), with an r2 of 0.63. Similarly, if SCL truly increases at higher M, then the observed areas under the concentration-time curve (AUCs) will decrease as M increases. Figure 6B demonstrates that the observed 72-h AUC, as calculated by the trapezoidal rule, indeed decreases as M increases, with a slope of −1.48 ± 0.47 (r2 = 0.40) which differed significantly from zero (P = 0.007). Thus, the observed (and not model-derived) concentrations confirm that AUC and decreases as M increases, consistent with the population pharmacokinetic modeling results.
Fig 6.
Relationship between observed peak and AUC concentrations and weight.
DISCUSSION
The first major finding of our prospective study was that as weight (M) increases, caspofungin volume of distribution and its clearance increase. This led to a decrease in both peak concentration and AUC. This finding is particularly important for echinocandins, since efficacy is linked to AUC/MIC ratio (16, 20–22). Recently, a caspofungin study in children also found that the immediate postinfusion concentration (peak concentration) was affected by the child's weight; we interpret this as being consistent with increased volume of distribution as weight increases (23). However, the AUC was not affected. On the other hand, a recent study examined the effect of four BMI weight bands and efficacy in patients and found that obese patients with either candidiasis or aspergillosis did not have worse outcomes than underweight or normal-weight patients (24). This is hardly surprising, given that BMI was not a significant covariate of pharmacokinetic parameters in the present study and our other prior studies, while weight itself often is. Thus, it remains to be determined in prospective studies if obese patients fail caspofungin therapy more often than those with normal weight.
The relationship between M and clearance has been modeled on the relationship between basal metabolic rate and M. Starting as far back as 1883, standard Euclidean geometry considerations led to Rubner's law, which was that metabolic rates were proportional to M2/3 (25, 26). For first-in-human dosing, the FDA guidelines still recommend this 2/3 (0.67) exponent, or “power law,” for allometric scaling as a safety factor. In 1932, Kleiber found that a species' whole-body metabolism was proportional to M3/4 (27–29). This 3/4 power law is now extensively utilized for interspecies scaling of drug metabolism. The 3/4 power law itself is one of several “quarter power laws” that relate physiological and anatomic function to Mb/4, where b equals either −1, 1, 2, or 3. One explanation for these quarter power laws has been that of fractal geometry constraints during evolution (17–19). Fractal sets are mathematical functions that do not follow Euclidean geometry and shapes; they often have dimensions that are fractions and are self-similar at different scales (e.g., like Russian dolls) (15, 30, 31). As an example, the branching characteristics of the anatomy of many organs, such as the vascular and bronchial system (which supply metabolites vital to energy use), are self-similar as size decreases, and efficiency dictates minimization of energy use during distribution of resources, which constrains the relationship between body size and metabolic or physiologic function rates to b/4 (17–19). However, fractal mathematics-based non-quarter power laws have also been described, as for example the finding that the brain's metabolic rate is proportional to brain M4/5 (32). Thus, there has been considerable debate as to which power law to use, especially in interspecies scaling for first-in-human dosing. Some advocate that the best exponent to use is 2/3, some recommend 3/4, and yet others advocate a “floating” exponent (33–35). Work by several groups, including ours, has demonstrated that M3/4 can also be applied to scale SCL of several antibiotics as weight changes within the human species, even specifically among adult patients (7, 9, 11, 36). Here, we found for caspofungin that the 3/4 power law still adequately explained the relationship between M and SCL and Vc; however, different power laws were found for intercompartmental clearance and Vp.
The term “allometry” was introduced in 1936 by Huxley and Teissier, who termed the slope of the log-log plot between the sizes of body parts or function as the allometric coefficient (14). An allometric coefficient less than 1 indicates hypoallometry, a coefficient equal to 1 indicates isoallometry, and a coefficient greater than 1 indicates hyperallometry. We found that as M increased, the peripheral compartment volume and intercompartmental clearance also increased, but with a hyperallometric coefficient. While there was some imprecision of 3/2 in log-log slope, model building with a variety of quarter power laws above and below this led to poorer information scores, while the 3/2 exponent had the best scores by information criteria that included those that penalize for complexity. Moreover, given the similarity between micafungin and caspofungin structures and their metabolism, we used the same weight cutoff of 66.3 kg from our two larger micafungin studies (98 patients in all) and re-examined the relationship between weight and pharmacokinetic parameter (8, 9). We found that M3/2 was also a significant covariate for intercompartmental clearance. Intercompartmental clearance describes the clearance of drugs between the peripheral compartment and central compartment. This reflects the flow of drug from blood to peripheral compartment and from peripheral compartment to blood. The 3/2 ratio is likely a composite reflecting the blood flow and blood circulation times which reflect the b/4 power laws as well as the physicochemical properties of the drug, which are also important determinants of drug to-and-fro movement between compartments. Nevertheless, the 3/2 ratio is a curious one, which we have not encountered for other shapes or iterative processes better known in fractal geometry (31). Since the ratio is >1, this means that as weight increases to the higher values of the obesity range, drug concentrations will become lower much faster than one would expect. In terms of the question of which exponent to use when weight is examined as a pharmacokinetic covariate in patients, this result means that it may be more prudent to explore a floating exponent that fits the particular data rather than rely on a fixed known one such as 3/4 or 2/3. The relationship between weight and pharmacokinetic parameters is complex and suggests that the standard power exponents may need supplementation with other parameters in a manner that is specific for each drug under consideration.
In summary, weight is an important covariate of caspofungin volumes of distribution and clearance. This means that adult obese patients will have low caspofungin concentrations despite being on the recommended doses. However, the relationship between weight and pharmacokinetic parameters was complex and suggested that use of more exponents in addition to the standard 3/4 is needed when exploring weight as a covariate.
ACKNOWLEDGMENTS
Grant KL2RR024983 (“North and Central Texas Clinical and Translational Science Initiative”) to UT Southwestern Medical Center from the NCRR/NIH supported R.G.H. Recruitment, admission of volunteers for the study, and collection of blood samples was performed by UT Southwestern Medical Center's Clinical and Translational Research Center personnel within the Center, which is supported by the NIH CTSA grant UL1 RR024982.
Footnotes
Published ahead of print 4 March 2013
REFERENCES
- 1. Andes DR, Safdar N, Baddley JW, Playford G, Reboli AC, Rex JH, Sobel JD, Pappas PG, Kullberg BJ. 2012. Impact of treatment strategy on outcomes in patients with candidemia and other forms of invasive candidiasis: a patient-level quantitative review of randomized trials. Clin. Infect. Dis. 54:1110–1122 [DOI] [PubMed] [Google Scholar]
- 2. Reboli AC, Rotstein C, Pappas PG, Chapman SW, Kett DH, Kumar D, Betts R, Wible M, Goldstein BP, Schranz J, Krause DS, Walsh TJ. 2007. Anidulafungin versus fluconazole for invasive candidiasis. N. Engl. J. Med. 356:2472–2482 [DOI] [PubMed] [Google Scholar]
- 3. Filozof C, Gonzalez C, Sereday M, Mazza C, Braguinsky J. 2001. Obesity prevalence and trends in Latin-American countries. Obes. Rev. 2:99–106 [DOI] [PubMed] [Google Scholar]
- 4. Flegal KM, Carroll MD, Ogden CL, Curtin LR. 2010. Prevalence and trends in obesity among US adults, 1999–2008. JAMA 303:235–241 [DOI] [PubMed] [Google Scholar]
- 5. Kruger HS, Puoane T, Senekal M, van der Merwe MT. 2005. Obesity in South Africa: challenges for government and health professionals. Public Health Nutr. 8:491–500 [DOI] [PubMed] [Google Scholar]
- 6. Swinburn BA, Sacks G, Hall KD, McPherson K, Finegood DT, Moodie ML, Gortmaker SL. 2011. The global obesity pandemic: shaped by global drivers and local environments. Lancet 378:804–814 [DOI] [PubMed] [Google Scholar]
- 7. Hope WW, Seibel NL, Schwartz CL, Arrieta A, Flynn P, Shad A, Albano E, Keirns JJ, Buell DN, Gumbo T, Drusano GL, Walsh TJ. 2007. Population pharmacokinetics of micafungin in pediatric patients and implications for antifungal dosing. Antimicrob. Agents Chemother. 51:3714–3719 [DOI] [PMC free article] [PubMed] [Google Scholar]
- 8. Gumbo T, Hiemenz J, Ma L, Keirns JJ, Buell DN, Drusano GL. 2008. Population pharmacokinetics of micafungin in adult patients. Diagn. Microbiol. Infect. Dis. 60:329–331 [DOI] [PubMed] [Google Scholar]
- 9. Hall RG, Swancutt MA, Gumbo T. 2011. Fractal geometry and the pharmacometrics of micafungin in overweight, obese, and extremely obese people. Antimicrob. Agents Chemother. 55:5107–5112 [DOI] [PMC free article] [PubMed] [Google Scholar]
- 10. Wurthwein G, Young C, Lanvers-Kaminsky C, Hempel G, Trame MN, Schwerdtfeger R, Ostermann H, Heinz WJ, Cornely OA, Kolve H, Boos J, Silling G, Groll AH. 2012. Population pharmacokinetics of liposomal amphotericin B and caspofungin in allogeneic hematopoietic stem cell recipients. Antimicrob. Agents Chemother. 56:536–543 [DOI] [PMC free article] [PubMed] [Google Scholar]
- 11. Jain MK, Pasipanodya JG, Alder L, Lee WM, Gumbo T. 2013. Pegylated interferon fractal pharmacokinetics: individualized dosing for hepatitis C virus infection. Antimicrob. Agents Chemother. 57:1115–1120 [DOI] [PMC free article] [PubMed] [Google Scholar]
- 12. Hall RG, Swancutt MA, Meek C, Leff RD, Gumbo T. 2012. Ethambutol pharmacokinetic variability is linked to body mass in overweight, obese, and extremely obese people. Antimicrob. Agents Chemother. 56:1502–1507 [DOI] [PMC free article] [PubMed] [Google Scholar]
- 13. D'Argenio DZ, Schumitzky A, Wang X. 2009. ADAPT 5 user's guide: pharmacokinetic/pharmacodynamic systems analysis software. Biomedical Simulations Resource, Los Angeles, CA [Google Scholar]
- 14. Huxley JS, Teissier G. 1936. Terminology of relative growth. Nature 137:780–781 [Google Scholar]
- 15. Mandelbrot B. 1967. How long is the coast of Britain? Statistical self-similarity and fractional dimension. Science 156:636–638 [DOI] [PubMed] [Google Scholar]
- 16. Andes D, Ambrose PG, Hammel JP, Van Wart SA, Iyer V, Reynolds DK, Buell DN, Kovanda LL, Bhavnani SM. 2011. Use of pharmacokinetic-pharmacodynamic analyses to optimize therapy with the systemic antifungal micafungin for invasive candidiasis or candidemia. Antimicrob. Agents Chemother. 55:2113–2121 [DOI] [PMC free article] [PubMed] [Google Scholar]
- 17. West GB, Brown JH, Enquist BJ. 1997. A general model for the origin of allometric scaling laws in biology. Science 276:122–126 [DOI] [PubMed] [Google Scholar]
- 18. West GB, Brown JH, Enquist BJ. 1999. The fourth dimension of life: fractal geometry and allometric scaling of organisms. Science 284:1677–1679 [DOI] [PubMed] [Google Scholar]
- 19. West GB, Savage VM, Gillooly J, Enquist BJ, Woodruff WH, Brown JH. 2003. Physiology: why does metabolic rate scale with body size? Nature 421:713. [DOI] [PubMed] [Google Scholar]
- 20. Louie A, Deziel M, Liu W, Drusano MF, Gumbo T, Drusano GL. 2005. Pharmacodynamics of caspofungin in a murine model of systemic candidiasis: importance of persistence of caspofungin in tissues to understanding drug activity. Antimicrob. Agents Chemother. 49:5058–5068 [DOI] [PMC free article] [PubMed] [Google Scholar]
- 21. Gumbo T, Drusano GL, Liu W, Kulawy RW, Fregeau C, Hsu V, Louie A. 2007. Once-weekly micafungin therapy is as effective as daily therapy for disseminated candidiasis in mice with persistent neutropenia. Antimicrob. Agents Chemother. 51:968–974 [DOI] [PMC free article] [PubMed] [Google Scholar]
- 22. Andes D, Diekema DJ, Pfaller MA, Bohrmuller J, Marchillo K, Lepak A. 2010. In vivo comparison of the pharmacodynamic targets for echinocandin drugs against Candida species. Antimicrob. Agents Chemother. 54:2497–2506 [DOI] [PMC free article] [PubMed] [Google Scholar]
- 23. Li CC, Sun P, Dong Y, Bi S, Desai R, Dockendorf MF, Kartsonis NA, Ngai AL, Bradshaw S, Stone JA. 2011. Population pharmacokinetics and pharmacodynamics of caspofungin in pediatric patients. Antimicrob. Agents Chemother. 55:2098–2105 [DOI] [PMC free article] [PubMed] [Google Scholar]
- 24. Ryan DM, Lupinacci RJ, Kartsonis NA. 2011. Efficacy and safety of caspofungin in obese patients. Med. Mycol. 49:748–754 [DOI] [PubMed] [Google Scholar]
- 25. Rubner M. 1883. Ueber den Einfluss der Körpergrösse auf Stoff- und Kraftwechsel. Zeitschr. Biol. 19:535–562 [Google Scholar]
- 26. Hoppeler H, Weibel ER. 2005. Scaling functions to body size: theories and facts. J. Exp. Biol. 208:1573–1574 [DOI] [PubMed] [Google Scholar]
- 27. Kleiber M. 1932. Body size and metabolism. Hilgardia 6:315–353 [Google Scholar]
- 28. Kleiber M. 1947. Body size and metabolic rate. Physiol. Rev. 27:511–541 [DOI] [PubMed] [Google Scholar]
- 29. Brody S. 1945. Bioenergetics and growth: with special reference to the efficiency complex in domestic animals. Reinhold Publishing Corp, New York [Google Scholar]
- 30. Mandelbrot BB, Evertsz CJ, Hayakawa Y. 1990. Exactly self-similar left-sided multifractal measures. Phys. Rev. A 42:4528–4536 [DOI] [PubMed] [Google Scholar]
- 31. Mandelbrot BB. 1982. The fractal geometry of nature. W. H. Freeman and Company, New York, NY [Google Scholar]
- 32. He JH, Zhang J. 2004. Fifth dimension of life and the 4/5 allometric scaling law for human brain. Cell Biol. Int. 28:809–815 [DOI] [PubMed] [Google Scholar]
- 33. Sharma V, McNeill JH. 2009. To scale or not to scale: the principles of dose extrapolation. Br. J. Pharmacol. 157:907–921 [DOI] [PMC free article] [PubMed] [Google Scholar]
- 34. Tang H, Hussain A, Leal M, Fluhler E, Mayersohn M. 2011. Controversy in the allometric application of fixed- versus varying-exponent models: a statistical and mathematical perspective. J. Pharm. Sci. 100:402–410 [DOI] [PubMed] [Google Scholar]
- 35. Mahmood I. 2009. Role of fixed coefficients and exponents in the prediction of human drug clearance: how accurate are the predictions from one or two species? J. Pharm. Sci. 98:2472–2493 [DOI] [PubMed] [Google Scholar]
- 36. Jonsson S, Davidse A, Wilkins J, Van der Walt JS, Simonsson US, Karlsson MO, Smith P, McIlleron H. 2011. Population pharmacokinetics of ethambutol in South African tuberculosis patients. Antimicrob. Agents Chemother. 55:4230–4237 [DOI] [PMC free article] [PubMed] [Google Scholar]


