

Abstract
Objective
Previous voxel-based and regions-of-interest (ROI)-based diffusion tensor imaging (DTI) studies have found above-normal mean diffusivity (MD) and below-normal fractional anisotropy (FA) in subjects with attention-deficit/hyperactivity disorder (ADHD). However, findings remain mixed and few studies have examined the contribution of ADHD familial liability to white matter microstructure.
Method
We used refined DTI tractography methods to examine MD, FA, axial diffusivity (AD) and radial diffusivity (RD) of the anterior thalamic radiation, cingulum, corticospinal tract, inferior fronto-occipital fasciculus, inferior longitudinal fasciculus, forceps major, forceps minor, superior longitudinal fasciculus and uncinate fasciculus in children and adolescents with ADHD (n = 56), unaffected siblings of ADHD probands (n = 31) and healthy controls (n = 17).
Results
Subjects with ADHD showed significantly higher MD than controls in the anterior thalamic radiation, forceps minor, and superior longitudinal fasciculus. Unaffected siblings of subjects with ADHD displayed similar differences in MD as subjects with ADHD. While none of the tested tracts showed a significant effect of FA, the tracts with elevated MD likewise displayed elevated AD in both subjects with ADHD and unaffected siblings. Differences in RD between subjects with ADHD, unaffected siblings and controls were not as widespread as differences in MD and AD.
Conclusion
Our findings suggest that disruptions in white matter microstructure occur in several large white matter pathways in association with ADHD and indicate a familial liability for the disorder. Furthermore, MD may reflect these abnormalities more sensitively than FA.
Keywords: attention-deficit/hyperactivity disorder (ADHD), diffusion tensor imaging, fiber tractography, fractional anisotropy, mean diffusivity
Introduction
Attention-deficit/hyperactivity disorder (ADHD) is characterized by age-inappropriate hyperactivity-impulsivity and/or deficits in attention.1 ADHD affects approximately 5% of children worldwide2 at a high cost to affected individuals and society.3 Prior studies suggest that ADHD is associated with widespread neural structural and functional deficiencies, where frontostriatal networks are particularly implicated.4 Children with ADHD may also exhibit abnormalities in brain connectivity, as suggested by findings of lower ADHD-related functional connectivity,5 lower white matter (WM) volumes,6 and abnormalities in WM microstructure.7,8
WM microstructure can be measured in vivo with diffusion tensor imaging (DTI), which estimates the directional diffusion of water molecules along axonal pathways.9 One DTI measure is fractional anisotropy (FA), which quantifies the directionality of diffusion. Higher FA values reflect increased axonal integrity,10 more myelination,10,11 and increased homogeneity of fiber orientations.10 Another DTI measure is mean diffusivity (MD), which provides a measure of average diffusivity. Larger MD values indicate more diffusion9 and may reflect myelin breakdown,12 decreased cellular density10,12 or increased extracellular volumes.10,12 More specificity regarding the neurobiological determinates of altered white matter structure may be gained from examining axial diffusivity (AD) and radial diffusivity (RD). AD is the diffusion parallel to the axonal fibers, whereas RD is the average diffusion perpendicular to axonal fibers.13 Decreases in AD may reflect axonal damage14 and/or axonal pruning,15 while increases in AD may indicate neurofibril damage.16 Increases in RD are believed to reflect myelin injury and/or decreased myelination.13,14
Previous studies examining white matter microstructure in ADHD have reported spatially diffuse differences in FA. However, the regions examined and the direction and significance of results have varied across studies even for overlapping pathways (for review, see van Ewijk et al.8). Both ADHD-related decreases17–23 and increases24–26 in FA have been observed in projection pathways including the cerebellar and cerebral peduncles, cortical spinal tract (CST), internal capsule and corona radiata. Likewise, while some studies report lower FA within association fibers such as the cingulum, fornix, inferior fronto-occipital fasciculus (IFO), inferior longitudinal fasciculus (ILF), superior longitudinal fasciculus (SLF), posterior thalamic radiation, and uncinate fasciculus (UF),17,18,20,27,28 others have shown regional increases of FA in these fiber pathways in ADHD relative to controls.19,26,27,29,30 These discrepancies may reflect differences and/or limitations of analysis approaches. That is, while some studies have focused only on specific regions providing limited information, others have used whole brain voxel-based approaches that may be more sensitive to registration errors potentially heightened by morphometric differences between groups.6,31 Moreover, most studies have investigated relatively small samples of varying demographic and clinical characteristics, making it difficult to reconcile findings. Most prior studies have also not benefited from the use of higher angular resolution data that may allow for more precise estimates of FA and other diffusion metrics.32 Notwithstanding, a recent meta-analysis of 9 voxel-based studies showed more prominent ADHD effects in the cerebellum, forceps minor, internal capsule, and SLF, though directionality was not reported.8 While fewer studies have examined differences in MD between controls and subjects with ADHD, the majority of studies report higher MD in ADHD, with MD differences particularly noted in the internal capsule, SLF and UF.20,21,27,30 Only three studies to date have examined differences in AD and RD, with approximately equal numbers finding higher or lower AD in ADHD, and higher or lower RD in ADHD.20,26,30
To clarify prior findings we thus took advantage of higher resolution DTI data and a more refined streamline tractography approach to examine FA and MD differences in nine major WM tracts (the anterior thalamic radiation (ATR), cingulate gyrus portion of the cingulum (henceforth referred to as the cingulum), CST, IFO, ILF, forceps major, forceps minor, SLF and UF) in 64-direction DTI data in n = 56 children and adolescents with ADHD and n = 17 controls. Additionally, as ADHD and white matter microstructure have both been shown to have a hereditary component,33,34 and unaffected siblings of children with ADHD have shown similarities in brain structure35 and brain activity36–38 with respect to their siblings with ADHD, we included a group of n = 31 related siblings without ADHD. We hypothesized that subjects with ADHD and their unaffected siblings would display MD and FA differences relative to controls in a number of tracts including the CST, forceps minor, and SLF. Post-hoc analyses addressed differences in AD and RD in pathways showing FA or MD effects, and associations with clinical symptomology and/or executive functioning.
Method
Participants
Subjects with ADHD, unaffected siblings, and control subjects (all between the ages of 6 and 18 years old) were recruited from the community or referred to the study by their physicians or through other ongoing studies of ADHD at the University of California, Los Angeles (UCLA). All children were evaluated for ADHD and other psychiatric diagnoses based on an interview with the primary caretaker, usually the mother, using a semi-structured diagnostic interview, the Kiddie-Schedule for Affective Disorders and Schizophrenia–Present and Lifetime version (K-SADS-PL)39 and a direct interview with the child if 8 years of age or older. Parent ratings on the Swanson, Nolan, and Pelham, Version IV (SNAP-IV) Rating Scale40 were used to supplement the diagnostic interviews. All interviews were conducted by clinical psychologists or highly trained, master’s level interviewers with extensive experience in psychiatric diagnoses. To assess cognitive functioning, subjects completed the Block Design and Vocabulary subtests of the Wechsler Intelligence Scale for Children, third edition (WISC-III)41 or the Wechsler Adult Intelligence Scale, third edition (WAIS-III)42 and parents completed the Behavior Rating Inventory of Executive Function (BRIEF).43
Probands and their siblings were included in the study if they met full diagnostic criteria for ADHD. Siblings of ADHD probands were included as unaffected siblings if they did not meet diagnostic criteria for ADHD. The study included 14 sibling pairs concordant for ADHD and 22 sibling pairs discordant for ADHD, in addition to singletons. Controls did not meet diagnostic criteria for ADHD or any other current psychiatric disorder. Subjects were excluded from participation if they were positive for any of the following: neurological disorder, head injury resulting in concussion or loss of consciousness, premature birth (≤ 34 weeks gestation), lifetime diagnoses of schizophrenia or autism, estimated Full Scale IQ of less than 70, or any contraindications to magnetic resonance imaging (MRI) scanning.
Summary demographic and clinical information for each group can be found in Table 1. Additionally, a total of n = 27 subjects with ADHD were currently receiving medication (dexmethylphenidate [n = 3], dextroamphetamine [n = 1], dextroamphetamine and amphetamine [n = 3], methylphenidate [n = 16], dexmethylphenidate and escitalopram [n = 1], dexmethylphenidate and guanfacine [n = 1], dexmethylphenidate, guanfacine and escitalopram [n = 1], methylphenidate and sertraline [n = 1]). None of the controls or unaffected siblings were currently taking medication.
Table 1.
Demographic Characteristics of Each Group
| Demographic | Control (n = 17) | Unaffected Sibling (n = 31) | ADHD (n = 56) | Statistic | p |
|---|---|---|---|---|---|
| Age (years) | 13.2 ± 2.0 | 11.3 ±3.5 | 12.6 ± 3.2 | F = 2.53 | .09 |
| Gender (m / f) | 6 / 11 | 7 / 24 | 39 / 17 | χ2 = 19.44 | < .001 *** |
| Full-Scale IQ | 110.4 ± 13.3 | 107.9 ± 13.1 | 105.3 ± 13.1 | F = 1.12 | .33 |
| BRIEF Global Executive Component | 40.3 ± 5.7 | 46.0 ± 9.9 | 67.5 ± 11.6 | F = 47.27 | < .001 *** |
| ODD (% diagnosed) | 0% | 12.9% | 48.2% | χ2 = 20.52 | < .001 *** |
| SNAP-IV Inattention | 0.20 ± 0.23 | 0.50 ± 0.53 | 2.17 ± 0.62 | F = 190.26 | < .001 *** |
| SNAP-IV Hyperactive-Impulsive | 0.11 ± 0.17 | 0.41 ± 0.45 | 1.71 ± 0.73 | F = 109.26 | < .001 *** |
| Number of Inattentive Symptoms | 0.06 ± 0.24 | 0.74 ± 1.29 | 7.95 ± 1.14 | ||
| Number of Hyperactive Symptoms | 0.06 ± 0.24 | 0.29 ± 0.82 | 4.91 ± 2.80 |
Note: All values are reported as Mean ± SD unless noted otherwise. In all cases where there was a significant effect of group, post-hoc testing revealed significant pairwise differences between controls and subjects with attention-deficit/hyperactivity disorder (ADHD), and unaffected siblings and subjects with ADHD (p < .05). No other differences reached significance. Scores on the Swanson, Nolan, and Pelham, Version IV (SNAP-IV) Rating Scale40 are based on parental report; items reflect ADHD diagnostic criteria and are rated according to how often the youth exhibits that behavior on a scale of 0 (‘not at all’) to 3 (‘all the time’). Higher SNAP scores indicate higher inattention or hyperactivity-impulsivity, depending on the subscale. The Behavior Rating Inventory of Executive Function (BRIEF) Global Executive Component43 scores are similarly based on parental report, and items reflect the use of executive function skills in the real-world environment; higher scores indicate worse executive function. SNAP-IV Inattention and Hyperactive-Impulsive Scores are missing for 3 unaffected siblings and 2 subjects with ADHD. BRIEF Global Executive Component scores are missing for 2 unaffected siblings and 4 subjects with ADHD. ODD = Oppositional Defiant Disorder.
p < .001
A total of n = 5 of the unaffected siblings had one or more psychiatric disorders besides oppositional defiant disorder (ODD). These disorders included anxiety disorders (n = 4), and anxiety disorder comorbid with major depressive disorder (n = 1). Of the subjects with ADHD, a total of n = 13 had one or more comorbid psychiatric disorders besides ODD. Comorbidities included: anxiety disorders (n = 3); major depressive disorder (n = 1); conduct disorder, (n = 1); a tic disorder (n = 1); a learning disorder (n = 1); substance abuse (n = 1); anxiety disorder comorbid with major depressive disorder (n = 2); anxiety disorder comorbid with tic disorder (n = 1); anxiety disorder comorbid with a learning disorder and a tic disorder (n = 1); and a tic disorder comorbid with trichotillomania (n = 1). A total of n = 4 unaffected siblings had ODD, and a total of n = 27 subjects with ADHD also had ODD. As none of the above subjects were outliers relative to their diagnosis group, they were retained for analysis.
All participants provided written informed consent/assent approved by the UCLA Institutional Review Board.
Image Acquisition and Processing
All medicated subjects abstained from taking stimulant medication for 24 hours prior to scanning. Data were acquired on a 3T Trio Siemens Scanner (Siemens, Erlangen, Germany) located at the UCLA Ahmanson-Lovelace Brain Mapping Center using a 12-channel head coil. DTI data was acquired using single-shot spin-echo/echo-planar imaging sequences with 64 non-collinear diffusion encoding directions and a 2 mm isotropic voxel size in 50 axial-oblique slices spanning the entire brain oriented parallel to the anterior/posterior commissure (AC–PC) line (repetition time [TR] = 7000 ms, echo time [TE] = 93 ms, b = 0, 1000 s/mm2, field of view [FOV]: 190 × 190 mm, matrix: 96 × 96, averages: 2, scan time: 7.75 min).
DTI data processing was performed using the LONI Pipeline environment.44 After image reconstruction, the diffusion gradient table was corrected for slice prescription. Eddy current induced distortions were corrected by using a nonlinear 2D registration45 and motion artifacts were corrected using a 3D rigid body registration,46,47 combining the two registrations to minimize interpolation. FSL’s Brain Extraction Tool (BET)48 was used to skull strip the non-diffusion-weighted images and to subsequently mask all diffusion-weighted images. The diffusion tensor was estimated at each voxel using a linear least squares algorithm applied to the log-transformed signal intensities, and each diffusion tensor was diagonalized to obtain the eigenvalues for computing MD and FA.49 Three-dimensional tract reconstruction was performed using a deterministic streamline approach in DTIStudio50 and the Fiber Assignment by Continuous Tracking (FACT) algorithm. In our study, an FA threshold of 0.2 and a turning angle threshold of 70° were used to obtain biologically plausible results. The regions of interest (ROIs) for tract isolation were applied to the FA-weighted color maps for each subject by following the previously validated tract tracing protocols detailed in Wakana et al.51 Reliability for tract tracing was determined by computing intraclass correlation coefficients of tract volume and mean FA for 8 randomly chosen brain volumes assessed twice. All intraclass correlations were greater than 0.91, where the mean correlation coefficient across tracts was 0.98, SD = 0.02. Inter-rater reliability has been established previously in our group.52 All pre-processing and ROI placements were done blind to diagnosis. Example tracts can be seen in Figure 1.
Figure 1.

Average mean diffusivity (MD) residualized for age and gender in tracts showing a significant difference between subjects with attention-deficit/hyperactivity disorder (ADHD) and controls. Note: The brackets and asterisks (*) indicate comparisons showing significant differences between controls and subjects with ADHD and between controls and unaffected siblings. No significant differences between subjects with ADHD and their unaffected siblings were observed. Error bars indicate 1 standard error of the mean. ATR = anterior thalamic radiation; SLF = superior longitudinal fasciculus; FMinor = forceps minor.
Mean FA, MD, AD, and RD were estimated for each fiber tract within subjects using binary masks generated from each white matter bundle and FSLMaths.53
Statistical Analysis
In order to reduce the number of hypotheses tested, a repeated measures linear mixed model examined group differences in mean FA and mean MD including hemisphere as a within subjects factor for bilateral tracts. Hemisphere, ADHD diagnosis, age, gender, and the interaction between hemisphere and ADHD diagnosis were used as fixed factors. To control for white matter similarities between relatives regardless of ADHD diagnosis, familial relatedness was used as a random factor. AD and RD were analyzed using similar repeated measures linear mixed models. Post-hoc analyses of medication effects were additionally examined in subjects with ADHD.
For tracts that showed a significant effect of diagnosis, the significant DTI metric for all subjects was residualized for gender and age and correlated with SNAP-IV Rating Scale scores for Inattention or BRIEF Global Executive Composite scores as based on the tract’s theorized function.
Between-group demographic differences were assessed with chi-square or one-way analysis of variance (Welch test if the assumption of homogeneity of variances was violated), as appropriate. If there was a significant effect of group, further pairwise group differences were assessed using Tukey’s HSD or additional chi-square tests as appropriate.
We took several steps to control for the effect of multiple comparisons on Type I error. A Benjamini and Hochberg False Discovery Rate (FDR)54 of < 5% was used to control for the effect of multiple comparisons, where uncorrected p-values ≤ 0.006, two-tailed, for diagnostic group comparisons of FA and MD for the nine different WM tracts was estimated as the new threshold of significance. To further reduce the number of comparisons conducted, we only analyzed the data from unaffected siblings for those tracts showing significant diagnostic group differences (ADHD vs. controls). We additionally only analyzed AD and RD for those tracts showing significant diagnostic group effects for either FA or MD. Due to the strong theoretical basis for the post-hoc comparisons with unaffected siblings, and for the post-hoc comparisons with AD and RD, we used a more liberal raw significance threshold of p = .05, two-tailed, for these comparisons. All p-values reported are uncorrected p-values.
Results
The control, unaffected sibling, and ADHD groups did not differ in terms of age or full-scale IQ, but they did significantly differ with regards to gender (Table 1). Gender was thus included as a factor in the linear mixed model. Although the groups did not significantly differ with regards to age, age was included as a factor to further reduce any age-related variance.
For analyses of FA, significant main effects of hemisphere were observed for the cingulum and CST (both leftward) and the IFO and UF (both rightward; see Table S1 and S2, available online). No significant interaction between hemisphere and diagnosis was observed for any tract, all p > .10. A significant main effect of age was found for the CST, where FA increased with age (Table S3, available online). Contrary to our hypotheses, subjects with ADHD did not show significant differences of FA when compared to controls for any tract, all p > .10 (Table S2, available online).
For analyses of MD, significant main effects of hemisphere were observed for the cingulum, CST, ILF, and SLF (all leftward; Table S1 and S2, available online). No significant interaction between hemisphere and diagnosis was observed in any tract, all p > .10. A significant main effect of age was found for ATR, cingulum, CST, forceps major, IFO, ILF, SLF, and UF, where MD decreased with age for all tracts (Table S3, available online). MD was significantly higher in subjects with ADHD than controls in the ATR, forceps minor, and SLF. Like the subjects with ADHD, unaffected siblings showed significantly higher MD values than controls in the ATR, forceps minor, and SLF (Figure 1; Table 2; Table S2, available online). Unaffected siblings did not differ significantly from the subjects with ADHD for any tract.
Table 2.
Significance Values for Mean Diffusivity (MD) for Diagnostic Group Comparisons
| Control / ADHD
|
Control / Unaffected Sibling
|
ADHD / Unaffected Sibling
|
||||
|---|---|---|---|---|---|---|
| Tract | F | p | F | p | F | p |
| ATR | 13.85 | < .001 *** | 16.67 | < .001 *** | 1.42 | .24 |
| FMinor | 8.87 | .004 ** | 4.56 | .04 * † | 0.35 | .55 |
| SLF | 7.75 | .006 ** | 4.13 | .04 * | 1.95 | .17 |
Note: ADHD = attention-deficit/hyperactivity disorder; ATR = anterior thalamic radiation; FMinor = forceps minor; SLF = superior longitudinal fasciculus.
p < .05,
p < .01,
p < .001,
p = .07
after exclusion of 5 unaffected siblings with comorbidities.
To further elucidate the biological processes associated with the ADHD findings reported above, AD and RD were examined in those tracts showing significant diagnostic group effects for MD. Pairwise comparisons revealed a similar pattern of group differences in AD as for MD, with subjects with ADHD and unaffected siblings showing elevated AD compared to controls in the ATR, forceps minor, and SLF (Figure 2; Table 3; Table S4, available online). There were no significant differences between subjects with ADHD and unaffected siblings, consistent with our MD findings.
Figure 2.
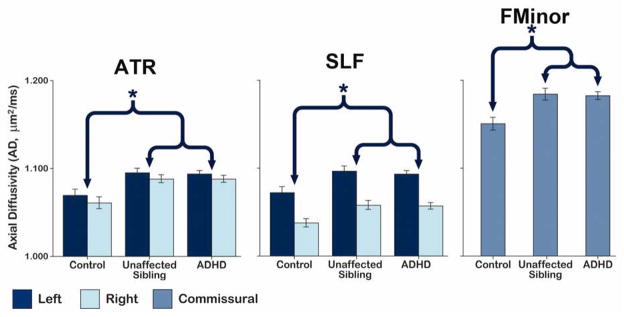
Average axial diffusivity (AD) residualized for age and gender in tracts showing a significant mean diffusivity (MD) difference between subjects with attention-deficit/hyperactivity (ADHD) and controls. Note: The brackets and asterisks (*) indicate comparisons showing significant differences between controls and subjects with ADHD and between controls and unaffected siblings. No significant differences between subjects with ADHD and their siblings were observed. Error bars show 1 standard error of the mean. ATR = anterior thalamic radiation; SLF = superior longitudinal fasciculus; FMinor = forceps minor.
Table 3.
Significance Values for Axial Diffusivity (AD) and Radial Diffusivity (RD) for Diagnostic Group Comparisons
| Axial Diffusivity
|
||||||
|---|---|---|---|---|---|---|
| Control / ADHD
|
Control / Unaffected Sibling
|
ADHD / Unaffected Sibling
|
||||
| Tract | F | p | F | p | F | p |
| ATR | 13.31 | < .001 *** | 10.21 | .003 ** | 0.21 | .65 |
| FMinor | 12.25 | < .001 *** | 6.63 | .01 ** | 0.30 | .59 |
| SLF | 9.85 | .002 ** | 4.49 | .03 * | 0.88 | .35 |
|
| ||||||
| Radial Diffusivity
|
||||||
| Control / ADHD
|
Control / Unaffected Sibling
|
ADHD / Unaffected Sibling
|
||||
| Tract | F | p | F | p | F | p |
|
| ||||||
| ATR | 8.00 | .005 ** | 10.63 | .002 ** | 2.34 | .13 |
| FMinor | 4.79 | .03 * | 1.89 | .18 | 0.18 | .68 |
| SLF | 3.27 | .07 | 3.34 | .07 | 2.16 | .15 |
Note: ADHD = attention-deficit/hyperactivity disorder; ATR = anterior thalamic radiation; FMinor = forceps minor; SLF = superior longitudinal fasciculus.
p < .05,
p < .01,
p < .001
Of those tracts that showed significant group differences in MD, subjects with ADHD exhibited significantly elevated RD relative to controls in the ATR and forceps minor only. Unaffected siblings showed significantly higher RD than controls in the ATR (Table 3; Table S4, available online). Again, there were no significant RD differences between subjects with ADHD and unaffected siblings.
To ensure that the inclusion of the five unaffected siblings with non-ODD comorbidities did not impact the observed findings, all analyses were rerun after excluding these subjects. All results remained similar with the exception of MD for the forceps minor, which no longer differed significantly between unaffected siblings and controls (p < .07).
Due to the large number of subjects with ADHD in our sample who were currently receiving medication (n = 27), we additionally examined whether those subjects receiving medication differed from those not receiving medication (n = 29) for DTI tract indices that showed significant diagnostic group difference. Medicated subjects with ADHD displayed significantly higher MD and AD in the forceps minor than non-medicated subjects with ADHD, p = .02 and p = .006, respectively. No other differences reached significance (p > .05). Medicated and non-medicated subjects additionally did not significantly differ in inattention or hyperactivity/impulsivity as measured by the SNAP-IV (p > .10).
To explore the clinical and functional implications of group differences in MD, AD, and RD, these values were residualized for gender and age and used to examine correlations with SNAP-IV Rating Scale scores for Inattention and BRIEF Global Executive Composite scores. More specifically, we correlated MD, AD, and RD from the forceps minor and SLF with subjects’ scores on the SNAP-IV Rating Scale for Inattention across diagnosis because those tracts may relate to attention.55,56 We found that MD, AD, and RD of the forceps minor correlated with SNAP-IV inattention scores, such that subjects with higher MD, AD, or RD values were more inattentive, r = 0.28, p = .006; r = 0.30, p = .002; and r = .22, p = .03, respectively. No other correlation reached significance, p > .10.
We additionally correlated the MD, AD, and RD of the ATR and forceps minor with the BRIEF Global Executive Composite scores because those tracts may relate to executive function.57 We found that MD and AD of the forceps minor significantly correlated with participant’s t-scores from the BRIEF Global Executive Composite, such that those with higher MD or AD performed more poorly on tests of executive function, r = 0.22, p = .03, and r = 0.21, p = .04, respectively. No other correlation reached significance, p > .10.
Discussion
Despite some previous reports of significant FA differences in subjects with ADHD with respect to controls,8 we did not detect significant diagnosis effects for FA in any of the nine tracts examined, in line with at least one prior study which reported no differences in whole-brain FA between subjects with ADHD and controls.58 One possible explanation of the lack of significant FA effects in our study rests on the observation that FA varies with the ratio of RD to AD.59 Hence, concomitant ADHD-related increases in RD and AD of the kind seen in our study may occur in a white-matter tract without significantly altering the FA value of the tract. It is also worth noting that the majority of previous studies examining FA clusters in ADHD have used voxel-based analyses that rely on accurate subject registration and such registration may be problematic when comparing subjects with ADHD to controls given the region-specific frequently observed volume deficits in ADHD.6,31 Another possibility for these discrepant findings is that while tractography may be a more sensitive method than voxel-based analysis to find subtle differences across major white matter pathways, it may miss highly localized differences in FA (i.e. reduced FA in only one aspect of a particular fiber pathway).60
We found MD to be significantly higher in subjects with ADHD than controls in three white matter tracts: the ATR, forceps minor, and SLF. These findings agree with previously observed elevations in MD in the ATR and SLF.21,27 As elevated MD values may reflect myelin breakdown12 or decreased cellular density,10,12 our findings suggest that subjects with ADHD may have impaired connectivity in tracts relating to attention and executive function.55–57 Furthermore, our findings of associations between higher MD in the forceps minor and inattention and poorer executive function supports that elevated MD within this fiber pathway may be of both clinical and functional relevance.
To determine the microstructural basis of any between-group MD differences, we additionally examined diagnostic group differences in AD and RD. Our finding of higher AD in ADHD agrees with prior findings of higher AD in subjects with ADHD in certain white matter regions.26,30 While the biological correlates of AD require further examination, increases in AD may reflect a decreased number of neurofilaments or microtubules within myelinated axons.16 However, several prior studies show that FA increases, while to a lesser extent AD and RD decrease during normal brain maturation.59,61,62 Since AD differences are also associated with axonal pruning,15 our results may point to altered axonal architecture linked with impaired maturational processes in subjects with ADHD and their unaffected siblings.
We also found that subjects with ADHD displayed higher RD than controls, but these effects were not as widespread as AD differences. Our results thus agree with previous findings of increased RD in ADHD20 and support that altered structural connectivity in subjects with ADHD may reflect impairments in myelination in some tracts.13,14 Furthermore, our observations that subjects with ADHD have both above-normal AD and RD suggest that ADHD-related changes in structural connectivity are not driven by a single underlying mechanism.
Unaffected siblings of children with ADHD displayed a similar pattern of differences in white matter microstructure with regard to their siblings with ADHD. Such findings are in line with previous studies reporting similarities between subjects with ADHD and their unaffected siblings in both brain macrostructure and activation.35–38 The elevation of MD, AD, and RD measured in specific white-matter tracts in our sample may reflect a trait marker of ADHD shared by subjects with ADHD and their siblings. While representing propensity for, or perhaps heritability of, ADHD, the magnitude of a trait marker may be independent of presence of ADHD symptoms. However, since unaffected siblings share on average only half their genes with their affected probands and environmental factors are not completely overlapping, it is less clear why diffusion effects in siblings appear as pronounced as those observed in patients and not intermediate between patients and typically developing controls. The magnitude of the similarities between subjects with ADHD and their unaffected siblings, however, may also be impacted by noise attributable to random sampling as may be clarified in future studies. After removing unaffected siblings with non-ODD comorbidities from the analyses, all results remained similar with the exception of MD in the forceps minor, which was no longer found to differ significantly between unaffected siblings and controls. This might suggest that such comorbidities may at least partially account for the observed liability effects, although such results could also reflect a loss of statistical power.
Our finding that medicated and non-medicated subjects with ADHD had significantly different MD and AD in the forceps minor raises the possibility that medication may influence white matter microstructure in some tracts. However, the finding that unaffected siblings show similar differences as ADHD subjects suggests that factors other than medication contributed to the observed findings. Nonetheless, we lacked a sufficient sample size to control for medication type or dose in the current study, and thus results must be interpreted with caution.
There are several possible limitations to our study. Our study did not examine cerebellar tracts, and given the potential role of the cerebellum in ADHD,35 future studies of white matter microstructure in ADHD should include more focused examination of cerebellar pathways. Furthermore, differences between subjects with ADHD and controls may not indicate causality for the disorder.7 However, our findings suggest these abnormalities may be of clinical and functional significance. Additionally, though the sample size of our control group was comparable to or larger than that employed in prior ADHD DTI studies,8 the disparity in sample sizes between groups may have led to a failure to detect smaller ADHD effects in some pathways.
In sum, this study provides confirmatory evidence for ADHD-related elevation of MD within several major white matter pathways, particularly those connecting frontal networks. Our failure to observe significant group differences for FA suggests that MD may be a more sensitive biological marker for ADHD and/or that FA effects may be more variable or restricted to specific aspects of fiber pathways. We additionally found that unaffected siblings of subjects with ADHD exhibit similar patterns of elevated MD, supporting that altered white matter microstructure contributes to familial liability for ADHD and thus may be considered an endophenotype in future genetic studies. Furthermore, both changes in MD and AD relate to measures of attention and global executive function, supporting that such abnormalities may be of some specific clinical and functional relevance.
Supplementary Material
Acknowledgments
This work was supported by grants from the National Institutes of Health and the National Institute of Mental Health (RC1MH088507, R01MH092301 and P41RR013642).
The UCLA Statistical Consulting Center provided statistical support for this research.
Footnotes
Supplemental material cited in this article is available online.
Disclosure: Drs. Levitt, Loo, O’Neill, Alger, and Narr, Ms. Lawrence, Mr. Ly, and Mr. Yee report no biomedical financial interests or potential conflicts of interest.
Publisher's Disclaimer: This is a PDF file of an unedited manuscript that has been accepted for publication. As a service to our customers we are providing this early version of the manuscript. The manuscript will undergo copyediting, typesetting, and review of the resulting proof before it is published in its final citable form. Please note that during the production process errors may be discovered which could affect the content, and all legal disclaimers that apply to the journal pertain.
Contributor Information
Ms. Katherine E. Lawrence, David Geffen School of Medicine, University of California–Los Angeles (UCLA)
Dr. Jennifer G. Levitt, UCLA Semel Institute for Neuroscience and Human Behavior
Dr. Sandra K. Loo, UCLA Semel Institute for Neuroscience and Human Behavior.
Mr Ronald Ly, UCLA Semel Institute for Neuroscience and Human Behavior
Mr Victor Yee, UCLA Semel Institute for Neuroscience and Human Behavior
Dr. Joseph O’Neill, UCLA Semel Institute for Neuroscience and Human Behavior
Dr. Jeffry Alger, David Geffen School of Medicine, University of California–Los Angeles (UCLA)
Dr. Katherine L. Narr, David Geffen School of Medicine, University of California–Los Angeles (UCLA)
References
- 1.American Psychiatric Association. Diagnostic and statistical manual of mental disorders. 4. Washington, DC: 2000. [Google Scholar]
- 2.Polanczyk G, de Lima MS, Horta BL, Biederman J, Rohde LA. The worldwide prevalence of ADHD: a systematic review and metaregression analysis. Am J Psychiatry. 2007 Jun;164(6):942–948. doi: 10.1176/ajp.2007.164.6.942. [DOI] [PubMed] [Google Scholar]
- 3.Swensen AR, Birnbaum HG, Secnik K, Marynchenko M, Greenberg P, Claxton A. Attention-deficit/hyperactivity disorder: increased costs for patients and their families. J Am Acad Child Adolesc Psychiatry. 2003 Dec;42(12):1415–1423. doi: 10.1097/00004583-200312000-00008. [DOI] [PubMed] [Google Scholar]
- 4.Bush G, Valera EM, Seidman LJ. Functional neuroimaging of attention-deficit/hyperactivity disorder: a review and suggested future directions. Biol Psychiatry. 2005 Jun 1;57(11):1273–1284. doi: 10.1016/j.biopsych.2005.01.034. [DOI] [PubMed] [Google Scholar]
- 5.Konrad K, Eickhoff SB. Is the ADHD brain wired differently? A review on structural and functional connectivity in attention deficit hyperactivity disorder. Hum Brain Mapp. 2010 Jun;31(6):904–916. doi: 10.1002/hbm.21058. [DOI] [PMC free article] [PubMed] [Google Scholar]
- 6.Castellanos FX, Lee PP, Sharp W, et al. Developmental trajectories of brain volume abnormalities in children and adolescents with attention-deficit/hyperactivity disorder. JAMA. 2002 Oct 9;288(14):1740–1748. doi: 10.1001/jama.288.14.1740. [DOI] [PubMed] [Google Scholar]
- 7.Liston C, Malter Cohen M, Teslovich T, Levenson D, Casey BJ. Atypical prefrontal connectivity in attention-deficit/hyperactivity disorder: pathway to disease or pathological end point? Biol Psychiatry. 2011 Jun 15;69(12):1168–1177. doi: 10.1016/j.biopsych.2011.03.022. [DOI] [PubMed] [Google Scholar]
- 8.van Ewijk H, Heslenfeld DJ, Zwiers MP, Buitelaar JK, Oosterlaan J. Diffusion tensor imaging in attention deficit/hyperactivity disorder: a systematic review and meta-analysis. Neurosci Biobehav Rev. 2012 Apr;36(4):1093–1106. doi: 10.1016/j.neubiorev.2012.01.003. [DOI] [PubMed] [Google Scholar]
- 9.Le Bihan D, Mangin JF, Poupon C, et al. Diffusion tensor imaging: concepts and applications. J Magn Reson Imaging. 2001 Apr;13(4):534–546. doi: 10.1002/jmri.1076. [DOI] [PubMed] [Google Scholar]
- 10.Alexander AL, Lee JE, Lazar M, Field AS. Diffusion tensor imaging of the brain. Neurotherapeutics. 2007 Jul;4(3):316–329. doi: 10.1016/j.nurt.2007.05.011. [DOI] [PMC free article] [PubMed] [Google Scholar]
- 11.Assaf Y, Pasternak O. Diffusion tensor imaging (DTI)-based white matter mapping in brain research: a review. J Mol Neurosci. 2008;34(1):51–61. doi: 10.1007/s12031-007-0029-0. [DOI] [PubMed] [Google Scholar]
- 12.Tievsky AL, Ptak T, Farkas J. Investigation of apparent diffusion coefficient and diffusion tensor anisotrophy in acute and chronic multiple sclerosis lesions. AJNR Am J Neuroradiol. 1999 Sep;20(8):1491–1499. [PMC free article] [PubMed] [Google Scholar]
- 13.Song SK, Sun SW, Ramsbottom MJ, Chang C, Russell J, Cross AH. Dysmyelination revealed through MRI as increased radial (but unchanged axial) diffusion of water. Neuroimage. 2002 Nov;17(3):1429–1436. doi: 10.1006/nimg.2002.1267. [DOI] [PubMed] [Google Scholar]
- 14.Song SK, Sun SW, Ju WK, Lin SJ, Cross AH, Neufeld AH. Diffusion tensor imaging detects and differentiates axon and myelin degeneration in mouse optic nerve after retinal ischemia. Neuroimage. 2003 Nov;20(3):1714–1722. doi: 10.1016/j.neuroimage.2003.07.005. [DOI] [PubMed] [Google Scholar]
- 15.Bockhorst KH, Narayana PA, Liu R, et al. Early postnatal development of rat brain: in vivo diffusion tensor imaging. J Neurosci Res. 2008 May 15;86(7):1520–1528. doi: 10.1002/jnr.21607. [DOI] [PubMed] [Google Scholar]
- 16.Kinoshita Y, Ohnishi A, Kohshi K, Yokota A. Apparent diffusion coefficient on rat brain and nerves intoxicated with methylmercury. Environ Res. 1999 May;80(4):348–354. doi: 10.1006/enrs.1998.3935. [DOI] [PubMed] [Google Scholar]
- 17.Ashtari M, Kumra S, Bhaskar SL, et al. Attention-deficit/hyperactivity disorder: a preliminary diffusion tensor imaging study. Biol Psychiatry. 2005 Mar 1;57(5):448–455. doi: 10.1016/j.biopsych.2004.11.047. [DOI] [PubMed] [Google Scholar]
- 18.Hamilton LS, Levitt JG, O’Neill J, et al. Reduced white matter integrity in attention-deficit hyperactivity disorder. Neuroreport. 2008 Nov 19;19(17):1705–1708. doi: 10.1097/WNR.0b013e3283174415. [DOI] [PMC free article] [PubMed] [Google Scholar]
- 19.Kobel M, Bechtel N, Specht K, et al. Structural and functional imaging approaches in attention deficit/hyperactivity disorder: does the temporal lobe play a key role? Psychiatry Res. 2010 Sep 30;183(3):230–236. doi: 10.1016/j.pscychresns.2010.03.010. [DOI] [PubMed] [Google Scholar]
- 20.Nagel BJ, Bathula D, Herting M, et al. Altered white matter microstructure in children with attention-deficit/hyperactivity disorder. J Am Acad Child Adolesc Psychiatry. 2011 Mar;50(3):283–292. doi: 10.1016/j.jaac.2010.12.003. [DOI] [PMC free article] [PubMed] [Google Scholar]
- 21.Pavuluri MN, Yang S, Kamineni K, et al. Diffusion tensor imaging study of white matter fiber tracts in pediatric bipolar disorder and attention-deficit/hyperactivity disorder. Biol Psychiatry. 2009 Apr 1;65(7):586–593. doi: 10.1016/j.biopsych.2008.10.015. [DOI] [PMC free article] [PubMed] [Google Scholar]
- 22.Qiu MG, Ye Z, Li QY, Liu GJ, Xie B, Wang J. Changes of brain structure and function in ADHD children. Brain Topogr. 2011 Oct;24(3–4):243–252. doi: 10.1007/s10548-010-0168-4. [DOI] [PubMed] [Google Scholar]
- 23.Bechtel N, Kobel M, Penner IK, et al. Decreased fractional anisotropy in the middle cerebellar peduncle in children with epilepsy and/or attention deficit/hyperactivity disorder: a preliminary study. Epilepsy Behav. 2009 Jul;15(3):294–298. doi: 10.1016/j.yebeh.2009.04.005. [DOI] [PubMed] [Google Scholar]
- 24.Davenport ND, Karatekin C, White T, Lim KO. Differential fractional anisotropy abnormalities in adolescents with ADHD or schizophrenia. Psychiatry Res. 2010 Mar 30;181(3):193–198. doi: 10.1016/j.pscychresns.2009.10.012. [DOI] [PMC free article] [PubMed] [Google Scholar]
- 25.Li Q, Sun J, Guo L, et al. Increased fractional anisotropy in white matter of the right frontal region in children with attention-deficit/hyperactivity disorder: a diffusion tensor imaging study. Neuro Endocrinol Lett. 2010;31(6):747–753. [PubMed] [Google Scholar]
- 26.Tamm L, Barnea-Goraly N, Reiss AL. Diffusion tensor imaging reveals white matter abnormalities in Attention-Deficit/Hyperactivity Disorder. Psychiatry research. 2012 May 31;202(2):150–154. doi: 10.1016/j.pscychresns.2012.04.001. [DOI] [PMC free article] [PubMed] [Google Scholar]
- 27.Konrad A, Dielentheis TF, El Masri D, et al. Disturbed structural connectivity is related to inattention and impulsivity in adult attention deficit hyperactivity disorder. Eur J Neurosci. 2010 Mar;31(5):912–919. doi: 10.1111/j.1460-9568.2010.07110.x. [DOI] [PubMed] [Google Scholar]
- 28.Makris N, Buka SL, Biederman J, et al. Attention and executive systems abnormalities in adults with childhood ADHD: A DT-MRI study of connections. Cereb Cortex. 2008 May;18(5):1210–1220. doi: 10.1093/cercor/bhm156. [DOI] [PubMed] [Google Scholar]
- 29.Peterson DJ, Ryan M, Rimrodt SL, et al. Increased regional fractional anisotropy in highly screened attention-deficit hyperactivity disorder (ADHD) J Child Neurol. 2011 Oct;26(10):1296–1302. doi: 10.1177/0883073811405662. [DOI] [PMC free article] [PubMed] [Google Scholar]
- 30.Silk TJ, Vance A, Rinehart N, Bradshaw JL, Cunnington R. White-matter abnormalities in attention deficit hyperactivity disorder: a diffusion tensor imaging study. Hum Brain Mapp. 2009 Sep;30(9):2757–2765. doi: 10.1002/hbm.20703. [DOI] [PMC free article] [PubMed] [Google Scholar]
- 31.Vangberg TR, Skranes J, Dale AM, Martinussen M, Brubakk AM, Haraldseth O. Changes in white matter diffusion anisotropy in adolescents born prematurely. Neuroimage. 2006 Oct 1;32(4):1538–1548. doi: 10.1016/j.neuroimage.2006.04.230. [DOI] [PubMed] [Google Scholar]
- 32.Jones DK. The effect of gradient sampling schemes on measures derived from diffusion tensor MRI: a Monte Carlo study. Magn Reson Med. 2004 Apr;51(4):807–815. doi: 10.1002/mrm.20033. [DOI] [PubMed] [Google Scholar]
- 33.Casey BJ, Epstein JN, Buhle J, et al. Frontostriatal connectivity and its role in cognitive control in parent-child dyads with ADHD. Am J Psychiatry. 2007 Nov;164(11):1729–1736. doi: 10.1176/appi.ajp.2007.06101754. [DOI] [PubMed] [Google Scholar]
- 34.Faraone SV, Perlis RH, Doyle AE, et al. Molecular genetics of attention-deficit/hyperactivity disorder. Biol Psychiatry. 2005 Jun 1;57(11):1313–1323. doi: 10.1016/j.biopsych.2004.11.024. [DOI] [PubMed] [Google Scholar]
- 35.Durston S, Hulshoff Pol HE, Schnack HG, et al. Magnetic resonance imaging of boys with attention-deficit/hyperactivity disorder and their unaffected siblings. J Am Acad Child Psy. 2004 Mar;43(3):332–340. doi: 10.1097/00004583-200403000-00016. [DOI] [PubMed] [Google Scholar]
- 36.Durston S, Mulder M, Casey BJ, Ziermans T, van Engeland H. Activation in ventral prefrontal cortex is sensitive to genetic vulnerability for attention-deficit hyperactivity disorder. Biological psychiatry. 2006 Nov 15;60(10):1062–1070. doi: 10.1016/j.biopsych.2005.12.020. [DOI] [PubMed] [Google Scholar]
- 37.Durston S, Fossella JA, Mulder MJ, et al. Dopamine transporter genotype conveys familial risk of attention-deficit/hyperactivity disorder through striatal activation. J Am Acad Child Psy. 2008 Jan;47(1):61–67. doi: 10.1097/chi.0b013e31815a5f17. [DOI] [PubMed] [Google Scholar]
- 38.Mulder MJ, Baeyens D, Davidson MC, et al. Familial vulnerability to ADHD affects activity in the cerebellum in addition to the prefrontal systems. J Am Acad Child Psy. 2008 Jan;47(1):68–75. doi: 10.1097/chi.0b013e31815a56dc. [DOI] [PubMed] [Google Scholar]
- 39.Kaufman J, Birmaher B, Brent D, et al. Schedule for Affective Disorders and Schizophrenia for School-Age Children Present and Lifetime version (K-SADS-PL): Initial reliability and validity data. J Am Acad Child Psy. 1997 Jul;36(7):980–988. doi: 10.1097/00004583-199707000-00021. [DOI] [PubMed] [Google Scholar]
- 40.Swanson J. School-Based Assessments and Interventions for ADD Students. Irvine, CA: K. C. Publishing; 1992. [Google Scholar]
- 41.Wechsler D. Wechsler Intelligence Scale for Children. 3. San Antonio, TX: Psychological Corporation; 1991. [Google Scholar]
- 42.Wechsler D. Wechsler Adult Intelligence Scale. 3. San Antonio, TX: Psychological Corporation; 1997. [Google Scholar]
- 43.Gio GA, Isquith PK, Guy SC, Kenworthy L. Behavior Rating Inventory of Executive Function. Odessa, FL: Psychological Assessment Resources; 2000. [Google Scholar]
- 44.Rex DE, Ma JQ, Toga AW. The LONI Pipeline Processing Environment. Neuroimage. 2003 Jul;19(3):1033–1048. doi: 10.1016/s1053-8119(03)00185-x. [DOI] [PubMed] [Google Scholar]
- 45.Jezzard P, Barnett AS, Pierpaoli C. Characterization of and correction for eddy current artifacts in echo planar diffusion imaging. Magn Reson Med. 1998 May;39(5):801–812. doi: 10.1002/mrm.1910390518. [DOI] [PubMed] [Google Scholar]
- 46.Woods RP, Grafton ST, Holmes CJ, Cherry SR, Mazziotta JC. Automated image registration: I. General methods and intrasubject, intramodality validation. J Comput Assist Tomogr. 1998 Jan-Feb;22(1):139–152. doi: 10.1097/00004728-199801000-00027. [DOI] [PubMed] [Google Scholar]
- 47.Woods RP, Grafton ST, Watson JD, Sicotte NL, Mazziotta JC. Automated image registration: II. Intersubject validation of linear and nonlinear models. J Comput Assist Tomogr. 1998 Jan-Feb;22(1):153–165. doi: 10.1097/00004728-199801000-00028. [DOI] [PubMed] [Google Scholar]
- 48.Smith SM. Fast robust automated brain extraction. Hum Brain Mapp. 2002 Nov;17(3):143–155. doi: 10.1002/hbm.10062. [DOI] [PMC free article] [PubMed] [Google Scholar]
- 49.Pierpaoli C, Basser PJ. Toward a quantitative assessment of diffusion anisotropy. Magn Reson Med. 1996 Dec;36(6):893–906. doi: 10.1002/mrm.1910360612. [DOI] [PubMed] [Google Scholar]
- 50.Jiang H, van Zijl PC, Kim J, Pearlson GD, Mori S. DtiStudio: resource program for diffusion tensor computation and fiber bundle tracking. Comput Methods Programs Biomed. 2006 Feb;81(2):106–116. doi: 10.1016/j.cmpb.2005.08.004. [DOI] [PubMed] [Google Scholar]
- 51.Wakana S, Caprihan A, Panzenboeck MM, et al. Reproducibility of quantitative tractography methods applied to cerebral white matter. Neuroimage. 2007 Jul 1;36(3):630–644. doi: 10.1016/j.neuroimage.2007.02.049. [DOI] [PMC free article] [PubMed] [Google Scholar]
- 52.Phillips OR, Nuechterlein KH, Clark KA, et al. Fiber tractography reveals disruption of temporal lobe white matter tracts in schizophrenia. Schizophr Res. 2009 Jan;107(1):30–38. doi: 10.1016/j.schres.2008.10.019. [DOI] [PMC free article] [PubMed] [Google Scholar]
- 53.Smith SM, Jenkinson M, Woolrich MW, et al. Advances in functional and structural MR image analysis and implementation as FSL. NeuroImage. 2004;23 (Suppl 1):S208–219. doi: 10.1016/j.neuroimage.2004.07.051. [DOI] [PubMed] [Google Scholar]
- 54.Benjamini Y, Hochberg Y. Controlling the false discovery rate: a practical and powerful approach to multiple testing. J R Stat Soc Series B Stat Methodol. 1995;57(1):289–300. [Google Scholar]
- 55.Catani M, Thiebaut de Schotten M. A diffusion tensor imaging tractography atlas for virtual in vivo dissections. Cortex. 2008 Sep;44(8):1105–1132. doi: 10.1016/j.cortex.2008.05.004. [DOI] [PubMed] [Google Scholar]
- 56.Makris N, Kennedy DN, McInerney S, et al. Segmentation of subcomponents within the superior longitudinal fascicle in humans: a quantitative, in vivo, DT-MRI study. Cerebral cortex. 2005 Jun;15(6):854–869. doi: 10.1093/cercor/bhh186. [DOI] [PubMed] [Google Scholar]
- 57.Van der Werf YD, Jolles J, Witter MP, Uylings HB. Contributions of thalamic nuclei to declarative memory functioning. Cortex. 2003 Sep-Dec;39(4–5):1047–1062. doi: 10.1016/s0010-9452(08)70877-3. [DOI] [PubMed] [Google Scholar]
- 58.de Zeeuw P, Schnack HG, van Belle J, et al. Differential brain development with low and high IQ in attention-deficit/hyperactivity disorder. PLoS One. 2012;7(4):e35770. doi: 10.1371/journal.pone.0035770. [DOI] [PMC free article] [PubMed] [Google Scholar]
- 59.Faria AV, Zhang J, Oishi K, et al. Atlas-based analysis of neurodevelopment from infancy to adulthood using diffusion tensor imaging and applications for automated abnormality detection. NeuroImage. 2010 Aug 15;52(2):415–428. doi: 10.1016/j.neuroimage.2010.04.238. [DOI] [PMC free article] [PubMed] [Google Scholar]
- 60.Davatzikos C. Why voxel-based morphometric analysis should be used with great caution when characterizing group differences. Neuroimage. 2004 Sep;23(1):17–20. doi: 10.1016/j.neuroimage.2004.05.010. [DOI] [PubMed] [Google Scholar]
- 61.Kumar R, Nguyen HD, Macey PM, Woo MA, Harper RM. Regional brain axial and radial diffusivity changes during development. J Neurosci Res. 2012 Feb;90(2):346–355. doi: 10.1002/jnr.22757. [DOI] [PMC free article] [PubMed] [Google Scholar]
- 62.Lebel C, Gee M, Camicioli R, Wieler M, Martin W, Beaulieu C. Diffusion tensor imaging of white matter tract evolution over the lifespan. Neuroimage. 2012 Mar;60(1):340–352. doi: 10.1016/j.neuroimage.2011.11.094. [DOI] [PubMed] [Google Scholar]
Associated Data
This section collects any data citations, data availability statements, or supplementary materials included in this article.