

Abstract
Melanin-concentrating hormone (MCH) is a hypothalamic neuropeptide that acts via MCH receptor 1 (MCHR1) in the mouse. It promotes positive energy balance thus mice lacking MCH or MCHR1 are lean, hyperactive, and resistant to diet-induced obesity. Identifying the cellular targets of MCH is an important step to understanding the mechanisms underlying MCH actions. We generated the Mchr1-cre mouse that expressed cre recombinase driven by the MCHR1 promoter and crossed it with a tdTomato reporter mouse. The resulting Mchr1-cre/tdTomato progeny expressed easily detectable tdTomato fluorescence in MCHR1 neurons, which were found throughout the olfactory system, striatum, and hypothalamus. To chemically identify MCH-targeted cell populations that play a role in energy balance, MCHR1 hypothalamic neurons were characterized by colabeling select hypothalamic neuropeptides with tdTomato fluorescence. TdTomato fluorescence colocalized with dynorphin, oxytocin, vasopressin, enkephalin, thyrothropin-releasing hormone, and corticotropin-releasing factor immunoreactive cells in the paraventricular nucleus. In the lateral hypothalamus, neurotensin but neither orexin nor MCH neurons expressed tdTomato. In the arcuate nucleus, both Neuropeptide Y and proopiomelanocortin cells expressed tdTomato. We further demonstrated that some of these arcuate neurons were also targets of leptin action. Interestingly, MCHR1 was expressed in the vast majority of leptin-sensitive proopiomelanocortin neurons, highlighting their importance for the orexigenic actions of MCH. Taken together, this study supports the use of the Mchr1-cre mouse for outlining the neuroanatomical distribution and neurochemical phenotype of MCHR1 neurons.
Keywords: Cre recombinase, tdTomato, slc-1, immunohistochemistry, leptin, GPR24
INTRODUCTION
Melanin-concentrating hormone (MCH) is a 19-amino acid cyclic hypothalamic neuropeptide that plays a critical role in regulating energy balance. Both pharmacological and genetic studies have demonstrated the orexigenic effects of MCH. Acute injection of MCH into the lateral ventricle stimulates feeding (Qu et al., 1996; Rossi et al., 1997; Tritos et al., 1998) and its chronic infusion leads to increased body weight gain and obesity (Della-Zuana et al., 2002; Gomori et al., 2003; Shearman et al., 2003). Furthermore, mice lacking MCH are lean and have increased energy expenditure (Shimada et al., 1998; Kokkotou et al., 2005; Alon and Friedman, 2006) while mice overexpressing MCH leads to modest obesity and enhanced sensitivity to diet-induced obesity (Ludwig et al., 2001). In the mouse, the effects of MCH are mediated through a single receptor, designated MCHR1. Mice in which MCHR1 has been ablated have a phenotype similar to mice lacking MCH (Chen et al., 2002; Marsh et al., 2002). Similarly, multiple studies using MCH antagonists have demonstrated that inhibition of the MCH system leads to weight loss and prevention of diet-induced obesity (Mashiko et al., 2005; Gomori et al., 2007; Ito et al., 2010). In addition, there is also emerging evidence demonstrating a role for MCH in motivation and reward systems (Georgescu et al., 2005), striatal functions to modulate locomotor and wheel-running activity (Smith et al., 2005; Pissios et al., 2008), memory consolidation (Varas et al., 2003; Pachoud et al., 2010), and olfactory behaviors (Adams et al., 2011).
MCH is synthesized as a pre-prohormone and processed to the mature peptide in a unique group of neurons within the lateral hypothalamus and zona incerta (Bittencourt et al., 1992). MCH-immunoreactive fibers project throughout the brain (Bittencourt et al., 1992; Elias et al., 2008; Croizier et al., 2010) and this distribution pattern is consistent with the pattern of MCHR1 gene expression (Kokkotou et al., 2001; Saito et al., 2001). However, little is known about the neurons that express MCHR1 as no antibodies for this receptor are available. In order to characterize MCHR1 neurons, we generated the Mchr1-cre/tdTomato mouse in which expression of the tdTomato reporter is driven by the MCHR1 promoter in a cre dependent manner. The Mchr1-cre/tdTomato mouse presents an effective tool for studying the anatomical distribution of MCHR1 neurons and elucidating the functional systems targeted by MCH. We determined the neurochemical identities of MCHR1-expressing neurons in the hypothalamus, a key regulator of energy balance. We found that MCHR1 neurons are distributed throughout the hypothalamus, comprising a heterogeneous population of peptidergic neurons. Furthermore, MCHR1-expressing neurons are abundant in the arcuate nucleus where they are also targets of leptin action.
MATERIALS AND METHODS
The procedures used for these studies were in accordance with the guidelines and approval of Beth Israel Deaconess Medical Center Institutional Animal Care and Use Committees.
Animals
Generation of the Mchr1-cre/tdTomato mouse
Using a BAC clone, the cre sequence (1032 bp) was inserted downstream of the Mchr1 promoter, in the place of a 37 bp fragment comprising nucleotides 4–41 from exon 1 of the mouse Mchr1 gene (Figure 1). In effect, the Mchr1-cre mouse selectively expressed cre recombinase in cells that produce MCHR1. To visualize MCHR1-expressing neurons, the Mchr1-cre mouse was crossed to the tdTomato reporter mouse (Stock No. 007905, Jackson Laboratory; kind gift from Dr. Bradford Lowell, Beth Israel Deaconess Medical Center, Boston, MA). The upstream, loxP-flanked STOP cassette prevents the transcription of tdTomato gene in the absence of cre recombinase. When the tdTomato reporter mouse is crossed with the Mchr1-cre mouse, a cre recombination event excises the STOP cassette, to allow the constitutive expression of tdTomato selectively in MCHR1-expressing neurons. The tdTomato fluorescent protein variant was chosen for the brightness of its fluorescence intensity and resistance to photobleaching (Shaner et al., 2004).
Figure 1. Generation of mice expressing tdTomato selectively in MCHR1-expressing cells.
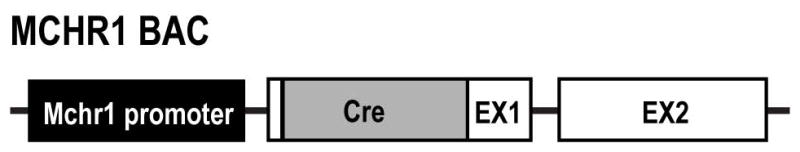
Schematic illustration of the Mchr1-cre construct. Using a BAC clone, the cre sequence was inserted downstream of the Mchr1 promoter, within exon 1 (EX1) of the Mchr1 gene by homologous recombination. The Mchr1 promoter upstream of the Mchr1 EX1 and exon 2 (EX2) coding sequence drives the expression of cre recombinase. This allows cre recombinase to be expressed from MCHR1-containing cells only.
Generation of Npy-hrGFP; Mchr1-cre/tdTomato and Pomc-hrGFP; Mchr1-cre/tdTomato mice
To visualize NPY and POMC neurons in Mchr1-cre/tdTomato mice, we bred the Mchr1-cre/tdTomato mouse with the Npy-hrGFP (van den Pol et al., 2009) and Pomc-hrGFP (Parton et al., 2007) transgenic mouse (both are kind gifts from Dr. Bradford Lowell, Beth Israel Deaconess Medical Center, Boston, MA) to obtain the Npy-hrGFP; Mchr1-cre/tdTomato and Pomc-hrGFP; Mchr1-cre/tdTomato mouse, respectively.
Antibody characterization
A list of antibodies used for IHC is presented in Table 1. The polyclonal DsRed antibody (Clontech, 632496) was raised against the synthetic full length variant of the Discosoma sp. red fluorescent protein, DsRed-Express. It recognizes DsRed-Express, DsRed-Monomer, and both N- and C-terminal fusion proteins containing these DsRed variants. This antibody recognized a specific 30–38 kDa band fragment on Western blot containing human embryonic kidney cells stably expressing DsRed-Express or DsRed-Monomer and corresponds to the expected molecular weight of DsRed (Clontech, certificate of analysis). The specificity of the DsRed antiserum was confirmed by an absence of immunostaining in Mchr1-cre mice that did not express tdTomato (data not shown).
Table 1.
List of primary antibodies used.
| Antigen | Immunogen | Host, Type | Manufacturer, Catalogue number | Dilution |
|---|---|---|---|---|
| DsRed | Synthetic full length variant of Discosoma sp. red fluorescent protein, DsRed-Express | Rabbit, Polyclonal | Clontech, # 632496 | 1:3000 |
| AVP | Synthetic full length AVP peptide specific for bovine, guinea pig, human, mouse, porcine, rat, and sheep AVP | Rabbit, Polyclonal | Bachem, # T-4563 | 1:1000 |
| CRF | Synthetic full length CRF peptide specific for human, mouse, and rat CRF | Guinea pig, Polyclonal | Bachem, # T-5007 | 1:1000 |
| Dyn | Synthetic peptide of amino acids 1–17 of porcine DYN specific for bovine, guinea pig, human, porcine, rat, and sheep Dyn | Rabbit, Polyclonal | Bachem, # T-4280 | 1:1000 |
| ENK | Synthetic full length ENK peptide specific for bird, European starling, human, rat, and zebra finch ENK | Rabbit, Polyclonal | Immunostar, # 20065 | 1:1000 |
| MCH | Synthetic full length MCH peptide specific for human, mouse, and rat MCH | Rabbit, Polyclonal | Dr. E Maratos-Flier | 1:5000 |
| NT | Synthetic full length human NT peptide specific for mouse and rat NT | Rabbit, Polyclonal | Immunostar, # 20072 | 1:1000 |
| ORX | Synthetic peptide of amino acids 78–96 of human preproorexin specific for human, mouse, and rat ORX | Goat, Polyclonal | Santa Cruz, # 8071 | 1:1000 |
| OT | Synthetic full length OT peptide specific for bovine, horse, human, mouse, porcine, rat, and sheep OT | Rabbit, Polyclonal | Bachem, # T-4084 | 1:1000 |
| pSTAT3 | Synthetic peptide of amino acids 696–712 of mouse STAT3 | Rabbit, Polyclonal | Cell Signaling, #9131 | 1:1000 |
| TRH | Synthetic full length TRH peptide specific for mouse and rat TRH | Sheep, Polyclonal | Dr. C Fekete | 1:4000 |
AVP, Arg-vasopressin; CRF, corticotrophin-releasing factor; Dyn, dynorphin-A; ENK, Met-enkephalin; MCH, melanin-concentrating hormone; NT, neurotensin; ORX, orexin-B; OT, oxytocin; pSTAT3, phosphorylated signal transducer and activator of transcription; TRH, thyrotropin-releasing hormone.
The polyclonal Arg-vasopressin (AVP) antibody (Bachem, T-4563) was made in rabbit against a synthetic full length AVP peptide linked thyroglobulin. Cross-reactivity of the AVP antibody was confirmed by radioimmunoassay applications to the synthetic AVP peptide and is specific for mouse, human, sheep, bovine, rat, porcine, and guinea pig AVP (Bachem, technical information datasheet). Antibody specificity was demonstrated by a lack of AVP-specific immunostaining in AVP-expressing tissues after preadsorption with 50 μM AVP (Bamshad et al., 1993; Wang et al., 1996). Meanwhile preadsorption with 50 μM oxytocin, which exhibits high structural similarities, did not affect any loss of immunostaining signal (Bamshad et al., 1993). The distribution of AVP-immunoreactivity observed was similar to previous reports from the vole (Wang et al., 1996), rat (Dohanics et al., 1996), and mouse brain (Kádár et al., 2010).
The polyclonal corticotropin-releasing factor (CRF) (Bachem, T-5007) antibody was made in guinea pig against the full length of a synthetic CRF peptide. Cross-reactivity of the CRF antibody was confirmed by radioimmunoassay applications to the synthetic CRF peptide and is specific for human, mouse, and rat CRF and less than 0.5% cross-reactivity to bovine CRF (Bachem, technical information datasheet). Preadsorption of this antibody with 10 μM CRF abolished immunolabeling (Das et al., 2007). The distribution of CRF-immunoreactivity observed in the hypothalamus was similar to previous reports in rats (Das et al., 2007) and mice (Alon et al., 2009).
The dynorphin-A (Dyn) antibody (Bachem, T-4267) was made in rabbit against amino acids 1–17 of porcine dynorphin-A conjugated to bovine serum albumin. Cross-reactivity of the Dyn antibody was confirmed by radioimmunoassay to the synthetic full length Dyn peptide and is specific for bovine, sheep, rat, human, porcine, mouse, and guinea pig Dyn-A (Bachem, manufacturer information). Antibody specificity was demonstrated by the lack of Dyn immunolabeling following preadsorption with 5 μM Dyn but not with 5 μM Leu- or 5 μM Met-enkephalin (Marvizón et al., 2009). The antibody stained the appropriate pattern of hypothalamic neurons indicated in rat (Vincent et al., 1982) and sheep (Foradori et al., 2005).
The Met-enkephalin (ENK) antibody (Immunostar, 20065) was made in rabbit against a synthetic full length ENK peptide coupled to bovine thyroglobulin with glutaraldehyde. This antibody is specific for rat, bird, human, zebra finch, European starling and mouse (Immunostar, technical information sheet). Specificity of the ENK antibody was demonstrated by the elimination of immunohistochemical staining following preadsorption with 0.5 mg/ml rat ENK (Schneider and Walker, 2007). Pretreatment with 5 μg of Leu-enkephalin (per ml of diluted antiserum) only partially blocked immunostaining (Immunostar, technical information sheet). The distribution of ENK immunoreactivity in the hypothalamus seen here was similar to a previous report (Beaulieu et al., 1996).
The melanin-concentrating hormone (MCH) antibody was made by our laboratory through a contract with a commercial vendor. The synthetic full length MCH was conjugated to keyhole limpet haemocyanin and injected into rabbits. Antibody specificity was demonstrated by a lack of MCH immunostaining after preadsorption with 50 μg MCH (Elias et al., 1998) and by the absence of staining in MCH knockout mice (data not shown). The distribution of MCH immunoreactivity was similar to previous report (Elias et al., 1998).
The neurotensin (NT) antibody (Immunostar, 20072) was made in rabbit raised against the full length synthetic human neurotensin peptide coupled to bovine thyroglobulin with glutaraldehyde. Specificity of the antibody for mouse and rat NT was demonstrated by the elimination of NT-specific immunostaining following preadsorption with 10 μg/ml rat NT (Immunostar, technical information sheet). The distribution of NT immunoreactivity in the hypothalamus is consistent with the distribution of NT mRNA expression (Smits et al., 2004).
The orexin-B (ORX) antibody (Santa Cruz, 8071) was made in goat raised against amino acid 78–96 of the human preproorexin precursor. Antibody specificity was demonstrated by the absence of staining in orexin knockout mice (Crocker et al., 2005). Preadsorption with up to 40 μg/ml ORX-B abolished all specific immunostaining (Santa Cruz, technical information). The distribution of ORX-immunoreactivity observed was similar to previous reports in the rat hypothalamus (de Lecea et al., 1998).
The oxytocin (OT) antibody (Bachem, T-4084) was made in rabbit raised against a full length synthetic oxytocin peptide. Radioimmunoassay application of this OT antibody against the synthetic OT peptide demonstrated complete cross-reactivity to sheep, porcine, bovine, human, mouse, rat, and horse OT (Bachem, manufacturer information). Specificity was demonstrated by the absence of OT immunostaining after preadsorption to 2.5 mg/ml OT and the absence of staining in OT knockout mice (Griffin et al., 2010). The distribution of OT-immunoreactivity observed here was similar to previous reports in mouse PVH (Griffin et al. 2010; Kádár et al., 2010).
The pSTAT3 antibody (Cell Signaling, 9131) was made in rabbit raised against a synthetic phosphopeptide ADPGSAAPyLKTKFIC that flanks Tyr705 (lowercase y) and that corresponds to amino acid 696–712 of mouse STAT3. Specificity was demonstrated by an absence of antibody reactivity following preadsorption with a synthetic pSTAT3 peptide in pSTAT3-expressing tissue sections (Cell Signaling). Nuclear labeling with the pSTAT3 antibody was consistent with the staining pattern seen in the hypothalamus from fasted, leptin-injected mice with the same antibody (Scott et al., 2009). Furthermore, pSTAT3 staining was observed only upon leptin administration, as fasted saline-injected controls exhibited a near total absence of pSTAT3 labeling (data not shown).
The thyrothropin-releasing hormone (TRH) antibody (kind gift from Dr. Csaba Fekete, Hungarian Academy of Sciences, Hungary) was made in sheep raised against full length TRH conjugated to bovine serum albumin with acrolein. Specificity of the antibody was demonstrated by a loss of TRH staining following preadsorption with 80 μg/ml TRH (Wittmann et al., 2009). The distribution of TRH staining was similar to previous reports (Lechan and Jackson, 1982; Kádár et al., 2010).
Secondary antibodies were raised in goat or donkey against the species of the primary antibody (goat, guinea pig, or rabbit) and were coupled to Alexa Fluor 488 (Molecular Probes, Eugene, OR) or DyLight 649 (Jackson Immuno Research Laboratories, West Grove, PA).
Histology
Tissue preparation
Studies were performed in male mice between six to nine weeks of age. In studies examining leptin responses, mice were fasted for 18 h overnight with ad libitum access to water and given leptin (5 mg/kg; Dr. A. F. Parlow, National Hormone and Peptide Program, Torrance, CA) intraperitoneally (ip) 1 h prior to perfusion. Colchicine-treated Mchr1-cre/tdTomato mice were fitted with a 2.6 mm guide cannula (Plastics One; Roanoke, VA) over the right lateral ventricle (AP −0.5 mm, ML −1.3 mm, DV −2.2 mm) one week prior to receiving an intracerebroventricular injection of colchicine (1 μg/g of body weight; Sigma), then perfused after 24 h.
Brains were collected for analysis by deeply anaesthetizing mice with an ip injection of ketamine (100 μg/kg)-xylazine (10 μg/kg). When the mice were under deep anesthesia, they were perfused transcardially with cold diethylpyrocarbonate (DEPC; 0.1% v/v)-treated 0.9% saline followed with cold 10% neutral buffered formalin. For TRH immunohistochemistry, the brains were cleared with saline then perfused with 10% formalin-1% acrolein followed with 10% formalin only (Wittmann et al., 2009). All brains were removed from the skull, postfixed in 10% formalin overnight at 4 C, then cryoprotected in DEPC-treated phosphate-buffered saline (PBS; pH 7.4) containing 20% sucrose, 0.02% sodium azide for 24 h at 4 °C until fully submerged. Coronal sections 30 μm thick were cut from each brain into five equal series on a freezing microtome (Leica SM2000R, Nussloch, Germany). The brain slices were stored at −20 °C in RNAlater (Ambion).
Indirect immunoperoxidase immunohistochemistry (IHC)
Neurons expressing tdTomato were stained by IHC using a polyclonal antiserum made in rabbit against DsRed (Table 1). Brain sections were rinsed six times for 5 min each in PBS and incubated in 0.3% hydrogen peroxide for 30 min to quench endogenous peroxidase activity. After three additional 10 min rinses in PBS, the sections were blocked for two hours with a blocking solution of 3% normal goat serum (NGS; Vector Labs, Burlingame, CA) in 0.02% sodium azide-PBT (PBS with 0.25% Triton X-100). Sections were incubated with anti-rabbit DsRed (1:3000) in the 3% NGS blocking solution for 18 h at room temperature then washed six times, 5 min each, with PBS. This was followed by a 1 h incubation with biotinylated goat anti-rabbit antiserum diluted 1:1000 (Jackson ImmunoResearch Laboratories) in 3% NGS-PBT. After three 10 min PBS rinses, the slices were incubated in ABC diluted 1:500 (Vectastain Elite ABC kit; Vector Labs) in PBS for 1 h, and rinsed with three additional 10 min PBS washes. The sections were reacted with diaminobenzidine (DAB Peroxidase substrate kit; Vector Labs) for no more than 2 min, and the reaction was quenched by submerging the sections in double distilled water and washing twice with PBS for 10 min. Stained sections were mounted on SuperFrost Plus slides (Fisher Scientific), air-dried, dehydrated in increasing concentrations of ethanol (50%, 70%, 95%, 100%), cleared overnight in xylene, then coverslipped with Permaslip (Alban Scientific, St. Louis, MO).
Indirect fluorescence IHC
Fluorescent IHC for Dyn, ENK, OT, AVP, CRF, TRH, MCH, ORX, NT, and pSTAT3 was performed to determine their coexpression with MCHR1-expressing neurons in the hypothalamus. For TRH immunostaining, brain sections were pretreated with 1% sodium borohydride in distilled water for 30 min then washed with distilled water for 3 min (Wittmann et al., 2009). All brain sections were rinsed six times, 5 min each in PBS, blocked with a 3% normal donkey serum (NDS; Jackson Immuno Research Laboratories, West Grove, PA) blocking solution for 2 h, then incubated with the primary antibody in 3% NDS blocking solution at room temperature for 18 h. After six 5 min rinses in PBS, the sections were incubated with a fluorescent AlexaFluor-488 (Molecular Probes) or DyLight-649 (Jackson ImmunoResearch) donkey secondary antiserum diluted 1:300 in 3% NDS-PBT for 2 h at room temperature. Following three 10 min washes with PBS, the stained sections were mounted on and coverslipped with Vectashield HardSet mounting medium (Vector Labs).
In situ hybridization (ISH)
A 35S-labeled antisense MCHR1 riboprobe corresponding to nucleotide 30–1061 of rat Mchr1 mRNA was synthesized to detect MCHR1 mRNA in the brain (Kokkotou et al., 2001; Pissios et al., 2008). The MCHR1 riboprobe was transcribed with T3 polymerase (Promega) from a plasmid linearized with EcoRI (New England Biolabs). Specificity of our MCHR1 riboprobe was demonstrated by the absence of ISH signals when incubated with brain sections from Mchr1−/− mice (Pissios et al., 2008).
Free-floating brain sections were washed six times, 5 min each, with DEPS-PBS then incubated with 10% formalin at 4 °C for 20 min. After rinsing three times, 5 min each, with DEPC-PBS, the sections were pretreated with 0.01M sodium citrate buffer, pH 6.0, for 5 min at 90 °C. Brain sections were allowed to cool then rinsed three times, 5 min each, with DEPC-PBS. They were immediately incubated at 60 °C with the MCHR1 riboprobe that was diluted to 2 × 10⁶ cpm/mL in a hybridization buffer containing 50% formamide, 100 mM dithiothreitol, 0.1% SDS, 0.1% Na-thiosulfate, 1× Denhardt’s solution (Sigma), 10 mM Tris, 1 mM EDTA-pH 8.0, 10% dextran sulfate, 0.01% sheared salmon sperm DNA (Sigma), 0.05% yeast RNA (Sigma), 0.005% yeast tRNA (Invitrogen). After 18 h, sections were rinsed four times, 5 min each, with 2× SSC, then incubated with 0.002% RNase A (Roche) that is diluted in RNase buffer containing 0.5M NaCl, 10 mM Tris-HCl-pH 8.0, 1 mM EDTA for 30 min at 37 °C. The RNase A-treated sections were subsequently rinsed twice with RNase buffer for 15 min each at room temperature then washed sequentially for 1 h each with 2× SSC at 50 °C, 0.2× SSC at 55 °C, and 0.1× SSC at 65 °C.
Slices were mounted on SuperFrost Plus slides, dehydrated in ethanol, delipidated with xylene for 2 h then placed in X-ray film cassettes with BioMax MR film (Kodak) for 5 days. The slides were then dipped in 1:1 water-diluted NTB2 photographic emulsion (Kodak) and air-dried overnight before being stored in dessicant-containing, foil-wrapped slide boxes at 4 °C. After 21 days, the slides were developed with D-19 developer (Kodak) at 18–20 °C then rinsed thoroughly with water prior to ethanol dehydration, clearance in xylenes and coverslipped with Permaslip.
Dual label IHC and in situ hybridization (ISH)
Combined IHC against DsRed and ISH for MCHR1 mRNA was performed in the brains of Mchr1-cre/tdTomato mice to determine whether the Mchr1-cre mouse line activates reporter gene expression similar to the anatomical distribution of MCHR1 mRNA. Free-floating IHC with immunoperoxidase detection was performed prior to ISH. Following six 5 min washes with DEPC-treated PBS and 0.3% hydrogen peroxide treatment, the sections were immediately incubated with the rabbit anti-DsRed antibody (1:3000) for 24 hr at 4 °C. Brain sections were not pre-treated with a serum blocking solution in order to prevent RNase contamination during ISH but all other conditions and procedures for DsRed IHC staining were as described above using pre-chilled (4 °C) DEPC-treated solutions to preserve mRNA quality for ISH. Immediately following IHC, free-floating brain sections were subjected to ISH processing. ISH procedures were as described above but here, the sodium citrate pretreatment was omitted as this reduced the intensity of DAB staining in the tissue.
The expression of MCHR1 mRNA in DsRed-positive cells was identified by the deposition of silver grains within the contours of the brown DsRed-positive cell body at levels twice above background.
Data analysis and photomicrographs
DAB- and ISH-stained sections were analyzed with a Zeiss Axioplan light microscope and the images were acquired using AxioImager software (Carl Zeiss, Thornwood, NY). Darkfield images were captured with a 2.5× or 5× objective. High power magnification images of dual DAB- and silver grain developed ISH sections were captured with a 100× objective.
Fluorescently-labeled sections involving one- or two-color channels were acquired with a Zeiss Imager confocal microscope and the sections involving three-color channels were acquired with a Zeiss LSM 510 confocal microscope. All confocal images were acquired using PASCAL software (Zeiss) as confocal stacks of 1024 × 1024 pixels and each confocal section was averaged twice to improve the signal-to-noise ratio. The Zeiss Imager microscope was used to acquire two-color samples; the excitation light (and emission filter) was provided by the Argon488 (band-pass (BP) 505–530 nm) and HeNe543 laser (long-pass (LP) 560 nm) for the AlexaFluor-488 and tdTomato fluorophore, respectively. The Zeiss LSM 510 confocal microscope was used to acquire three-color samples; the excitation (and emission filter) configurations were provided by the Argon488 (BP 505–530 nm), HeNe543 (BP 560–615 nm), and HeNe633 laser (BP 668–743 nm) for the hrGFP, tdTomato, and DyLight-649 fluorophore, respectively. Controls with one label omitted were used to confirm that the bleed-through between channels with these settings was minimal.
Each confocal stack was flattened using the LSM 510 Browser (Zeiss). The brightness and contrast of the flattened confocal stack was adjusted to increase the sharpness and resolution of the images. With the exception of magenta-green and magenta-green-cyan images provided in the supplementary materials where the red channel showing tdTomato fluorescence was pseudo-colored to magenta, two-color images were coded in green (AlexaFluor 488) and red (tdTomato). Three-color images were coded in green (hrGFP), red (tdTomato), and cyan (DyLight-649). The color-adjusted images were imported as a TIFF file into Adobe Illustrator CS3 (Adobe Systems, Mountain View, CA) for assembling multipanel figures and to add text and arrows.
Cell counting and statistics
Cell counts were made on images taken from a 20× objective. Cell counts were performed on every fifth section of each mouse brain to obtain an estimate of the relative proportion of neurons that were single-, double-, or triple-labeled. For cell counting, images were taken at prespecified areas (450 μm × 450 μm, 10–20 μm thick) from each brain section containing the indicated hypothalamic region: paraventricular (PVH) was sampled at a site beginning 50 μm from the edge of the third ventricle (3V); lateral hypothalamic area (LH) was imaged at three sites that were dorsal, medial, and ventral relative to the fornix; medial and lateral arcuate nucleus (ARC) was imaged 20 μm and 500 μm away from the 3V, respectively. The brain regions were labeled according to Paxinos and Franklin (2001), unless otherwise indicated. The Abercrombie equation was applied to correct the cell counts for cell size, confocal slice thickness, and double-counting. The double- and triple-colocalization studies presented are inherently qualitative, thus the results provide data for relative comparisons of cell numbers and are not accurate counts of absolute cell numbers. Data are presented as average ± SEM.
RESULTS
Colocalization of Mchr1-cre activated tdTomato expression and MCHR1 mRNA
Qualitative estimates of cell distribution in a brain region was performed using a density scale (+++, high; ++, moderate; +, low; −, very low or none; Figure 2). Brain tissue from Mchr1-cre/tdTomato mice was assayed for DsRed immunoreactivity to confirm the expression of tdTomato. The pattern of DsRed immunoreactive (DsRed-IR) cells from Mchr1-cre/tdTomato mouse brains was compared to the expression of MCHR1 mRNA hybridization (MCHR1-ISH) to validate tdTomato fluorescence for MCHR1 expression (Table 2). Overall, the pattern of DsRed-IR (Figure 3A, D, G, J) was consistent with the distribution of MCHR1 mRNA shown by isotopic 35S-label ISH (Figure 3B, E, H, K). Furthermore, in order to demonstrate that the Mchr1-cre line activates tdTomato expression specifically in MCHR1 neurons, we compared the extent of colocalization between MCHR1 mRNA, via ISH, and DsRed-IR, via IHC, in single cells (Figure 4). Exceptions to these patterns are indicated below.
Figure 2. Density of DsRed-immunoreactive cells from the MCHR1-cre/tdTomato mouse brain varies among regions.

Representative photomicrographs of DsRed-IR cells exhibiting A, high density (+++) in the ventromedial nucleus (VMH); B, moderate density (++) in the dorsomedial nucleus (DMH); C, low density (+) in the ventral subfornical lateral hypothalamic area (LHAsf); and D, very low or no (−) labeling in the perifornical area (PeF). Scale bar, 50 μm.
Table 2.
Relative densities of DsRed-immunopositive cells and MCHR1 mRNA throughout the MCHR1-cre/tdTomato mouse brain.
| Region1 | DsRed IHC2 | 35S ISH3 |
|---|---|---|
| Cerebral cortex | ||
| Cingulate cortex | + | ++ |
| Insular cortex | +/++ | ++ |
| Medial orbital cortex | + | + |
| Motor cortex | +++ | ++ |
| Prelimbic cortex | + | ++ |
| Retrosplenial cortex | + | ++ |
| Somatosensory cortex | +++ | ++ |
| Visual cortex | + | +/++ |
| Olfactory | ||
| Accessory olfactory bulb | ++ | ++ |
| Anterior olfactory nucleus | ++ | ++ |
| Endopiriform nucleus | ++ | + |
| Olfactory bulb, mitral/granular | + | ++ |
| Olfactory tubercle | +++ | +++ |
| Piriform cortex | ++ | +++ |
| Amygdala | ||
| Basolateral amygdala | − | − |
| Basomedial amygdala | +/++ | + |
| Central amygdala | −/+ | + |
| Bed nucleus of the stria terminalis | + | + |
| Hippocampus, septum | ||
| CA1 | ++ | +++ |
| CA2 | +++ | +++ |
| CA3 | +++ | +++ |
| Dentate gyrus | +++ | − |
| Indusium griseum | +++ | +++ |
| Lambdoid septal zone | + | + |
| Septohippocampal nucleus | + | + |
| Septal nucleus, lateral/ medial | + | + |
| Basal ganglia | ||
| Caudate putamen | ++ | ++ |
| Islands of Calleja | +++ | +++ |
| Accumbens nucleus, core | +++ | ++ |
| Accumbens nucleus, shell | +++ | +++ |
| Thalamus | −/+ | − |
| Subthalamus, zona incerta | −/+ | ++ |
| Hypothalamus | ||
| Arcuate nucleus | +++ | ++ |
| Dorsomedial nucleus | ++ | + |
| Lateral hypothalamic area | + | −/+ |
| Medial preoptic nucleus | + | + |
| Medial tuberal nucleus | + | − |
| Median eminence | ++ | ++ |
| Paraventricular nucleus, anterior | ++ | ++ |
| Paraventricular nucleus, posterior | − | + |
| Paraventricular nucleus, ventral | ++ | ++ |
| Perifornical area | + | − |
| Periventricular nucleus | ++ | ++ |
| Preoptic nucleus | + | + |
| Suprachiasmatic nucleus | + | − |
| Supraoptic nucleus | ++ | + |
| Ventromedial nucleus, central | ++ | + |
| Ventromedial nucleus, dorsomedial | ++ | + |
| Ventromedial nucleus, ventrolateral | + | ++ |
| Midbrain, hindbrain | ||
| Area postrema | + | −/+ |
| Colliculus, inferior | ++ | + |
| Colliculus, superior | ++ | + |
| Facial nucleus | − | + |
| Hypoglossal nucleus | − | + |
| Interfascicular nucleus | − | − |
| Interpeduncular nucleus | + | + |
| Locus coeruleus | − | ++ |
| Mammillary nucleus | + | + |
| Nucleus of the solitary tract | ++ | + |
| Periaqueductal gray | − | − |
| Periolivary region | + | + |
| Pontine | − | − |
| Substantia nigra | − | − |
| Tegmental nucleus | − | − |
| Trigeminal nucleus | ++ | −/+ |
| Ventral tegmental area | − | − |
| Cerebellum, Purkinje cells | ++ | − |
Qualitative estimates of DsRed-immunoreactive cells were based on the number of labeled cells.
Nomenclature used was based on Paxinos and Franklin (2001).
Representative images of brain regions exhibiting +++, high density; ++, moderate density; +, low density; or −, no labeling of DsRed-immunoreactive cells are shown in Figure 2.
Expression of MCHR1 mRNA was detected by in situ hybridization using a 35S-labeled riboprobe targeting a 1031bp region corresponding to nucleotides 30–1061 of the endogenous rat Mchr1 mRNA.
Figure 3. Comparison of native tdTomato fluorescence and 35S-labeled MCHR1 mRNA hybridization signals in the most prominent regions of the forebrain.
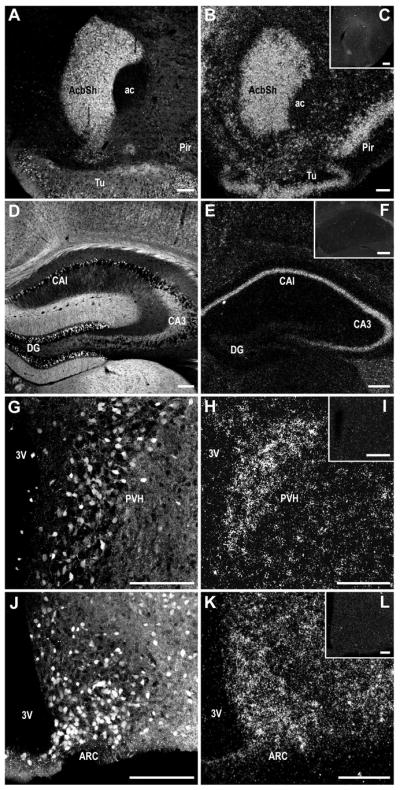
Photomicrographs illustrating the overall similarities in anatomical distribution between native tdTomato fluorescence (A, D, G, J) and 35S-labeled hybridization signal for MCHR1 mRNA (B, E, H, K) observed from the Mchr1-cre/tdTomato mouse brain. Specificity of the 35S-labeled MCHR1 riboprobe was demonstrated by the absence of specific hybridization signals from the respective region of a Mchr1−/− mouse brain (C, F, I, L). 3V, third ventricle; ac, anterior commissure; AcbSh, accumbens nucleus shell; ARC, arcuate nucleus; CA1, field CA1 of hippocampus; CA3, field CA3 of hippocampus; DG, dentate gyrus; Pir, piriform cortex; PVH, paraventricular nucleus of hypothalamus; Tu, olfactory tubercle. Scale bar, 150 μm; 200 μm in inset.
Figure 4. Colocalization of DsRed-immunoreactive cells with 35S-labeled MCHR1 mRNA expression.

Representative bright-field photomicrographs illustrating the overlap of DsRed immunoreactive, labeled with a brown precipitate, and MCHR1 mRNA hybridization regions, labeled with clusters of silver grain deposits, in A–B, the striatum (~Bregma 1.75); C–D, area CA1-subiculum border of the hippocampus (~Bregma −3.40); E–F, paraventricular nucleus of the hypothalamus (~Bregma −0.70); G–H, arcuate nucleus of the hypothalamus (~Bregma −1.50). High power magnification photomicrographs (B, D, F, H) of the area outlined by dotted yellow line (A, C, E, G, respectively) show individual colocalized labeled cells. Some representative colocalized neurons are indicated by yellow arrowheads. 3V, third ventricle; ac, anterior commissure; AcbC, accumbens nucleus core; AcbSh, accumbens nucleus shell; ARC, arcuate nucleus; CA1, field CA1 of hippocampus; CPu, caudate putamen; PVH, paraventricular nucleus of hypothalamus; S, subiculum. Scale bar, 100 μm in A, C, E, G; 20 μm in B, D, F, H.
Striatum
Very strong IHC and ISH signals for DsRed and MCHR1 mRNA, respectively, were present in the striatum, and especially in the anterior accumbens nucleus shell (Figure 3A–B, 4A–B). The difference in DsRed-IR density gradients within the striatal structures was also apparent in the MCHR1 hybridization signal.
Hippocampus
The dense labeling of DsRed-IR cells in areas CA1, CA2, and CA3 was consistent with the strong hybridization signal for MCHR1 mRNA (Figure 3D–E, 4C–D). Colocalization of DsRed-IR and MCHR1-ISH were identified in individual neurons throughout the pyramidal layer of the hippocampal proper (Figure 4C–D). However, not all pyramidal cells in this region showed DsRed-IR thus MCHR1-ISH signals were observed in the absence of DsRed-positive cells. By contrast, the dentate gyrus produced strong DsRed-IR (Figure 3D) but was devoid of MCHR1-ISH (Figure 3E).
Hypothalamus
The hypothalamic MCHR1-ISH signal was weaker relative to the rest of the striatum and hippocampus (Figure 3H, K) but produced similar expression patterns to DsRed-IR. The high density of DsRed-IR cells in the paraventricular nucleus (PVH: Figure 3G) and arcuate nucleus (ARC: Figure 3J) matched the pattern of MCHR1-ISH (PVH: Figure 3H; ARC: Figure 3K) and combined DsRed-IR and MCHR1-ISH demonstrated individual colocalized neurons in the PVH (Figure 4E–F) and ARC (Figure 4G–H). Accordingly, the MCHR1-ISH signal is consistent with the low number of DsRed-IR cells in the lateral hypothalamic area (LH).
By contrast, there was a moderate to high density of DsRed-IR cells in the dorsomedial (DMH) and ventromedial nucleus of the hypothalamus (VMH), respectively. MCHR1-ISH signals were weak to moderate but combined DsRed-IR and MCHR1-ISH demonstrated a colocalization in the overall DMH and VMH region. However, individual colocalized neurons could not be detected. Since ectopic cre expression underlying the high density of DsRed-IR expression in these areas cannot be ruled out, the DMH and VMH were excluded from further analysis of MCHR1-expressing neurons.
Cerebellum
While a moderate density of Purkinje cells were DsRed-IR, there was an absence of ISH signal for MCHR1 mRNA throughout the cerebellum.
Distribution of tdTomato fluorescence and DsRed immunoreactivity in Mchr1-cre/tdTomato mice
The density of DsRed-IR cells from Mchr1-cre/tdTomato mouse brains varied across different brain regions. The pattern of DsRed immunostaining was consistent with the distribution of native tdTomato fluorescence observed from Mchr1-cre/tdTomato brain tissue, unless otherwise indicated. Thus the comparable level of DsRed-immunoreactivity and native tdTomato fluorescence is referred to as “DsRed fluorescence” (DsRed-F). Brain regions exhibiting the highest density of DsRed-F cells were found in the olfactory system, striatum, hippocampus, and hypothalamus.
Olfactory system
Consistent with previous reports of MCHR1 expression, DsRed-F was present throughout the olfactory system, including very dense labeling throughout the accessory olfactory bulb (AOB; Figure 5A), piriform cortex (Pir; Figure 5C), and olfactory tubercle (Tu). The density of fluorescent cells was moderate throughout the mitral (Figure 5A) and glomerular layer (Figure 5A) of the olfactory bulb, which was consistent with the expression of MCHR1 mRNA in the mouse (Kokkotou et al., 2001) but not the rat brain (Saito et al., 2001).
Figure 5. MCHR1 expression in the olfactory bulb, neocortex, amygdala, and caudate putamen of the Mchr1-cre/tdTomato mouse brain.

Photomicrographs illustrating the distribution of native tdTomato fluorescence in the A, olfactory bulb; B, somatosensory cortex; C, amygdala; D, caudate putamen. I, Layer I of somatosensory cortex (S1); II/III, Layers II/IIII of S1, IV, Layer IV of S1; V, Layer V of S1; VI, Layer VI of S1; AOB, accessory olfactory bulb; BLA, basolateral amygdaloid nucleus, anterior part; BMA, basomedial amygdaloid nucleus, anterior part; BSTIA, bed nucleus of the stria terminalis, intraamygaloid division; cc, corpus callosum; Ce, central amygdaloid nucleus; CPu, caudate putamen; EPl, external plexiform layer of the olfactory bulb; Gl, glomerular layer of the olfactory bulb; GrA, granular cell layer of the accessory olfactory bulb; IG, indusium griseum; La, lateral amygdaloid nucleus; LV, lateral ventricle; Mi, mitral cell layer of the olfactory bulb; MiA, mitral cell layer of the accessory olfactory bulb; Pir, piriform cortex. Scale bar, 200 μm; 50μm in inset.
Cerebral cortex
Overall, DsRed-F in the cortex was densest within the somatosensory and motor cortex. Throughout the cortex, labeling was most prominent in layers II/III and V but tapering off in layers IV and VI (Figure 5B). The frontal accessory cortical areas at the level of the olfactory nucleus were moderately labeled throughout.
Amygdala
Only low to moderate cell densities were observed in the amygdala. Within the amygdala, little or no cells were observed within the basolateral or lateral amygdala, but few cells are seen in the central amygdala and basomedial amygdala (Figure 5C).
Striatum
The distribution of DsRed-F was more prominent in the ventral than dorsal striatum. The highest density of labeling was observed in the accumbens nucleus shell, which was most intense at the rostral extent, tapering off only slightly towards the caudal striatum (Figure 6A). The density of cell bodies in the caudate putamen (Figure 5D) and accumbens nucleus core (Figure 6B) was less than that seen in the accumbens nucleus shell (Figure 6C). In adjacent areas, dense labeling of the islands of Calleja was also observed (Figure 6A).
Figure 6. MCHR1 expression in the striatum, hippocampus, septum, and thalamus of the Mchr1-cre/tdTomato mouse brain.

Photomicrographs illustrating the distribution of native tdTomato fluorescence in the A–C, striatum; D–F, hippocampus; G, septal nucleus; H, thalamus. High magnification photomicrographs of the outlined striatal regions (A) show higher density of MCHR1 neurons in the accumbens nucleus shell (C) than core (B). High magnification photomicrographs of the outlined hippocampal regions (D) show higher density of MCHR1 neurons in the dentate gyrus (E) than field CA1 (F). ac, anterior commissure; AcbC, accumbens nucleus core; AcbSh, accumbens nucleus shell; CA1, field CA1 of hippocampus; CA2, field CA2 of hippocampus; CA3, field CA3 of hippocampus; CM, central medial thalamic nucleus; CPu, caudate puramen; DG, dentate gyrus; gcc, genu corpus callosum; ICjM, major islands of Calleja; IG, indusium griseum; LHbM, lateral habenular nucleus, medial part; LSD, lateral septal nucleus, dorsal part; LSI, lateral septal nucleus, intermediate part; LV, lateral ventricle; MDL, mediodorsal thalamic nucleus; MHb, medial habenular nucleus; MS, medial septal nucleus; SHi, septohippocampal nucleus. Scale bar, 200 μm; 25 μm in inset.
Hippocampus and septum
In the hippocampal formation, very dense labeling of DsRed-F neurons was observed in the pyramidal cell layer (Figure 6D) that was most prominent in the dentate gyrus (Figure 6E) and area CA2/CA3 while relatively less staining was observed in area CA1 (Figure 6F). Very dense labeling was also observed at the indusium griseum (Figure 5D) and septohippocampal nucleus (Figure 6G). DsRed-F cells were evenly distributed at low density throughout the lateral septal nucleus but no cells were seen in the medial septum (Figure 6G).
Thalamus and hypothalamus
Low or no labeling was observed within the thalamus (Figure 6H). The density of DsRed-F cells varied among hypothalamic regions. Anterior to the hypothalamus, low to moderate density of labeling was observed in the medial preoptic area (Figure 7A–B) but few or no cells were seen in the medial preoptic nucleus (Figure 7B). Within the medial preoptic area, DsRed-F cells were seen mostly in the ventral subdivision and periventricular to the third ventricle. Moderate densities of cells were observed in the supraoptic nucleus (Figure 7C) and the suprachiasmatic nucleus (Figure 7C–D).
Figure 7. MCHR1 expression in hypothalamic regions of the Mchr1-cre/tdTomato mouse brain.

Photomicrographs illustrating the distribution of native tdTomato fluorescence in the A, anterior medial preoptic area and basal forebrain; B, medial preoptic regions; C, supraoptic nucleus, suprachiasmatic nucleus, anterior paraventricular nucleus; D, subdivisions of the suprachiasmatic nucleus; E, dorsomedial hypothalamus, perifornical and ventral subfornical region of the lateral hypothalamus, ventromedial hypothalamus, arcuate nucleus; F, zona incerta and perifornical region of the lateral hypothalamus. 3V, third ventricle; DMH, dorsomedial nucleus of hypothalamus; f, fornix; ic, internal capsule; LHAsf, ventral subfornical lateral hypothalamic area; MPA, medial preoptic area; MPO, medial preoptic nucleus; MnPO, median preoptic nucleus; mt, mammillothalamic tract; opt, optic tract; ox, optic chiasm; PeF, perifornical nucleus; PVH, paraventricular nucleus of hypothalamus; SCh, suprachiasmatic nucleus; SChDM, suprachiasmatic nucleus, dorsomedial part; SChVL, suprachiasmatic nucleus, ventrolateral part; SO, supraoptic nucleus; VMH, ventromedial nucleus of hypothalamus; VMPO, ventromedial preoptic area; VOLT, vascular organ of the lamina terminalis; ZI, zona incerta. Scale bar, 100μm; 50 μm in inset.
Within the hypothalamus, the highest density of DsRed-F labeling was seen in the ARC (Figure 7E) and VMH (Figure 7E). DsRed-F labeling in the ARC was strongest in the ventromedial regions, tapering off towards the lateral ARC. The central subdivision of the VMH contained relatively more labeled cells than the dorsomedial and ventrolateral part. Moderate labeling was seen in the PVH (Figure 7C) and DMH (Figure 7E). Within the PVH, the distribution of DsRed-F was relatively more abundant in the anterior parvocellular and magnocellular part then tapering off in the posterior PVH. Labeling within the LH will be discussed in two subregions: the perifornical hypothalamic area (PeF) surrounding the fornix, as outlined by Paxinos and Franklin (2001); and the ventral subfornical region (LHAsf), as outlined by Hahn and Swanson (2010). Here, the LHAsf refers to the LH region ventral to the fornix that lies along the lateral edge of the hypothalamus, parallel to the anterior region of the tuberal nucleus (Figure 7F). Low density labeling was consistently observed along the LHAsf (Figure 7E) but only few DsRed-F cells were seen in the PeF (Figure 7F) or zona incerta (ZI) (Figure 7F).
Midbrain and hindbrain
DsRed-F was less prominent in the midbrain and hindbrain, so that areas with positively labeled cells occurred at low densities only. Midbrain regions containing DsRed-F cells include the mammillary nucleus (Figure 8A) and interpeduncular nucleus (Figure 8B). Low to moderate density of DsRed-F cells was observed in the superior and inferior colliculi (Figure 8C–D), respectively. Low or no labeling was observed in the pons and tegmentum (Figure 9A).
Figure 8. MCHR1 expression in the midbrain of the Mchr1-cre/tdTomato mouse brain.

Photomicrographs illustrating the distribution of native tdTomato fluorescence in the A, mammilary nucleus; B, interpeduncular nucleus; C, superior colliculus; D, inferior colliculus. Photomicrographs also demonstrate the absence of fluorescently labeled cells in the substantia nigra (A–B), ventral tegmental area (A–B), interfascicular nucleus (A), red nucleus (B), and periaqueductal gray (C–D). Aq, aqueduct; CIC, central nucleus of the inferior colliculus; cp, cerebral peduncle; DCIC, dorsal cortex of the inferior colliculus; DpG, deep gray layer of the superior colliculus; ECIC, external cortex of the inferior colliculus; fr, fasciculus retroflexus; IF, interfascicular nucleus; InG, intermediate gray layer of the superior colliculus; IPC, interpeducular nucleus, caudal subnucleus; IPL, interpeduncular nucleus, lateral subnucleus; IPR, interpeduncular nucleus, rostral subnucleus; ml, medial lemniscus; MM, medial mammilary nucleus, medial part; PAG, periaqueductal gray; pm, principal mammillary tract; RMC, red nucleus, magnocellular part; SNC, substantia nigra, compact part; SNR, substantia nigra, reticular part; SuG, superficial gray layer of the superior colliculus; SuM supramammilary nucleus; VTA, ventral tegmental area. Scale bar, 200 μm.
Figure 9. MCHR1 expression in the hindbrain and cerebellum of the Mchr1-cre/tdTomato mouse brain.

Photomicrographs illustrating the distribution of native tdTomato fluorescence in the A, locus coeruleus and tegmental nucleus; B, area postrema and nucleus of the solitary tract; C, spinal trigeminal nucleus; D, Purkinje cells along the cerebellar lobules. Photomicrographs demonstrate the absence of fluorescently labeled cells in the locus coeruleus, subcoeruleus nucleus, and tegmentum (A). 2–3, cerebellar lobules; 10N, dorsal motor nucleus of vagus; 12N, hypoglossal nucleus; AP, area postrema; CC, central canal; DMTg, dorsomedial tegmental area; DTgC, dorsal tegmental nucleus, central part; LC, locus coeruleus; LDT, laterodorsal tegmental nucleus; mlf, medial longitudinal fasciculus; PnR, pontine raphe nucleus; Sol, nucleus of the solitary tract; Sp5I, spinal trigeminal nucleus, interpolar part; SubCD, subcoeruleus nucleus, dorsal part. Scale bar, 200 μm.
In the hindbrain, low density DsRed-F labeling was seen throughout the area postrema and nucleus of the solitary tract (Figure 9B). Low to moderate DsRed-F labeling was present in the spinal trigeminal nucleus (Figure 9C).
Cerebellum
A moderate density of DsRed-F Purkinje cells was observed throughout the cerebellar lobules (Figure 9D). However, not all Purkinje cells were labeled.
Characterization of MCHR1-expressing neurons in the hypothalamus
To examine the possible contribution of MCH to the regulation of hypothalamic neurons that play a role in energy balance, we assessed MCHR1 expression in the hypothalamus by quantifying the number of cells that coexpressed native tdTomato fluorescence with different hypothalamic neuropeptide markers. Hypothalamic markers were detected with AlexaFluor-488 (green) so that neurons coexpressing tdTomato (red) fluorescence appeared yellow. The coexpression of MCHR1 neurons summarized in Table 3 is represented as the ratio of colocalized neurons to the total number of marker-IR neurons.
Table 3.
Coexpression of MCHR1 and hypothalamic markers.
| Region | Marker | Total cell count1 | 4 Percent (%) | |
|---|---|---|---|---|
| Marker2 | Colocalized3 (with tdTomato) |
Colocalized Total Marker |
||
| PVH | Dynorphin-A | 27 ± 6 | 8 ± 2 | 28 ± 1 |
| Met-Enkephalin | 26 ± 3 | 9 ± 4 | 32 ± 11 | |
| Corticotropin-releasing factor | 52 ± 10 | 13±4 | 26 ± 3 | |
| Thyrotropin-releasing hormone | 98 ± 7 | 10±1 | 10 ± 3 | |
| Arg-Vasopressin | 73 ± 7 | 14 ± 3 | 19 ± 2 | |
| Oxytocin | 127±19 | 4 ± 3 | 4 ± 2 | |
| LH | Melanin-concentrating hormone | 211 ±34 | 1 ± 1 | 0 ± 0 |
| Orexin-B | 107 ± 36 | 0 ± 0 | 0 ± 0 | |
| Neurotensin | 61 ±22 | 8 ± 4 | 13±2 | |
| ARC | Neuropeptide Y | 225 ±23 | 55 ± 11 | 24 ± 2 |
| Proopiomelanocortin | 70 ± 14 | 35±2 | 43±2 | |
All staining were performed in brains from Mchr1-cre/tdTomato mice except for studies using Neuropeptide Y and proopiomelanocortin, which were performed in brains of Npy-hrGFP; Mchr1-cre/tdTomato and Pomc-hrGFP; Mchr1-cre/tdTomato mice, respectively.
Cell counts were corrected by the Abercrombie equation for double-counting (mean ± SEM).
Hypothalamic markers in the paraventricular nucleus (PVH), and lateral hypothalamic area (LH) were labeled with green fluorescence from AlexaFluor-488 and markers for the arcuate nucleus (ARC) were detected by native humanized, renilla green fluorescence.
Quantitation of MCHR1-expressing neurons that coexpress tdTomato and green fluorescence.
The proportion of MCHR1 neurons that express the indicated marker was determined as the percentage of colocalized cells over the total number of marker-positive neurons.
Paraventricular nucleus (PVH)
We assessed tdTomato fluorescence in opioid, parvocellular, or magnocellular neurons in the PVH by staining for immunoreactivity against Dyn, ENK, CRF, TRH, OT, or AVP (Table 3). Colocalization with tdTomato was indicated in: 30% of opioid PVH neurons, as marked by Dyn-IR (Figure 10A–C) or ENK-IR (Figure 10D–F); and 26% of CRF-IR (Figure 11A–C) and 10% of TRH-IR (Figure 11D–F) parvocellular neuroendocrine neurons. By contrast, tdTomato fluorescence was less abundant in magnocellular PVH neurons, colocalizing with only 20% of AVP (Figure 11G–I) and less than 5% of all OT PVH neurons (Figure 11J–L).
Figure 10. Characterization of MCHR1-expressing neurons in opioidergic neurons within the paraventricular nucleus of the hypothalamus.

Representative photomicrographs of two-color confocal images showing that a subpopulation of tdTomato fluorescent neurons in the paraventricular nucleus express immunoreactivity for A–C, dynorphin-A; D–F, enkephalin. Singly-labeled neurons appear either red or green while coexpression (arrowhead) is indicated by cells appearing yellow due to color overlay in the merged image (C, F). All stainings were performed in Mchr1-cre/tdTomato mouse brains. Inset within merged image panels C, F indicate the relative position of the hypothalamic region imaged. Only a representative sample of coexpressing cells from each panel was marked. Scale bar, 50 μm. Corresponding magenta-green images are provided in Supplemental 1.
Figure 11. Characterization of MCHR1-expressing parvocellular and magnocellular neurons in the paraventricular nucleus of the hypothalamus.

Representative photomicrographs of two-color confocal images showing that a subpopulation of tdTomato fluorescent neurons in the paraventricular nucleus express immunoreactivity for A–C, corticotropin-releasing factor; D–F, thyrothropin-releasing hormone; G–I, Arg-vasopressin; J–L, oxytocin. Singly-labeled neurons appear either red or green while coexpression (arrowhead) is indicated by cells appearing yellow due to color overlay in the merged image (C, F, I, L). All stainings were performed in Mchr1-cre/tdTomato mouse brains. Inset within merged image panels C, F, I, L indicate the relative position of the hypothalamic region imaged. Only a representative sample of coexpressing cells from each panel was marked. Scale bar, 50 μm. Corresponding magenta-green images are provided in Supplemental 2.
Lateral hypothalamic area (LH)
Neurons in the LH were characterized by immunoreactivity to ORX, MCH, and NT. ORX and MCH neurons were distributed in the PeF and dorsomedial LH areas but these regions displayed low densities of tdTomato neurons. Interestingly, none of the ORX neurons and only two of all MCH neurons (0.5%) counted coexpressed tdTomato fluorescence (Table 3). By contrast, tdTomato fluorescent neurons were observed in the ventral LHAsf (Figure 7E), of which a subpopulation coexpressed NT and represent 13% of NT-IR neurons (Figure 12A–C).
Figure 12. Characterization of MCHR1-expressing neurons in the lateral hypothalamus and arcuate nucleus of the hypothalamus.

Representative photomicrographs of two-color confocal images showing that a subpopulation of tdTomato fluorescent neurons express immunoreactivity for A–C, neurotensin in the ventral subfornical region of the lateral hypothalamus; D–F, phospho-STAT3 in the arcuate nucleus. Singly-labeled neurons appear either red or green while coexpression (arrowhead) is indicated by cells appearing yellow due to color overlay in the merged image (C, F). All stainings were performed in Mchr1-cre/tdTomato mouse brains. Inset within merged image panels C, F indicate the relative position of the hypothalamic region imaged. Only a representative sample of coexpressing cells from each panel was marked. Scale bar, 50 μm. Corresponding magenta-green images are provided in Supplemental 3.
Arcuate nucleus (ARC)
Dense expression of tdTomato was seen throughout the ARC. Two populations of ARC neurons play crucial roles in energy balance, the orexigenic Neuropeptide Y (NPY) and anorexigenic proopiomelanocortin (POMC) neurons. Thus the ARC is a potentially important target of MCH. We evaluated MCHR1 expression in NPY or POMC neurons by separately crossing Npy-hrGFP (van den Pol et al., 2009) and Pomc-hrGFP (Parton et al., 2007) transgenic mice with our Mchr1-cre/tdTomato mice to obtain the Npy-hrGFP; Mchr1-cre/tdTomato and Pomc-hrGFP; Mchr1-cre/tdTomato mouse, respectively. Fluorescence from humanized, renilla green fluorescent protein (hrGFP) persists following IHC treatment, thus NPY and POMC neurons were detected by the native fluorescence of hrGFP. Coexpression of tdTomato and hrGFP was observed in 24% of hrGFP positive cells from Npy-hrGFP; Mchr1-cre/tdTomato brains and 43% of hrGFP positive cells from Pomc-hrGFP; Mchr1-cre/tdTomato brains (Table 3).
Characterization of leptin-responsive MCHR1 neurons in the ARC
As MCH expression is high in the leptin-deficient ob/ob mice (Qu et al., 1996) and deletion of MCH in ob/ob mice attenuated their obesity (Segal-Lieberman et al., 2003), it suggested an interaction between the MCH and leptin system is important for energy balance. Leptin directly targets the ARC (Coppari et al., 2005), thus predisposing MCHR1-containing ARC cells to be leptin-responsive. Indeed, leptin-responsive neurons were identified by demonstrating the induction of phosphorylated STAT3 (Münzberg et al., 2003) in the ARC of Npy-hrGFP; Mchr1-cre/tdTomato and Pomc-hrGFP; Mchr1-cre/tdTomato mice. NPY or POMC, MCHR1, and pSTAT3-IR neurons were indicated by hrGFP, tdTomato, and DyLight-649 fluorescence, respectively.
The pattern of pSTAT3 expression in both these doubly-fluorescent mice was comparable to that in Mchr1-cre/tdTomato mice (Figure 12D–F). Consistently, about one-third of leptin-treated ARC neurons demonstrating pSTAT3-IR from Npy-hrGFP; Mchr1-cre/tdTomato (37%) and Pomc-hrGFP; Mchr1-cre/tdTomato (31%) expressed MCHR1. We then determined MCHR1 expression in either NPY or POMC neurons (Table 4). Interestingly, MCHR1 was coexpressed in 35% of leptin-responsive NPY neurons (Figure 13A–D) but in more than 70% of leptin-responsive POMC cells (Figure 13E–H).
Table 4.
Coexpression of MCHR1 with leptin-sensitive NPY or POMC arcuate neurons.
| Mouse | Total cell count3 | 5 Percent (%) | |
|---|---|---|---|
| pSTAT3 +NPY/POMC | MCHR1 +pSTAT3 +NPY/POMC (Triple4) |
Triple pSTAT3+NPY/POMC |
|
| Npy-hrGFP; Mchr1 -cre/tdTomato1 | 76 ± 10 | 25 ± 3 | 35 ± 9 |
| Pomc-hrGFP; Mchr1 -cre/tdTomato2 | 17 ± 5 | 12 ± 4 | 71 ± 1 |
Quantitation of MCHR1-expressing neurons that were leptin-sensitive, identified as phospho-STAT3- immunoreactive cells (pSTAT3-IR), Neuropeptide Y (NPY) or proopiomelanocortin (POMC) neurons in the arcuate nucleus. Cell counts were corrected by the Abercrombie equation for double-counting (mean ± SEM).
ARC NPY neurons were identified from the brains of Npy-hrGFP; Mchr1-cre/tdTomato mice.
ARC POMC neurons were identified from the brains of Pomc-hrGFP; Mchr1-cre/tdTomato mice.
pSTAT3-positive neurons were labeled with DyLight 649 fluorophore and coded with cyan. Labeling of NPY or POMC neurons were determined by humanized, renilla green fluorescence and coded in green. Labeling of MCHR1 neurons were determined by tdTomato fluorescence and coded in red.
”Triple” refers to triply labeled cells for MCHR1, pSTAT3, and NPY or POMC.
This ratio describes the percentage of leptin-sensitive NPY or POMC neurons that coexpress MCHR1.
Figure 13. Characterization of leptin-sensitive MCHR1-expressing neurons in the arcuate nucleus of the hypothalamus.

Photomicrographs of three-color confocal images showing coexpression of arcuate tdTomato fluorescence (red; A, E), phoshpo-STAT3 (cyan; B, F) and humanized, renilla green fluorescent protein (hrGFP) (green; C, G) with A–D, Neuropeptide Y neurons from the Npy-hrGFP; Mchr1-cre/tdTomato mouse brain; E–H, proopiomelanocortin neurons from the Pomc-hrGFP; Mchr1-cre/tdTomato mouse brain. Triple labeled neurons (arrowhead) appear white due to color overlay in the merged image (D, H). Scale bar, 50 μm. Corresponding magenta-green-cyan images are provided in Supplemental 4.
DISCUSSION
MCH is one of several hypothalamic neuropeptides that regulate energy balance. The role of MCH was demonstrated by pharmacologic and genetic studies and highlights the importance of this system. However understanding of the MCH system has lagged behind the understanding of other systems, in part because there are few reagents available to study downstream target neurons. Antibodies against the MCH receptor are not available despite efforts by both individual investigators and commercial companies to produce them. Consequently, studies of MCH target neurons have been limited to analysis of MCHR1 mRNA distribution (Saito et al., 2001; Kokkotou et al., 2001). To this date, remarkably little is known about the specific characteristics of MCHR1 neurons, including its regulation by energy balance related factors, its coexpression with other neurotransmitters, or analysis of their electrophysiological profile. In order to enable a detailed analysis of this neuronal population, we generated a mouse model where MCHR1 neurons were identified by the expression of a fluorescent protein dependent on cre recombinase expression – a method that has been successfully implemented to identify unique populations in many other neuropeptide or receptor systems (e.g. Pomc-cre/Z/EG mouse (Balthasar et al., 2004); Sf1-cre/lox-GFP mouse (Dhillon et al., 2006); Leprcre/+;ROSAEGFP mouse (Leshan et al., 2009); Orexin-cre/ROSA-eGFP (Matsuki et al., 2009); Mch-cre/lox-tdTomato (Kong et al., 2010)). We generated the Mchr1-cre mouse that expresses cre recombinase by activation of the MCHR1 promoter, thereby limiting cre expression to cells that express MCHR1 at some point during development. By crossing the Mchr1-cre mouse with one that contains a floxed allele for tdTomato fluorescent peptide, we generated the Mchr1-cre/tdTomato mouse; thus MCHR1-expressing neurons can be readily detected by tdTomato fluorescence, a rapid and sensitive method of visualization (Madisen et al., 2010). Here we present the results obtained from this novel mouse model that allowed us to perform a detailed anatomical distribution of MCHR1 neurons. In addition to mapping MCHR1 neurons, we also characterized the neuropeptide expression of these neurons in the hypothalamus, an area critical to the regulation of energy balance.
Distribution of tdTomato fluorescence in Mchr1-cre/tdTomato mouse brains
Overall, the distribution pattern of tdTomato fluorescence correlated with previous reports showing the distribution of MCHR1 gene expression in the mouse (Kokkotou et al., 2001; Pissios et al., 2008; Guesdon et al., 2010) and rat brain (Chambers et al., 1999; Hervieu et al., 2000; Saito et al., 2001). The major differences observed between the expression pattern of tdTomato fluorescence compared to MCHR1 mRNA were within the cerebellum and the dentate gyrus of the hippocampal formation where tdTomato fluorescence (and DsRed-IR) was observed in the Purkinje cells and dentate granule cells, respectively; however these regions were devoid of MCHR1 mRNA hybridization signals. The discrepancy may result from the fact that in transgenic reporter mice, activation of the cre gene during development leads to persistent expression throughout life. Thus positive tdTomato fluorescence would reflect this early expression even if MCHR1 was no longer expressed in adult mice, as was the case for cre-activated NPY reporter expression (Padilla et al., 2010). In addition, true ectopic expression of cre recombinase must also be considered (Balthasar et al., 2004; Dhillon et al., 2006).
We also found a difference in signal density between tdTomato fluorescence and endogenous MCHR1 expression in regions such as the DMH and VMH of the hypothalamus. Hybridization signals at the VMH were weak but a high density of tdTomato fluorescent neurons was observed. This contrast may be attributed to the sensitivity difference in detection methods using tdTomato fluorescence versus ISH. The tdTomato reporter is highly sensitive to even low levels of cre recombinase (Madisen et al., 2010), thus regions expressing low MCHR1 mRNA levels may not yield distinct, specific hybridization signals, but may be sufficient to produce cre recombinase and subsequent tdTomato reporter expression. Since the intensity of tdTomato fluorescence does not reflect the level of MCHR1 expression, but rather is an all-or-none indicator of gene expression, robust tdTomato fluorescence may be easily detectable even in neurons expressing MCHR1 at very low levels. In addition, cre expression may have occurred during the development of the hypothalamus, thus inducing lifelong expression of tdTomato that may not reflect MCHR1 expression in the adult. Since the combined DsRed IHC and MCHR1 ISH did not reveal individual colocalized neurons, we cannot exclude the possibility of ectopic cre recombinase expression in the DMH and VMH. These DsRed-positive neurons were excluded from further analysis.
Characterization of MCHR1-expressing neurons in the hypothalamus
The hypothalamus is integral for the central regulation of energy homeostasis and several hypothalamic nuclei are implicated in the orexigenic effect of MCH (Abbott et al., 2003), thus we focused on the profile of MCHR1-expressing neurons in the hypothalamus. The distribution pattern of tdTomato fluorescence in the hypothalamus was consistent with previous reports of hypothalamic MCHR1 mRNA expression. We found that MCHR1 neurons in the hypothalamus represent a heterogeneous population of neurons in discrete hypothalamic nuclei that coexpress several other neuropeptides implicated in energy homeostasis. The coexpression of tdTomato fluorescence with these markers further supports the role for MCH in energy balance and implicates the convergence of MCH with other neuropeptide systems to regulate energy balance. It is important to note that since high dose colchicine treatment is necessary for cell body staining of neuropeptides, especially Dyn, NT, ENK, TRH, and CRF, the actual proportion of these neurons that express MCHR1 may be greater.
MCH has been reported to elicit a rapid increase in feeding when injected directly into the rat PVH, and some of the orexigenic effect of MCH may be mediated by PVH circuitry (Abbott et al., 2003). Consistent with this, MCHR1 expression was found throughout the PVH, with the greatest expression in the parvocellular region, which includes a population of CRF-, TRH-, Dyn-, or ENK-expressing PVH neurons. Magnocellular MCHR1 neurons were also observed but in less abundance. In addition to feeding, MCH can also stimulate water (Clegg et al., 2003; Morens et al., 2005) and ethanol intake (Morganstern et al., 2010). AVP PVH neurons are integral for maintaining fluid homeostasis and are stimulated when the body is dehydrated (Trudel and Bourque, 2012), thus represent a likely target for MCH-mediated water intake. The MCH response during ethanol consumption is also mediated in part by PVH neurons (Morganstern et al., 2010) and is consistent with the finding that some opioid PVH neurons implicated during ethanol consumption (Karatayev et al., 2010) are shown here to coexpress MCHR1.
MCH neurons are localized in the LH and ZI and dense MCH projections are reported within the LH (Bittencourt et al., 1992; Tritos et al., 2001; Swanson et al., 2005; Pissios et al., 2006; Croizier et al., 2010). However, very few MCHR1 neurons were observed in the PeF or dorsal regions of the LH, including MCH and ORX LH neurons, and there was only very low density of neurons in the ZI. Rat MCH terminals have been shown to innervate both MCH and ORX neurons (Guan et al., 2002), but this does not confirm the expression of MCHR1 at those sites since other neurotransmitters like GABA and cocaine- and amphetamine-regulated transcript (CART) are known to be coexpressed with MCH (Harthoorn et al., 2005; Croizier et al., 2010). Electrophysiological recordings from cultured rat MCH neurons suggested that MCHR1 are autoreceptors (Gao et al., 2003), but similar findings were not reported in acute mouse or rat brain slices. With regards to ORX neurons, MCH did not directly alter their firing activity but inhibited their glutamatergic inputs presynaptically (Rao et al., 2008). However, the identity of the presynaptic MCHR1-expressing cell was not identified. Since the expression and projection of MCH neurons are different between the rat and mouse (Croizier et al., 2010), it is important to consider possible differences in MCHR1 distribution and density of expression between the two species. Our study using the Mchr1-cre/tdTomato mouse does not exclude the expression of MCHR1 at MCH or ORX neurons, which may occur at a relatively low frequency (Guan et al., 2002). Additionally, it is also possible that cre is not expressed in these cells.
In addition to MCH and ORX, we characterized MCHR1 expression against a distinct population of NT neurons in the LH. It has been suggested that some NT neurons in this region also receive inputs from leptin (Leinninger et al., 2011), thus indicating the potential role for NT MCHR1 neurons in energy balance regulation.
The ARC is a critical area mediating energy homeostasis (Cone et al., 2001; Elmquist et al., 2005). Peripheral and central energy balance signals converge and integrate metabolic signals on ARC neurons, which propagate these signals to other regions of the hypothalamus through dense projections. Two well-characterized ARC neuronal populations are the NPY and POMC cells, which produce antagonistic effects on food intake. Interestingly, while both cell types express MCHR1, a substantially greater proportion of POMC than NPY neurons express MCHR1. The LH receives strong projections from leptin-sensitive NPY and POMC neurons (Elias et al., 1999) and the LH MCH neurons are specifically innervated by NPY and POMC ARC neurons (Elias et al., 1998; Elias et al., 1999). Since a significant proportion of these ARC neurons also express MCHR1, it is reasonable to speculate upon a reciprocal connection between LH MCH neurons and ARC MCHR1 neurons. Furthermore, MCH can increase the activity of neurons within the medial ARC where NPY-expressing cells are most dense (Davidowa et al., 2002). Thus reciprocal innervations between LH MCH and ARC NPY neurons may constitute a positive feedback loop to reinforce the orexigenic actions of both NPY and MCH.
Characterization of leptin-sensitive MCHR1-expressing neurons in the ARC
Leptin, a hormone produced by adipose tissue that informs the brain about the state of peripheral energy stores (Ahima et al., 1996; Badman and Flier, 2007) is critical for normal energy homeostasis. Studies in obese, leptin-deficient ob/ob mice demonstrated an overexpression of MCH gene expression (Qu et al., 1996) while the ob/ob obesity is attenuated in the double null mouse lacking both MCH and leptin (Segal-Lieberman et al., 2003). These studies implicated MCH signaling as an essential component of central circuits affected by leptin. Leptin signals are integrated primarily in the ARC and an intact ARC is necessary for the anorectic actions of leptin (Takeda et al., 2002). We examined the possibility that and the orexigenic actions of MCH converge on leptin-sensitive NPY or POMC neurons in the ARC. MCHR1 was expressed in at least one-third of leptin-sensitive ARC neurons. This includes more than 70% of leptin-sensitive POMC neurons, thereby implicating their role for the orexigenic actions of MCH. The anorectic actions of leptin are mediated partly by the excitation of ARC POMC neurons and are necessary for normal energy balance regulation (Cowley et al., 2001; Balthasar et al., 2004; Xu et al.,, 2007; Hill et al., 2008; van de Wall et al., 2008; Qiu et al., 2010). MCH is an inhibitory neuropeptide (Gao et al., 2001; Gao et al., 2002; Sears et al., 2010), thus it may inhibit POMC signaling as part of the neuronal circuitry underlying its orexigenic actions.
Extrahypothalamic expression of MCHR1
It is important to note that MCHR1 is also expressed in extrahypothalamic sites, most notably within the olfactory regions, striatum, hippocampus, and throughout the cortex. The expression of MCHR1 in the olfactory regions is consistent with the integrative role of MCH in the olfactory system (Adams et al., 2011). The expression of MCHR1 especially in the accumbens nucleus of the striatum potentially has significant implications for reward and motivational aspects of feeding behavior (Georgescu et al., 2005; Smith et al., 2005; Pissios et al., 2008). It has already been shown that dopamine and glutamatergic signaling within the accumbens nucleus is an important aspect of MCH action in this region (Pissios et al., 2006; Sears et al., 2010). Our Mchr1-cre/tdTomato model thus enables subsequent exploration of other neuropeptides and neurotransmitters underlying the action of MCH in the accumbens. Likewise, MCHR1 is expressed in the cortical areas and hippocampal formation, thus implicating its role in cognition (Pachoud et al., 2010). The potential function of MCH in much of these areas remains to be defined, but functionality can be addressed utilizing the Mchr1-cre mouse in combination with further immunohistochemical, electrophysiological, or behavioral studies.
Supplementary Material
Acknowledgments
The authors acknowledge Dr. C. B. Saper for critical comments during the preparation of this manuscript and Drs. R. H. Williams and G. Wittmann for technical assistance in histology procedures. The authors gratefully acknowledge the following researchers for providing research materials: Drs. C. Fekete and G. Wittmann for the TRH antibody and staining procedure; Dr. B. B. Lowell for the tdTomato reporter mouse, Npy-hrGFP, and Pomc-hrGFP transgenic mouse.
ROLE OF AUTHORS
All authors had full access to all the data in the study and take responsibility for the integrity of the data and the accuracy of the data analysis. Study concept and design: MJSC, EMF. Acquisition of data: MJSC. Analysis and interpretation of data: MJSC, EMF. Drafting of the manuscript: MJSC. Critical revision of the manuscript for important intellectual content: MJSC, PP, EMF. Statistical analysis: MJSC. Obtained funding: EMF. Administrative, technical, and material support: MJSC, PP, EMF. Study supervision: MJSC, PP, EMF.
Footnotes
This study was supported by NIH grant 5R01DK069983-02 to EMF.
CONFLICT OF INTEREST STATEMENT
The authors have no known or potential conflict of interest to disclose.
LITERATURE CITED
- Abbott CR, Kennedy AR, Wren AM, Rossi M, Murphy KG, Seal LJ, Todd JF, Ghatei MA, Small CJ, Bloom SR. Identification of hypothalamic nuclei involved in the orexigenic effect of melanin-concentrating hormone. Endocrinology. 2003;144:3943–3949. doi: 10.1210/en.2003-0149. [DOI] [PubMed] [Google Scholar]
- Adams AC, Domouzoglou EM, Chee MJ, Segal-Liebermann G, Pissios P, Maratos-Flier E. Ablation of the hypothalamic neuropeptide melanin concentrating hormone is associated with behavioral abnormalities that reflect impaired olfactory integration. Behav Brain Res. 2011;224:195–200. doi: 10.1016/j.bbr.2011.05.039. [DOI] [PMC free article] [PubMed] [Google Scholar]
- Ahima RS, Prabakaran D, Mantzoros C, Qu D, Lowell B, Maratos-Flier E, Flier JS. Role of leptin in the neuroendocrine response to fasting. Nature. 1996;382:250–252. doi: 10.1038/382250a0. [DOI] [PubMed] [Google Scholar]
- Alon T, Friedman JM. Late-onset leanness in mice with targeted ablation of melanin concentrating hormone neurons. J Neurosci. 2006;26:389–397. doi: 10.1523/JNEUROSCI.1203-05.2006. [DOI] [PMC free article] [PubMed] [Google Scholar]
- Alon T, Zhou L, Pérez CA, Garfield AS, Friedman JM, Heisler LK. Transgenic mice expressing green fluorescent protein under the control of the corticotropin-releasing hormone promoter. Endocrinology. 2009;150:5626–5632. doi: 10.1210/en.2009-0881. [DOI] [PMC free article] [PubMed] [Google Scholar]
- Badman MK, Flier JS. The adipocyte as an active participant in energy balance and metabolism. Gastroenterology. 2007;132:2103–2115. doi: 10.1053/j.gastro.2007.03.058. [DOI] [PubMed] [Google Scholar]
- Balthasar N, Coppari R, McMinn J, Liu SM, Lee CE, Tang V, Kenny CD, McGovern RA, Chua SC, Jr, Elmquist JK, Lowell BB. Leptin receptor signaling in POMC neurons is required for normal body weight homeostasis. Neuron. 2004;42:983–991. doi: 10.1016/j.neuron.2004.06.004. [DOI] [PubMed] [Google Scholar]
- Bamshad M, Novak MA, De Vries GJ. Sex and species differences in the vasopressin innervation of sexually naive and parental prairie voles, Microtus ochrogaster and meadow voles, Microtus pennsylvanicus. J Neuroendocrinol. 1993;5:247–255. doi: 10.1111/j.1365-2826.1993.tb00480.x. [DOI] [PubMed] [Google Scholar]
- Beaulieu J, Champagne D, Drolet G. Enkephalin innervation of the paraventricular nucleus of the hypothalamus: distribution of fibers and origins of input. J Chem Neuroanat. 1996;10:79–92. doi: 10.1016/0891-0618(95)00105-0. [DOI] [PubMed] [Google Scholar]
- Bittencourt JC, Presse F, Arias C, Peto C, Vaughan J, Nahon JL, Vale W, Sawchenko PE. The melanin-concentrating hormone system of the rat brain: an immuno- and hybridization histochemical characterization. J Comp Neurol. 1992;319:218–245. doi: 10.1002/cne.903190204. [DOI] [PubMed] [Google Scholar]
- Chambers J, Ames RS, Bergsma D, Muir A, Fitzgerald LR, Hervieu G, Dytko GM, Foley JJ, Martin J, Liu WS, Park J, Ellis C, Ganguly S, Konchar S, Cluderay J, Leslie R, Wilson S, Sarau HM. Melanin-concentrating hormone is the cognate ligand for the orphan G-protein-coupled receptor SLC-1. Nature. 1999;400:261–265. doi: 10.1038/22313. [DOI] [PubMed] [Google Scholar]
- Chen Y, Hu C, Hsu CK, Zhang Q, Bi C, Asnicar M, Hsiung HM, Fox N, Slieker LJ, Yang DD, Heiman ML, Shi Y. Targeted disruption of the melanin-concentrating hormone receptor-1 results in hyperphagia and resistance to diet-induced obesity. Endocrinology. 2002;143:2469–2477. doi: 10.1210/endo.143.7.8903. [DOI] [PubMed] [Google Scholar]
- Clegg DJ, Air EL, Benoit SC, Sakai RS, Seeley RJ, Woods SC. Intraventricular melanin-concentrating hormone stimulates water intake independent of food intake. Am J Physiol Regul Integr Comp Physiol. 2003;284:R494–R499. doi: 10.1152/ajpregu.00399.2002. [DOI] [PubMed] [Google Scholar]
- Cone RD, Cowley MA, Butler AA, Fan W, Marks DL, Low MJ. The arcuate nucleus as a conduit for diverse signals relevant to energy homeostasis. Int J Obes Relat Metab Disord. 2001;25(Suppl 5):S63–S67. doi: 10.1038/sj.ijo.0801913. [DOI] [PubMed] [Google Scholar]
- Coppari R, Ichinose M, Lee CE, Pullen AE, Kenny CD, McGovern RA, Tang V, Liu SM, Ludwig T, Chua SC, Jr, Lowell BB, Elmquist JK. The hypothalamic arcuate nucleus: a key site for mediating leptin’s effects on glucose homeostasis and locomotor activity. Cell Metab. 2005;1:63–72. doi: 10.1016/j.cmet.2004.12.004. [DOI] [PubMed] [Google Scholar]
- Cowley MA, Smart JL, Rubinstein M, Cerdán MG, Diano S, Horvath TL, Cone RD, Low MJ. Leptin activates anorexigenic POMC neurons through a neural network in the arcuate nucleus. Nature. 2001;411:480–484. doi: 10.1038/35078085. [DOI] [PubMed] [Google Scholar]
- Crocker A, España RA, Papadopoulou M, Saper CB, Faraco J, Sakurai T, Honda M, Mignot E, Scammell TE. Concomitant loss of dynorphin, NARP, and orexin in narcolepsy. Neurology. 2005;65:1184–1188. doi: 10.1212/01.wnl.0000168173.71940.ab. [DOI] [PMC free article] [PubMed] [Google Scholar]
- Croizier S, Franchi-Bernard G, Colard C, Poncet F, La Roche A, Risold PY. A comparative analysis shows morphofunctional differences between the rat and mouse melanin-concentrating hormone systems. PLoS One. 2010;5:e15471. doi: 10.1371/journal.pone.0015471. [DOI] [PMC free article] [PubMed] [Google Scholar]
- Davidowa H, Li Y, Plagemann A. Hypothalamic ventromedial and arcuate neurons of normal and postnatally overnourished rats differ in their responses to melanin-concentrating hormone. Regul Pept. 2002;108:103–111. doi: 10.1016/s0167-0115(02)00153-2. [DOI] [PubMed] [Google Scholar]
- Das M, Vihlen CS, Legradi G. Hypothalamic and brainstem sources of pituitary adenylate cyclase-activating polypeptide nerve fibers innervating the hypothalamic paraventricular nucleus in the rat. J Comp Neurol. 2007;500:761–776. doi: 10.1002/cne.21212. [DOI] [PMC free article] [PubMed] [Google Scholar]
- de Lecea L, Kilduff TS, Peyron C, Gao X, Foye PE, Danielson PE, Fukuhara C, Battenberg EL, Gautvik VT, Bartlett FS, 2nd, Frankel WN, van den Pol AN, Bloom FE, Gautvik KM, Sutcliffe JG. The hypocretins: hypothalamus-specific peptides with neuroexcitatory activity. Proc Natl Acad Sci USA. 1998;95:322–327. doi: 10.1073/pnas.95.1.322. [DOI] [PMC free article] [PubMed] [Google Scholar]
- Della-Zuana O, Presse F, Ortola C, Duhault J, Nahon JL, Levens N. Acute and chronic administration of melanin-concentrating hormone enhances food intake and body weight in Wistar and Sprague-Dawley rats. Int J Obes Relat Metab Disord. 2002;26:1289–1295. doi: 10.1038/sj.ijo.0802079. [DOI] [PubMed] [Google Scholar]
- Dhillon H, Zigman JM, Ye C, Lee CE, McGovern RA, Tang V, Kenny CD, Christiansen LM, White RD, Edelstein EA, Coppari R, Balthasar N, Cowley MA, Chua S, Jr, Elmquist JK, Lowell BB. Leptin directly activates SF1 neurons in the VMH, and this action by leptin is required for normal body-weight homeostasis. Neuron. 2006;49:191–203. doi: 10.1016/j.neuron.2005.12.021. [DOI] [PubMed] [Google Scholar]
- Dohanics J, Hoffman GE, Verbalis JG. Chronic hyponatremia reduces survival of magnocellular vasopressin and oxytocin neurons after axonal injury. J Neurosci. 1996;16:2373–2380. doi: 10.1523/JNEUROSCI.16-07-02373.1996. [DOI] [PMC free article] [PubMed] [Google Scholar]
- Elias CF, Saper CB, Maratos-Flier E, Tritos NA, Lee C, Kelly J, Tatro JB, Hoffman GE, Ollmann MM, Barsh GS, Sakurai T, Yanagisawa M, Elmquist JK. Chemically defined projections linking the mediobasal hypothalamus and the lateral hypothalamic area. J Comp Neurol. 1998;402:442–459. [PubMed] [Google Scholar]
- Elias CF, Aschkenasi C, Lee C, Kelly J, Ahima RS, Bjorbaek C, Flier JS, Saper CB, Elmquist JK. Leptin differentially regulates NPY and POMC neurons projecting to the lateral hypothalamic area. Neuron. 1999;23:775–786. doi: 10.1016/s0896-6273(01)80035-0. [DOI] [PubMed] [Google Scholar]
- Elias CF, Sita LV, Zambon BK, Oliveira ER, Vasconcelos LA, Bittencourt JC. Melanin-concentrating hormone projections to areas involved in somatomotor responses. J Chem Neuroanat. 2008;35:188–201. doi: 10.1016/j.jchemneu.2007.10.002. [DOI] [PubMed] [Google Scholar]
- Elmquist JK, Coppari R, Balthasar N, Ichinose M, Lowell BB. Identifying hypothalamic pathways controlling food intake, body weight, and glucose homeostasis. J Comp Neurol. 2005;493:63–71. doi: 10.1002/cne.20786. [DOI] [PubMed] [Google Scholar]
- Foradori CD, Goodman RL, Lehman MN. Distribution of preprodynorphin mRNA and dynorphin-a immunoreactivity in the sheep preoptic area and hypothalamus. Neuroscience. 2005;130:409–418. doi: 10.1016/j.neuroscience.2004.08.051. [DOI] [PubMed] [Google Scholar]
- Gao XB, van den Pol AN. Melanin concentrating hormone depresses synaptic activity of glutamate and GABA neurons from rat lateral hypothalamus. J Physiol. 2001;533:237–252. doi: 10.1111/j.1469-7793.2001.0237b.x. [DOI] [PMC free article] [PubMed] [Google Scholar]
- Gao XB, van den Pol AN. Melanin-concentrating hormone depresses L-, N-, and P/Q-type voltage-dependent calcium channels in rat lateral hypothalamic neurons. J Physiol. 2002;542:273–286. doi: 10.1113/jphysiol.2002.019372. [DOI] [PMC free article] [PubMed] [Google Scholar]
- Gao XB, Ghosh PK, van den Pol AN. Neurons synthesizing melanin-concentrating hormone identified by selective reporter gene expression after transfection in vitro: transmitter responses. J Neurophysiol. 2003;90:3978–3985. doi: 10.1152/jn.00593.2003. [DOI] [PubMed] [Google Scholar]
- Georgescu D, Sears RM, Hommel JD, Barrot M, Bolaños CA, Marsh DJ, Bednarek MA, Bibb JA, Maratos-Flier E, Nestler EJ, DiLeone RJ. The hypothalamic neuropeptide melanin-concentrating hormone acts in the nucleus accumbens to modulate feeding behavior and forced-swim performance. J Neurosci. 2005;25:2933–2940. doi: 10.1523/JNEUROSCI.1714-04.2005. [DOI] [PMC free article] [PubMed] [Google Scholar]
- Gomori A, Ishihara A, Ito M, Mashiko S, Matsushita H, Yumoto M, Ito M, Tanaka T, Tokita S, Moriya M, Iwaasa H, Kanatani A. Chronic intracerebroventricular infusion of MCH causes obesity in mice. Am J Physiol. 2003;284:E583–E588. doi: 10.1152/ajpendo.00350.2002. [DOI] [PubMed] [Google Scholar]
- Gomori A, Ishihara A, Ito M, Matsushita H, Ito M, Mashiko S, Iwaasa H, Matsuda M, Bednarek MA, Qian S, Macneil DJ, Kanatani A. Blockade of MCH1 receptor signalling ameliorates obesity and related hepatic steatosis in ovariectomized mice. Br J Pharmacol. 2007;151:900–908. doi: 10.1038/sj.bjp.0707292. [DOI] [PMC free article] [PubMed] [Google Scholar]
- Griffin GD, Ferri-Kolwicz SL, Reyes BA, Van Bockstaele EJ, Flanagan-Cato LM. Ovarian hormone-induced reorganization of oxytocin-labeled dendrites and synapses lateral to the hypothalamic ventromedial nucleus in female rats. J Comp Neurol. 2010;518:4531–4545. doi: 10.1002/cne.22470. [DOI] [PMC free article] [PubMed] [Google Scholar]
- Guan JL, Uehara K, Lu S, Wang QP, Funahashi H, Sakurai T, Yanagizawa M, Shioda S. Reciprocal synaptic relationships between orexin- and melanin-concentrating hormone-containing neurons in the rat lateral hypothalamus: a novel circuit implicated in feeding regulation. Int J Obes Relat Metab Disord. 2002;26:1523–1532. doi: 10.1038/sj.ijo.0802155. [DOI] [PubMed] [Google Scholar]
- Guesdon B, Denis RG, Richard D. Additive effects of olanzapine and melanin-concentrating hormone agonism on energy balance. Behav Brain Res. 2010;207:14–20. doi: 10.1016/j.bbr.2009.09.032. [DOI] [PubMed] [Google Scholar]
- Hahn JD, Swanson LW. Distinct patterns of neuronal inputs and outputs of the juxtaparaventricular and suprafornical regions of the lateral hypothalamic area in the male rat. Brain Res Rev. 2010;64:14–103. doi: 10.1016/j.brainresrev.2010.02.002. [DOI] [PMC free article] [PubMed] [Google Scholar]
- Harthoorn LF, Sañé A, Nethe M, Van Heerikhuize JJ. Multi-transcriptional profiling of melanin-concentrating hormone and orexin-containing neurons. Cell Mol Neurobiol. 2005;25:1209–1223. doi: 10.1007/s10571-005-8184-8. [DOI] [PMC free article] [PubMed] [Google Scholar]
- Hervieu GJ, Cluderay JE, Harrison D, Meakin J, Maycox P, Nasir S, Leslie RA. The distribution of the mRNA and protein products of the melanin-concentrating hormone (MCH) receptor gene, slc-1, in the central nervous system of the rat. Eur J Neurosci. 2000;12:1194–1216. doi: 10.1046/j.1460-9568.2000.00008.x. [DOI] [PubMed] [Google Scholar]
- Hill JW, Williams KW, Ye C, Luo J, Balthasar N, Coppari R, Cowley MA, Cantley LC, Lowell BB, Elmquist JK. Acute effects of leptin require PI3K signaling in hypothalamic proopiomelanocortin neurons in mice. J Clin Invest. 2008;118:1796–1805. doi: 10.1172/JCI32964. [DOI] [PMC free article] [PubMed] [Google Scholar]
- Ito M, Ishihara A, Gomori A, Matsushita H, Ito M, Metzger JM, Marsh DJ, Haga Y, Iwaasa H, Tokita S, Takenaga N, Sato N, MacNeil DJ, Moriya M, Kanatani A. Mechanism of the anti-obesity effects induced by a novel melanin-concentrating hormone 1-receptor antagonist in mice. Br J Pharmacol. 2010;159:374–383. doi: 10.1111/j.1476-5381.2009.00536.x. [DOI] [PMC free article] [PubMed] [Google Scholar]
- Kádár A, Sánchez E, Wittmann G, Singru PS, Füzesi T, Marsili A, Larsen PR, Liposits Z, Lechan RM, Fekete C. Distribution of hypophysiotropic thyrotropin-releasing hormone (TRH)-synthesizing neurons in the hypothalamic paraventricular nucleus of the mouse. J Comp Neurol. 2010;518:3948–3961. doi: 10.1002/cne.22432. [DOI] [PMC free article] [PubMed] [Google Scholar]
- Karatayev O, Barson JR, Carr AJ, Baylan J, Chen YW, Leibowitz SF. Predictors of ethanol consumption in adult Sprague-Dawley rats: relation to hypothalamic peptides that stimulate ethanol intake. Alcohol. 2010;44:323–34. doi: 10.1016/j.alcohol.2010.05.002. [DOI] [PMC free article] [PubMed] [Google Scholar]
- Kokkotou EG, Tritos NA, Mastaitis JW, Slieker L, Maratos-Flier E. Melanin-concentrating hormone receptor is a target of leptin action in the mouse brain. Endocrinology. 2001;142:680–686. doi: 10.1210/endo.142.2.7981. [DOI] [PubMed] [Google Scholar]
- Kokkotou E, Jeon JY, Wang X, Marino FE, Carlson M, Trombly DJ, Maratos-Flier E. Mice with MCH ablation resist diet-induced obesity through strain-specific mechanisms. Am J Physiol Regul Integr Comp Physiol. 2005;289:R117–R124. doi: 10.1152/ajpregu.00861.2004. [DOI] [PubMed] [Google Scholar]
- Kong D, Vong L, Parton LE, Ye C, Tong Q, Hu X, Choi B, Brüning JC, Lowell BB. Glucose stimulation of hypothalamic MCH neurons involves K(ATP) channels, is modulated by UCP2, and regulates peripheral glucose homeostasis. Cell Metab. 2010;12:545–552. doi: 10.1016/j.cmet.2010.09.013. [DOI] [PMC free article] [PubMed] [Google Scholar]
- Lechan RM, Jackson IM. Immunohistochemical localization of thyrotropin-releasing hormone in the rat hypothalamus and pituitary. Endocrinology. 1982;111:55–65. doi: 10.1210/endo-111-1-55. [DOI] [PubMed] [Google Scholar]
- Leinninger GM, Opland DM, Jo YH, Faouzi M, Christensen L, Cappellucci LA, Rhodes CJ, Gnegy ME, Becker JB, Pothos EN, Seasholtz AF, Thompson RC, Myers MG., Jr Leptin action via neurotensin neurons controls orexin, the mesolimbic dopamine system and energy balance. Cell Metab. 2011;14:313–323. doi: 10.1016/j.cmet.2011.06.016. [DOI] [PMC free article] [PubMed] [Google Scholar]
- Leshan RL, Louis GW, Jo YH, Rhodes CJ, Münzberg H, Myers MG., Jr Direct innervation of GnRH neurons by metabolic- and sexual odorant-sensing leptin receptor neurons in the hypothalamic ventral premammillary nucleus. J Neurosci. 2009;29:3138–3147. doi: 10.1523/JNEUROSCI.0155-09.2009. [DOI] [PMC free article] [PubMed] [Google Scholar]
- Ludwig DS, Tritos NA, Mastaitis JW, Kulkarni R, Kokkotou E, Elmquist J, Lowell B, Flier JS, Maratos-Flier E. Melanin-concentrating hormone overexpression in transgenic mice leads to obesity and insulin resistance. J Clin Invest. 2001;107:379–386. doi: 10.1172/JCI10660. [DOI] [PMC free article] [PubMed] [Google Scholar]
- Madisen L, Zwingman TA, Sunkin SM, Oh SW, Zariwala HA, Gu H, Ng LL, Palmiter RD, Hawrylycz MJ, Jones AR, Lein ES, Zeng H. A robust and high-throughput Cre reporting and characterization system for the whole mouse brain. Nat Neurosci. 2010;13:133–140. doi: 10.1038/nn.2467. [DOI] [PMC free article] [PubMed] [Google Scholar]
- Marsh DJ, Weingarth DT, Novi DE, Chen HY, Trumbauer ME, Chen AS, Guan XM, Jiang MM, Feng Y, Camacho RE, Shen Z, Frazier EG, Yu H, Metzger JM, Kuca SJ, Shearman LP, Gopal-Truter S, MacNeil DJ, Strack AM, MacIntyre DE, Van der Ploeg LH, Qian S. Melanin-concentrating hormone 1 receptor-deficient mice are lean, hyperactive, and hyperphagic and have altered metabolism. Proc Natl Acad Sci U S A. 2002;99:3240–3245. doi: 10.1073/pnas.052706899. [DOI] [PMC free article] [PubMed] [Google Scholar]
- Marvizón JC, Chen W, Murphy N. Enkephalins, dynorphins, and beta-endorphin in the rat dorsal horn: an immunofluorescence colocalization study. J Comp Neurol. 2009;517:51–68. doi: 10.1002/cne.22130. [DOI] [PMC free article] [PubMed] [Google Scholar]
- Mashiko S, Ishihara A, Gomori A, Moriya R, Ito M, Iwaasa H, Matsuda M, Feng Y, Shen Z, Marsh DJ, Bednarek MA, MacNeil DJ, Kanatani A. Antiobesity effect of a melanin-concentrating hormone 1 receptor antagonist in diet-induced obese mice. Endocrinology. 2005;146:3080–3086. doi: 10.1210/en.2004-1150. [DOI] [PubMed] [Google Scholar]
- Matsuki T, Nomiyama M, Takahira H, Hirashima N, Kunita S, Takahashi S, Yagami K, Kilduff TS, Bettler B, Yanagisawa M, Sakurai T. Selective loss of GABA(B) receptors in orexin-producing neurons results in disrupted sleep/wakefulness architecture. Proc Natl Acad Sci U S A. 2009;106:4459–4464. doi: 10.1073/pnas.0811126106. [DOI] [PMC free article] [PubMed] [Google Scholar]
- Morens C, Norregaard P, Receveur JM, van Dijk G, Scheurink AJ. Effects of MCH and a MCH1-receptor antagonist on (palatable) food and water intake. Brain Res. 2005;1062:32–38. doi: 10.1016/j.brainres.2005.09.005. [DOI] [PubMed] [Google Scholar]
- Morganstern I, Chang GQ, Chen YW, Barson JR, Zhiyu Y, Hoebel BG, Leibowitz SF. Role of melanin-concentrating hormone in the control of ethanol consumption: Region-specific effects revealed by expression and injection studies. Physiol Behav. 2010;101:428–437. doi: 10.1016/j.physbeh.2010.07.009. [DOI] [PMC free article] [PubMed] [Google Scholar]
- Münzberg H, Huo L, Nillni EA, Hollenberg AN, Bjørbaek C. Role of signal transducer and activator of transcription 3 in regulation of hypothalamic proopiomelanocortin gene expression by leptin. Endocrinology. 2003;144:2121–2131. doi: 10.1210/en.2002-221037. [DOI] [PubMed] [Google Scholar]
- Pachoud B, Adamantidis A, Ravassard P, Luppi PH, Grisar T, Lakaye B, Salin PA. Major impairments of glutamatergic transmission and long-term synaptic plasticity in the hippocampus of mice lacking the melanin-concentrating hormone receptor-1. J Neurophysiol. 2010;104:1417–1525. doi: 10.1152/jn.01052.2009. [DOI] [PMC free article] [PubMed] [Google Scholar]
- Padilla SL, Carmody JS, Zeltser LM. Pomc-expressing progenitors give rise to antagonistic neuronal populations in hypothalamic feeding circuits. Nat Med. 2010;16:403–405. doi: 10.1038/nm.2126. [DOI] [PMC free article] [PubMed] [Google Scholar]
- Parton LE, Ye CP, Coppari R, Enriori PJ, Choi B, Zhang CY, Xu C, Vianna CR, Balthasar N, Lee CE, Elmquist JK, Cowley MA, Lowell BB. Glucose sensing by POMC neurons regulates glucose homeostasis and is impaired in obesity. Nature. 2007;449:228–232. doi: 10.1038/nature06098. [DOI] [PubMed] [Google Scholar]
- Paxinos G, Franklin KB. The Mouse Brain in Stereotaxic Coordinates. 2. San Diego, CA: Academic Press; 2001. [Google Scholar]
- Pissios P, Bradley RL, Maratos-Flier E. Expanding the scales: The multiple roles of MCH in regulating energy balance and other biological functions. Endocr Rev. 2006;27:606–620. doi: 10.1210/er.2006-0021. [DOI] [PubMed] [Google Scholar]
- Pissios P, Frank L, Kennedy AR, Porter DR, Marino FE, Liu FF, Pothos EN, Maratos-Flier E. Dysregulation of the mesolimbic dopamine system and reward in MCH−/− mice. Biol Psychiatry. 2008;64:184–191. doi: 10.1016/j.biopsych.2007.12.011. [DOI] [PubMed] [Google Scholar]
- Qiu J, Fang Y, Rønnekleiv OK, Kelly MJ. Leptin excites proopiomelanocortin neurons via activation of TRPC channels. J Neurosci. 2010;30:1560–1565. doi: 10.1523/JNEUROSCI.4816-09.2010. [DOI] [PMC free article] [PubMed] [Google Scholar]
- Qu D, Ludwig DS, Gammeltoft S, Piper M, Pelleymounter MA, Cullen MJ, Mathes WF, Przypek R, Kanarek R, Maratos-Flier E. A role for melanin-concentrating hormone in the central regulation of feeding behaviour. Nature. 1996;380:243–247. doi: 10.1038/380243a0. [DOI] [PubMed] [Google Scholar]
- Rao Y, Lu M, Ge F, Marsh DJ, Qian S, Wang AH, Picciotto MR, Gao XB. Regulation of synaptic efficacy in hypocretin/orexin-containing neurons by melanin concentrating hormone in the lateral hypothalamus. J Neurosci. 2008;28:9101–9110. doi: 10.1523/JNEUROSCI.1766-08.2008. [DOI] [PMC free article] [PubMed] [Google Scholar]
- Rossi M, Choi SJ, O’Shea D, Miyoshi T, Ghatei MA, Bloom SR. Melanin-concentrating hormone acutely stimulates feeding, but chronic administration has no effect on body weight. Endocrinology. 1997;138:351–355. doi: 10.1210/endo.138.1.4887. [DOI] [PubMed] [Google Scholar]
- Saito Y, Cheng M, Leslie FM, Civelli O. Expression of the melanin-concentrating hormone (MCH) receptor mRNA in the rat brain. J Comp Neurol. 2001;435:26–40. doi: 10.1002/cne.1191. [DOI] [PubMed] [Google Scholar]
- Schneider SP, Walker TM. Morphology and electrophysiological properties of hamster spinal dorsal horn neurons that express VGLUT2 and enkephalin. J Comp Neurol. 2007;501:790–809. doi: 10.1002/cne.21292. [DOI] [PubMed] [Google Scholar]
- Scott MM, Lachey JL, Sternson SM, Lee CE, Elias CF, Friedman JM, Elmquist JK. Leptin targets in the mouse brain. J Comp Neurol. 2009;514:518–532. doi: 10.1002/cne.22025. [DOI] [PMC free article] [PubMed] [Google Scholar]
- Sears RM, Liu RJ, Narayanan NS, Sharf R, Yeckel MF, Laubach M, Aghajanian GK, DiLeone RJ. Regulation of nucleus accumbens activity by the hypothalamic neuropeptide melanin-concentrating hormone. J Neurosci. 2010;30:8263–8273. doi: 10.1523/JNEUROSCI.5858-09.2010. [DOI] [PMC free article] [PubMed] [Google Scholar]
- Segal-Lieberman G, Bradley RL, Kokkotou E, Carlson M, Trombly DJ, Wang X, Bates S, Myers MG, Jr, Flier JS, Maratos-Flier E. Melanin-concentrating hormone is a critical mediator of the leptin-deficient phenotype. Proc Natl Acad Sci U S A. 2003;100:10085–10090. doi: 10.1073/pnas.1633636100. [DOI] [PMC free article] [PubMed] [Google Scholar]
- Shaner NC, Campbell RE, Steinbach PA, Giepmans BN, Palmer AE, Tsien RY. Improved monomeric red, orange and yellow fluorescent proteins derived from Discosoma sp. red fluorescent protein. Nat Biotechnol. 2004;22:1567–1572. doi: 10.1038/nbt1037. [DOI] [PubMed] [Google Scholar]
- Shearman LP, Camacho RE, Sloan Stribling D, Zhou D, Bednarek MA, Hreniuk DL, Feighner SD, Tan CP, Howard AD, Van der Ploeg LH, MacIntyre DE, Hickey GJ, Strack AM. Chronic MCH-1 receptor modulation alters appetite, body weight and adiposity in rats. Eur J Pharmacol. 2003;475:37–47. doi: 10.1016/s0014-2999(03)02146-0. [DOI] [PubMed] [Google Scholar]
- Shimada M, Tritos NA, Lowell BB, Flier JS, Maratos-Flier E. Mice lacking melanin-concentrating hormone are hypophagic and lean. Nature. 1998;396:670–674. doi: 10.1038/25341. [DOI] [PubMed] [Google Scholar]
- Smith DG, Tzavara ET, Shaw J, Luecke S, Wade M, Davis R, Salhoff C, Nomikos GG, Gehlert DR. Mesolimbic dopamine super-sensitivity in melanin-concentrating hormone-1 receptor-deficient mice. J Neurosci. 2005;25:914–922. doi: 10.1523/JNEUROSCI.4079-04.2005. [DOI] [PMC free article] [PubMed] [Google Scholar]
- Smits SM, Terwisscha van Scheltinga AF, van der Linden AJ, Burbach JP, Smidt MP. Species differences in brain pre-pro-neurotensin/neuromedin N mRNA distribution: the expression pattern in mice resembles more closely that of primates than rats. Brain Res Mol Brain Res. 2004;125:22–28. doi: 10.1016/j.molbrainres.2004.03.001. [DOI] [PubMed] [Google Scholar]
- Swanson LW, Sanchez-Watts G, Watts AG. Comparison of melanin-concentrating hormone and hypocretin/orexin mRNA expression patterns in a new parceling scheme of the lateral hypothalamic zone. Neurosci Lett. 2005;387:80–84. doi: 10.1016/j.neulet.2005.06.066. [DOI] [PubMed] [Google Scholar]
- Takeda S, Elefteriou F, Levasseur R, Liu X, Zhao L, Parker KL, Armstrong D, Ducy P, Karsenty G. Leptin regulates bone formation via the sympathetic nervous system. Cell. 2002;111:305–317. doi: 10.1016/s0092-8674(02)01049-8. [DOI] [PubMed] [Google Scholar]
- Tritos NA, Vicent D, Gillette J, Ludwig DS, Flier ES, Maratos-Flier E. Functional interactions between melanin-concentrating hormone, neuropeptide Y, and anorectic neuropeptides in the rat hypothalamus. Diabetes. 1998;47:1687–1692. doi: 10.2337/diabetes.47.11.1687. [DOI] [PubMed] [Google Scholar]
- Tritos NA, Mastaitis JW, Kokkotou E, Maratos-Flier E. Characterization of melanin concentrating hormone and preproorexin expression in the murine hypothalamus. Brain Res. 2001;895:160–166. doi: 10.1016/s0006-8993(01)02066-2. [DOI] [PubMed] [Google Scholar]
- Trudel E, Bourque CW. Circadian modulation of osmoregulated firing in rat supraoptic nucleus neurones. J Neuroendocrinol. 2012;24:577–586. doi: 10.1111/j.1365-2826.2012.02298.x. [DOI] [PubMed] [Google Scholar]
- van de Wall E, Leshan R, Xu AW, Balthasar N, Coppari R, Liu SM, Jo YH, MacKenzie RG, Allison DB, Dun NJ, Elmquist J, Lowell BB, Barsh GS, de Luca C, Myers MG, Jr, Schwartz GJ, Chua SC., Jr Collective and individual functions of leptin receptor modulated neurons controlling metabolism and ingestion. Endocrinology. 2008;149:1773–1785. doi: 10.1210/en.2007-1132. [DOI] [PMC free article] [PubMed] [Google Scholar]
- van den Pol AN, Yao Y, Fu LY, Foo K, Huang H, Coppari R, Lowell BB, Broberger C. Neuromedin B and gastrin-releasing peptide excite arcuate nucleus neuropeptide Y neurons in a novel transgenic mouse expressing strong Renilla green fluorescent protein in NPY neurons. J Neurosci. 2009;29:4622–4639. doi: 10.1523/JNEUROSCI.3249-08.2009. [DOI] [PMC free article] [PubMed] [Google Scholar]
- Varas MM, Pérez MF, Ramírez OA, de Barioglio SR. Increased susceptibility to LTP generation and changes in NMDA-NR1 and -NR2B subunits mRNA expression in rat hippocampus after MCH administration. Peptides. 2003;24:1403–1411. doi: 10.1016/j.peptides.2003.09.006. [DOI] [PubMed] [Google Scholar]
- Vincent SR, Hökfelt T, Christensson I, Terenius L. Dynorphin-immunoreactive neurons in the central nervous system of the rat. Neurosci Lett. 1982;33:185–190. doi: 10.1016/0304-3940(82)90249-x. [DOI] [PubMed] [Google Scholar]
- Wang Z, Zhou L, Hulihan TJ, Insel TR. Immunoreactivity of central vasopressin and oxytocin pathways in microtine rodents: a quantitative comparative study. J Comp Neurol. 1996;366:726–737. doi: 10.1002/(SICI)1096-9861(19960318)366:4<726::AID-CNE11>3.0.CO;2-D. [DOI] [PubMed] [Google Scholar]
- Wittmann G, Füzesi T, Liposits Z, Lechan RM, Fekete C. Distribution and axonal projections of neurons co-expressing thyrotrophin-releasing hormone and urocortin 3 in the rat brain. J Comp Neurol. 2009;517:825–840. doi: 10.1002/cne.22180. [DOI] [PMC free article] [PubMed] [Google Scholar]
- Xu AW, Ste-Marie L, Kaelin CB, Barsh GS. Inactivation of signal transducer and activator of transcription 3 in proopiomelanocortin (Pomc) neurons causes decreased pomc expression, mild obesity, and defects in compensatory refeeding. Endocrinology. 2007;148:72–80. doi: 10.1210/en.2006-1119. [DOI] [PubMed] [Google Scholar]
Associated Data
This section collects any data citations, data availability statements, or supplementary materials included in this article.