Abstract
Objectives
The objective of this study was to create a new measure for clinical information technology (IT) adoption as a proxy variable of clinical IT use.
Methods
Healthcare Information and Management Systems Society (HIMSS) data for 2004 were used. The 18 clinical IT applications were analyzed across 3,637 acute care hospitals in the United States. After factor analysis was conducted, the clinical IT adoption score was created and evaluated.
Results
Basic clinical IT systems, such as laboratory, order communication/results, pharmacy, radiology, and surgery information systems had different adoption patterns from advanced IT systems, such as cardiology, radio picture archiving, and communication, as well as computerized practitioner order-entry. This clinical IT score varied across hospital characteristics.
Conclusions
Different IT applications have different adoption patterns. In creating a measure of IT use among various IT components in hospitals, the characteristics of each type of system should be reflected. Aggregated IT adoption should be used to explain technology acquisition and utilization in hospitals.
Keywords: Medical Informatics, Health Information Technology, Clinical Informatics, Medical Information Science
I. Introduction
Studies of clinical information technology (IT) have increased considerably in recent years with the growing recognition of the importance of clinical IT in the context of healthcare quality and costs [1-15]. Previous studies have found that clinical IT could significantly increase quality and productivity, and decrease costs [1-14], although some studies have found a weak impact [9,16]. Many studies have adopted different approaches to measure IT adoption because healthcare facilities use many diverse IT systems. However, few studies and even fewer discussions have addressed how IT adoption should be measured in various clinical settings. It is important to measure IT adoption correctly because we must clearly understand the degree of IT adoption to fully understand the level of IT dispersion in healthcare facilities. In previous studies, IT adoption has been categorized, broadly, using two methods. One is to measure IT adoption by whether or not hospitals adopt a specific IT system. Several researchers have used this method to identify adoption of IT systems, such as Computerized Physician Order Entry (CPOE) systems and Electronic Medical Record (EMR) systems [1,4,5,7,9]. However, such studies cannot broadly explain technology acquisition and utilization because they ignore the other clinical IT systems in use. These studies may fit well or be appropriate in studies when researchers focus on the effect of a specific IT system.
The other method is to measure IT use with an aggregated score by assigning equal weight to each IT application [2,6]. Although this method better estimates the effect of using aggregated IT systems, it still has limitations in that the assignment of equal weight to IT systems can lead to inaccurate results. For example, adopting a basic system (e.g., a radiology information system) would be deemed equivalent to adopting an advanced system (e.g., a CPOE). Healthcare organizations may differ in their patterns of introducing various IT systems. Healthcare organizations with less experience in using clinical IT systems would likely invest in less expensive IT systems, and those with more experience would likely adopt more sophisticated and expensive systems. Obviously, giving both types of IT system equal weight could result in large measurement errors by underestimating the weight of hospitals with advanced clinical IT, such as CPOE or EMR.
Although there is some debate on measuring the use of clinical IT by counting with equal weight as mentioned above, a measure more sensitive to the type of IT could provide an important index for the overall level of IT adoption in healthcare organizations.
We may choose a more advanced approach from the second one above when we have to measure IT adoption by showing the degree of overall IT adoption. Many IT applications are adopted in healthcare organizations and are closely related with multi-products. For example, Picture Archiving Communication Systems (PACSs) are related with X-ray, imaging diagnosis, or laboratory resources. Therefore, to estimate the potential impact of clinical IT systems on hospital output, it is necessary to measure IT systems aggregately by reflecting different weights for diverse IT systems. Few studies have measured clinical IT systems this way. With the current national healthcare reform in the United States, it is imperative to measure the degree of clinical IT application aggregately in healthcare organizations.
Lacking a clear and accurate measurement of clinical IT may have precluded answering vital theoretical and policy questions related to clinical IT. Therefore, developing the aggregated clinical IT adoption measure is necessary. Thus, this paper focused on developing an aggregated score of clinical IT adoption (CITA) by allocating different weights to various clinical IT systems.
II. Methods
1. Data and Study Variables
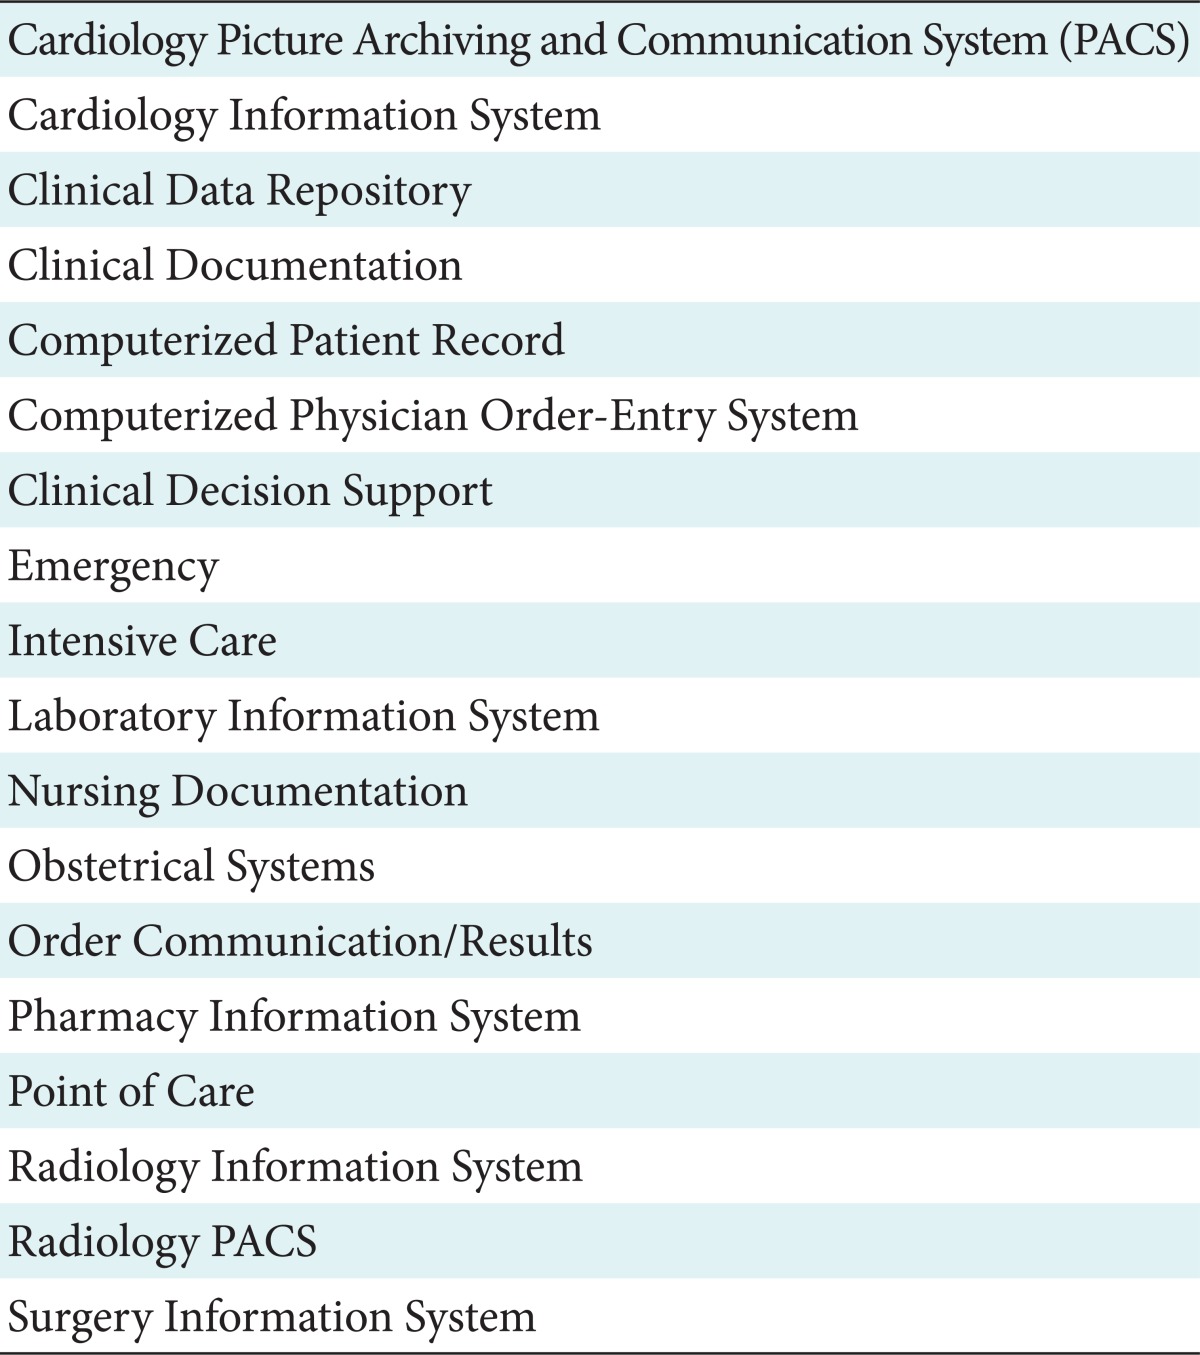
Healthcare Information and Management Systems Society (HIMSS) data was used for the available year of 2004. HIMSS data is the most comprehensive report on hospital adoption of IT applications in the United States. Its sample came from the American Hospital Association (AHA) survey and includes nearly all general hospitals with more than 100 beds, as well as some smaller hospitals. This data has been used in many studies [2-9,15]. The unit of observation is acute care hospitals which totaled 3,637 in 2004. Fifty-six IT applications are identified, which include IT systems of business offices, financial management, and human resource systems. However, this paper includes only the 18 clinical IT systems based on the HIMSS definition [16] because clinical IT systems are oriented toward quality of care, which is the most important goal of hospitals. Each clinical IT system is considered to be adopted if the adoption status is automated, contracted, or replaced. The clinical IT applications included are listed in Table 1. In addition, this study defines "basic IT systems" as computerized systems that can help medical clinicians to store and to pull out clinical data from computer systems and "advanced IT systems" as computerized systems that can allow the exchange of clinical information across physicians or organizations.
Table 1.
List of clinical IT

2. Statistical Analysis
To aggregate clinical ITs, factor analysis (FA) was applied. FA clusters variables into homogeneous sets and can handle many variables without the degree-of-freedom problems faced in regression analysis [17]. FA is a statistical tool describing variability among observed variables into fewer unobserved variables and the information gained can be used to reduce the dimensions of variables in a dataset. FA has been usually applied in psychology and social science [18].
The most commonly-used FA is principle component analysis (PCA). In PCA, the extracted components are not correlated to one another. The first extracted component in PCA is a linear combination of the original variables, and it explains the maximum variance among the variables. The second principle component is extracted from a residual matrix generated after removal of the first principle components. This extraction process is repeated until the variance-covariance matrix is turned into random error. In this way, the first extracted component explains the maximum variance, and the second one explains the least variance. This PCA approach assumes that the items included can be perfectly accounted for by the extracted components [18]. The observed variables are modeled as linear combinations of the factors as follows:
where y is the adoption status of clinical IT (0 or 1), i is the number of factors, and f is the vector latent common trend or factor loading shared by a set of response variables; λ is the factor loading representing the correlations of each of the items with the factor, and it determines the form of the linear combinations of the common pattern. By comparing factor loadings, we can infer which common pattern is meaningful to a certain response variable, as well as which group of response variables shows the same common pattern [19]. For the analysis, this study used Stata ver. 10.1 (StataCorp., College Station, TX, USA).
III. Results
1. General Characteristics of Study Subjects
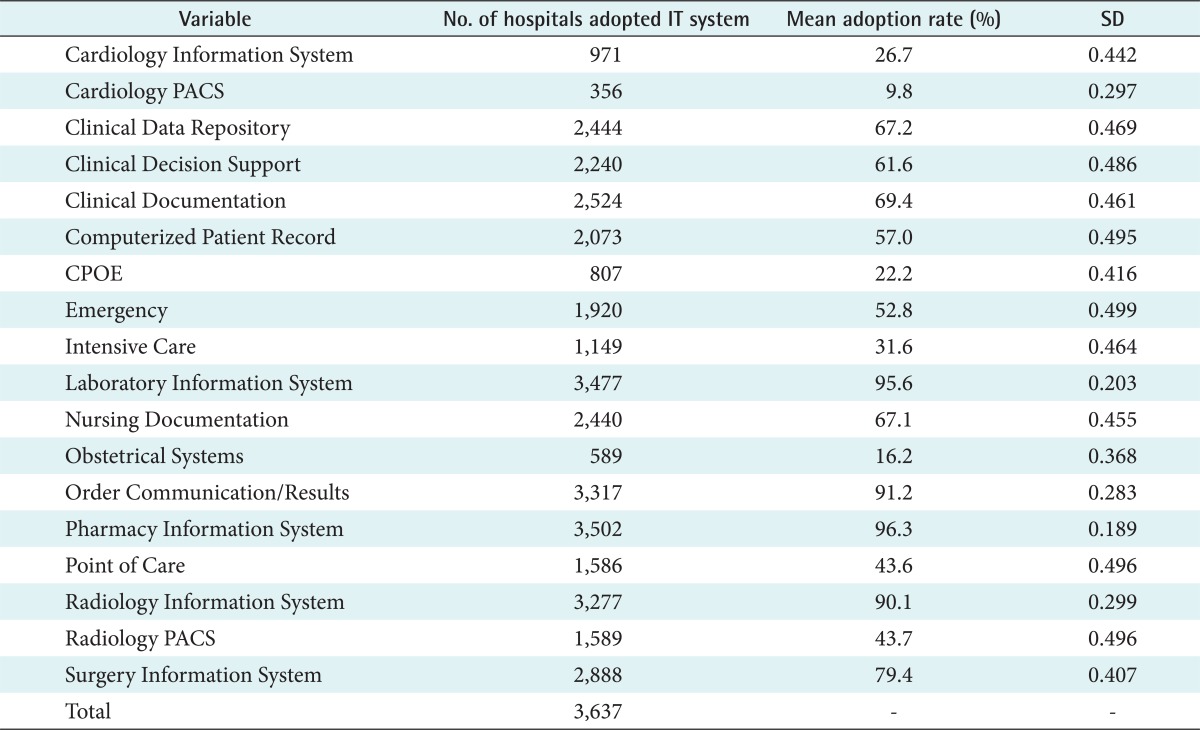
Table 2 shows the percentages and standard deviations of hospitals adopting each clinical IT system. The basic systems, including laboratory and pharmacy information systems, had adoption rates over 90% in 2004, while the adoption rate of advanced clinical IT systems, including CPOE and PACS, was low. Basic IT systems just collect clinical data from patients, but advanced IT systems can exchange this information across physicians or organizations.
Table 2.
Descriptive statistics of clinical IT adoption rate

PACS: Picture Archiving and Communication System, CPOE: Computerized Physician Order-Entry System, SD: standard deviation.
We also checked the correlation matrix for 18 clinical IT systems (not reported). The correlation varies from 0.05 to 0.54, but most are around 0.2, indicating that FA can be applied [18].
2. Information Technology System with Similarity
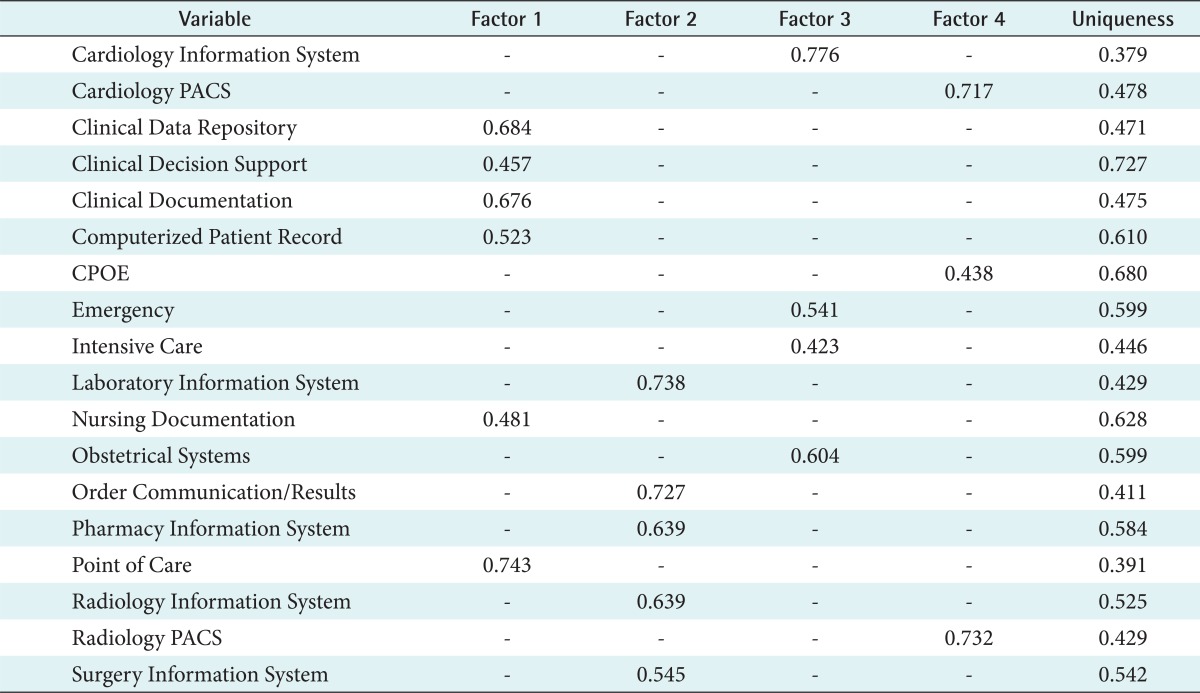
Table 3 shows the factor loading of the same items on the four rotated principle components after varimax rotation. Varimax rotation was used to simplify the columns of the unrotated factor loading matrix. Using varimax rotation allows for the variances of the loadings within the factors and differences between the high and low loadings to be maximized to 20. The factor loading is the correlation between an IT system and a factor. Table 3 shows only factor loadings greater than 0.4.
Table 3.
Factor analysis results

PACS: Picture Archiving and Communication System, CPOE: Computerized Physician Order-Entry System.
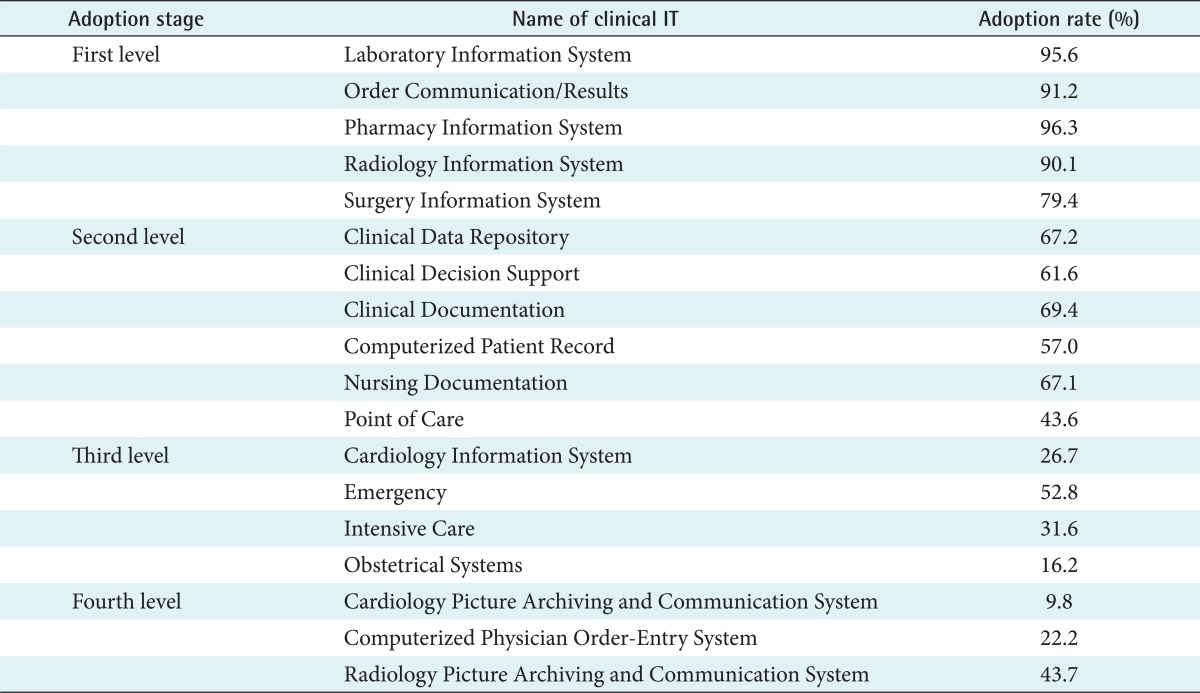
While analysis shows four different groups by factors, it cannot distinguish basic IT systems from advanced ones. Therefore, IT systems were grouped into four levels based on the adoption rate in Table 2. For example, five applications under factor 2 in Table 3 were assigned to basic or first level because their adoption rate was the highest among all other groups, around 90%. The other three groups of IT applications were assigned similarly. Therefore, the first level (basic clinical ITs) included Laboratory Information Systems (LISs), Order Communication/Results (OC/R), Pharmacy Information Systems (PISs), Radiology Information Systems (RISs), and Surgery Information Systems (SISs). The second level included Clinical Data Repositories (CDRs), Clinical Decision Support (CDS), Clinical Documentation (CD), Computerized Patient Record (CPRs), Nursing Documentation, and Point of Care (POC). The third level included cardiology information systems, as well as emergency, intensive care, and obstetrical systems. The fourth level (most advanced clinical ITs) included cardiology PACSs, CPOE systems, and radiology PACSs.
3. Patterns of Clinical IT Adoptions
In Table 4, we can consider that the IT applications in each level are adopted consecutively. For example, if a hospital adopts an LIS, it is more likely to adopt an RIS rather than CPOE or PACS. Among 18 clinical IT systems, we generated four groups based on the adoption rate and results of FA. Each component in the four groups has similar characteristics which the hospitals go through in the process of IT adoption.
Table 4.
Adoption stage of clinical IT

4. Evaluating Validity of the CITA Score
To calculate the CITA, different weights were assigned to each level. For example, weight "1" was assigned to the first level, 2 to the second level, 3 to the third level, and 4 to the fourth level. ITs in the lower level have lower weight because they are basic and less effective or of lesser value compared to ITs in the higher level. Then, the weighted clinical ITs were aggregated to get the CITA score for each hospital. For example, a hospital which adopted three ITs in level 1, four in level 2, and two in level 3 had a CITA score of 17 (= 3 × 1 + 4 × 2 + 2 × 3). CITA scores ranged from 0 to 41 and averaged 18.76 (standard deviation, 8.38).
Moreover, this study investigated CITA scores across hospital characteristics, such as teaching status, number of beds, and ownership, as shown in Table 5. Teaching status is classified as teaching or non-teaching. Number of beds is defined as licensed bed. Ownership is classified as for-profit, not-for-profit, and government. Teaching hospitals had CITA scores that were 5.62 points higher, which was statistically significant. Not-for-profit hospitals had 2 points higher CITA scores than for-profit and government hospitals. Lastly, hospitals with the most beds had the highest CITA scores.
Table 5.
Clinical IT adoption score across hospital characteristics

SD: standard deviation.
at-test for teaching states and chi-square or analysis of variance for ownership and bed-size.
IV. Discussion
Measuring aggregated clinical IT is important in order to analyze the effect of IT on hospital outcomes. Because hospitals produce multiple products using multiple IT systems, it is necessary to measure clinical IT systems accurately and aggregately. This study used HIMSS data to create a CITA score after using FA to measure the degree of clinical IT use. This study found that most hospitals were adopting a basic system, such as a laboratory and pharmacy information system, and a few were installing CPOE and PACS, or an advanced one. This study result indirectly suggests an important implication for future studies. Evaluating the level of clinical IT use of healthcare organizations may be better evaluated by determining whether or not they had an advanced clinical IT system, such as COPE or PACS.
The study results also show that some clinical IT systems had similar characteristics. LIS, OC/R, PIS, RIS, and SIS could be grouped into one type of system with common characteristics and CPOE and PACS in another. This study got the result of four groups, although it could be less than or more than four groups. It is necessary to study further how these four groups differ from each other and how they affect health outcome or organizational performance differently.
An interesting finding is that IT systems in each level are adopted consecutively. This finding is exactly in line with several theoretical arguments [20,21]. Theoretical argument says that there are early adopters and laggards to the advanced technologies. Depending on hospital characteristics, some would adopt CPOE or PACS early, and others would not.
This study also found that the level of clinical IT adoption differs in degree by hospital characteristics. Teaching status, ownership such as profit versus non-profit status, and bed-size of hospitals were closely related to clinical IT adoption status measured with a proxy variable of CITA score. Teaching hospitals, not-for-profit hospitals, and hospitals with large bed-size had higher clinical IT adoption levels, which is consistent with the findings many other studies [2-4,6,8,9].
The study is limited in generalizability. First, it is a cross sectional study. Therefore, we need to be cautious when applying this CITA score to a different year. Second, only acute care hospitals were sampled. Thus, the CITA score may vary if other hospitals (i.e., long-term care and critical access hospitals) were included. Third, an arbitrary weight was attributed in each category. Therefore, the CITA score will be different with different weight. However, for comparison, we need ordinal scores which rank hospitals by score. Even though we applied various weights, similar results were obtained in score order.
Overall, this paper suggests that different IT systems have different adoption patterns. Therefore, aggregated IT systems should be used to explain technology acquisition and utilization in hospitals.
Footnotes
No potential conflict of interest relevant to this article was reported.
References
- 1.Mekhjian HS, Kumar RR, Kuehn L, Bentley TD, Teater P, Thomas A, et al. Immediate benefits realized following implementation of physician order entry at an academic medical center. J Am Med Inform Assoc. 2002;9(5):529–539. doi: 10.1197/jamia.M1038. [DOI] [PMC free article] [PubMed] [Google Scholar]
- 2.Parente ST, Van Horn RL. Valuing hospital investment in information technology: does governance make a difference? Health Care Financ Rev. 2006;28(2):31–43. [PMC free article] [PubMed] [Google Scholar]
- 3.Burke DE, Wang BB, Wan TT, Diana ML. Exploring hospitals' adoption of information technology. J Med Syst. 2002;26(4):349–355. doi: 10.1023/a:1015872805768. [DOI] [PubMed] [Google Scholar]
- 4.McCullough JS. The adoption of hospital information systems. Health Econ. 2008;17(5):649–664. doi: 10.1002/hec.1283. [DOI] [PubMed] [Google Scholar]
- 5.Fonkych K, Taylor R. The state and pattern of health information technology adoption. Santa Monica (CA): Rand Corporation; 2005. [Google Scholar]
- 6.Borzekowski R. Measuring the cost impact of hospital information systems: 1987-1994. J Health Econ. 2009;28(5):938–949. doi: 10.1016/j.jhealeco.2009.06.004. [DOI] [PubMed] [Google Scholar]
- 7.Parente ST, McCullough JS. Health information technology and patient safety: evidence from panel data. Health Aff (Millwood) 2009;28(2):357–360. doi: 10.1377/hlthaff.28.2.357. [DOI] [PubMed] [Google Scholar]
- 8.Lee J, McCullough JS, Town RJ. The impact of health information technology on hospital productivity. Cambridge (MA): National Bureau of Economic Research; 2012. NBER Working paper no. 18025. [Google Scholar]
- 9.McCullough JS, Casey M, Moscovice I, Prasad S. The effect of health information technology on quality in U.S. hospitals. Health Aff (Millwood) 2010;29(4):647–654. doi: 10.1377/hlthaff.2010.0155. [DOI] [PubMed] [Google Scholar]
- 10.Jha AK, DesRoches CM, Campbell EG, Donelan K, Rao SR, Ferris TG, et al. Use of electronic health records in U.S. hospitals. N Engl J Med. 2009;360(16):1628–1638. doi: 10.1056/NEJMsa0900592. [DOI] [PubMed] [Google Scholar]
- 11.Teich JM, Merchia PR, Schmiz JL, Kuperman GJ, Spurr CD, Bates DW. Effects of computerized physician order entry on prescribing practices. Arch Intern Med. 2000;160(18):2741–2747. doi: 10.1001/archinte.160.18.2741. [DOI] [PubMed] [Google Scholar]
- 12.Wang SJ, Middleton B, Prosser LA, Bardon CG, Spurr CD, Carchidi PJ, et al. A cost-benefit analysis of electronic medical records in primary care. Am J Med. 2003;114(5):397–403. doi: 10.1016/s0002-9343(03)00057-3. [DOI] [PubMed] [Google Scholar]
- 13.Garg AX, Adhikari NK, McDonald H, Rosas-Arellano MP, Devereaux PJ, Beyene J, et al. Effects of computerized clinical decision support systems on practitioner performance and patient outcomes: a systematic review. JAMA. 2005;293(10):1223–1238. doi: 10.1001/jama.293.10.1223. [DOI] [PubMed] [Google Scholar]
- 14.Amarasingham R, Plantinga L, Diener-West M, Gaskin DJ, Powe NR. Clinical information technologies and inpatient outcomes: a multiple hospital study. Arch Intern Med. 2009;169(2):108–114. doi: 10.1001/archinternmed.2008.520. [DOI] [PubMed] [Google Scholar]
- 15.Furukawa MF, Raghu TS, Shao BB. Electronic medical records, nurse staffing, and nurse-sensitive patient outcomes: evidence from California hospitals, 1998-2007. Health Serv Res. 2010;45(4):941–962. doi: 10.1111/j.1475-6773.2010.01110.x. [DOI] [PMC free article] [PubMed] [Google Scholar]
- 16.HIMSS Analytics [Internet] Chicago (IL): HIMSS Analytics; c2013. [cited at 2013 Mar 18]. Available from: http://www.himssanalytics.org/ [Google Scholar]
- 17.Garrett-Mayer E. Statistics in psychosocial research [Internet] Baltimore (MD): The John Hopkins University; c2006. [cited at 2013 Mar 18]. Available from: http://ocw.jhsph.edu/courses/statisticspsychosocialresearch/pdfs/lecture8.pdf. [Google Scholar]
- 18.Pett MA, Lackey NR, Sullivan JJ. Making sense of factor analysis: the use of factor analysis for instrument development in health care research. Thousand Oaks (CA): Sage Publications; 2003. [Google Scholar]
- 19.Zuur AF, Tuck ID, Bailey N. Dynamic factor analysis to estimate common trends in fisheries time series. Can J Fish Aquat Sci. 2003;60(5):542–552. [Google Scholar]
- 20.Walden EA, Browne GJ. Sequential adoption theory: a theory for understanding herding behavior in early adoption of novel technologies. J Assoc Inf Syst. 2009;10(1):31–62. [Google Scholar]
- 21.Rogers EM. Diffusion of innovation. 5th ed. New York (NY): Free Press; 2003. [Google Scholar]


