

Abstract
Background
Loss-of-function mutations in Nav1.5 cause sodium channelopathies, including Brugada syndrome (BrS), dilated cardiomyopathy (DCM), and sick sinus syndrome (SSS), however, no effective therapy exists. MOG1 increases plasma membrane (PM) expression of Nav1.5 and sodium current (INa) density, thus we hypothesize that MOG1 can serve as a therapeutic target for sodium channelopathies.
Methods and Results
Knockdown of MOG1 expression using siRNAs reduced Nav1.5 PM expression, decreased INa densities by 2-fold in HEK/Nav1.5 cells and nearly abolished INa in mouse cardiomyocytes. MOG1 did not affect Nav1.5 PM turnover. MOG1 siRNAs caused retention of Nav1.5 in endoplasmic reticulum, disrupted the distribution of Nav1.5 into caveolin3-enriched microdomains, and led to redistribution of Nav1.5 to non-caveolin-rich domains. MOG1 fully rescued the reduced PM expression and INa densities by Nav1.5 trafficking defective mutation D1275N associated with SSS/DCM/atrial arrhythmias. For BrS mutation G1743R, MOG1 restored the impaired PM expression of the mutant protein, and restored INa in a heterozygous state (mixture of wild-type and mutant Nav1.5) to a full level of a homozygous wild-type state.
Conclusions
Use of MOG1 to enhance Nav1.5 trafficking to PM may be a potential personalized therapeutic approach for some patients with BrS, DCM and SSS in the future.
Keywords: cardiac sodium channel Nav1.5, SCN5A, MOG1, cell surface expression, ion channel trafficking
Introduction
The cardiac sodium channel Nav1.5 (encoded by the SCN5A gene) is required for the initiation and conduction of the cardiac action potential. Loss-of-function mutations cause Brugada syndrome (BrS), cardiac conduction disease (CCD), sick sinus syndrome (SSS), dilated cardiomyopathy (DCM), and atrial fibrillation (AF).1,2 However, no effective treatments are available for these disorders except for invasive implantation of defibrillators or pacemakers in some cases.
Recent studies have started to unravel the molecular mechanism for regulation of Nav1.5 function, which may lead to the development of new therapeutic strategies for prevention or management of diseases associated with Nav1.5 mutations. In 2008, we reported the 3 identification of MOG1 as a new factor that interacts with and regulates the function of Nav1.5. MOG1 is a small, 187 amino acid protein which interacts with Ran, the Ras family GTPase involved in nuclear import and export.4 MOG1 is expressed in both lateral sarcolemma and intercalated disks in atrial and ventricular cardiomyocytes, and overexpression of MOG1 enhances cell surface expression of Nav1.5 and sodium current (INa) densities.3 Interestingly, a dominant negative missense mutation E83D in MOG1 was found to be associated with BrS.5
Defects in cell surface trafficking of ion channels have been demonstrated to be a novel molecular mechanism underlying the pathogenesis of a variety of arrhythmic disorders. Many loss-of-function Nav1.5 mutations, including D1275N associated with SSS, AF and DCM and G1743R associated with BrS, are due to defective trafficking of2,6,7 Identification of new Nav1.5.mechanisms that can be targeted to increase trafficking of Nav1.5 to plasma membranes (PM) may have a potential therapeutic implication. In this study, we assessed whether MOG1 canenhance PM trafficking of mutant sodium channels and rescue the reduced INa associated with Nav1.5 mutations.
Methods
Details for each method are presented in the Online Supplements.
Membrane Fractionations and Western Blot (WB) Analysis
Isolation of subcellular fractions including PM, a rough endoplasmic reticulum (RER)-enriched fraction, and caveolin-enriched fractions, and WB analyses were performed as described earlier3 and details are in the Online Supplement.
RNA Interference
MOG1-specific small interfering RNAs (siRNAs) (designed using Dharmacon software) and control scrambler siRNAs (designed by GenScript) were synthesized by Dharmacon RNAi Technologies. Sequences of the siRNAs are shown in Supplemental Table 1.
Electrophysiological Analysis
HEK293 cells that stably overexpress Nav1.5 (HEK/Nav1.5) or neonatal cardiomyocytes transfected with fluorescent conjugated siRNAs were identified by the presence of green fluorescence and used for whole-cell voltage clamp recordings of INa as described earlier by us.3 Details for recordings of the late sodium current (INaL), the transient outward potassium current (ITo) and the L-type calcium current (ICa-L) are in the Online Supplements.
tsA201 cells (a kind gift from Charles Antzelevitch) were transfected with expression plasmids and pmaxEGFP (Lonza Inc). Cells with green fluorescence were used for whole-cell voltage clamp recordings of INa as described previously by us.3
Assays for Stability of the PM Fraction of Nav1.5
Stability analysis of Nav1.5 on PM was performed by a cell surface biotinylation assay adapted from the endocytosis assay by Morimoto et al,8 and details are in the Online Supplements.
Statistical Analysis
Data are presented as mean±SEM. Statistical analysis was performed using a two-tailed Student’s t-test to compare means between two groups and significance was set at P < 0.05 unless otherwise indicated.
Results
Effects of Knockdown of MOG1 Expression on Cardiac INa
We used RNA interference (siRNA) to knock MOG1 expression down in HEK/Nav1.5 cells and determined its effect on INa density. The genomic region for MOG1 on chromosome 17p13.1 overlaps with that for a much larger gene SLC25A35, which is transcribed in the opposite direction from the reverse strand (Figure 1A). To prevent the non-specific knockdown of the SLC25A35 gene, we have selected and tested the siRNAs that specifically targeted MOG1, but not SLC25A35. Transfection of two independent siRNAs against MOG1 into HEK/Nav1.5 cells significantly decreased the expression level of MOG1 mRNA (Figure 1B) or protein (Figure 1C), but not the level of SLC25A35 mRNA (Figure 1D). MOG1-specific siRNA1 decreased INa densities across the range of test potentials compared to scrambler siRNA1 (scrm1) (Figure 2A–B). Identical results were obtained for MOG1-specific siRNA2 (Figure S1). The peak current density was reduced by >2-fold by both siRNA1 and siRNA2 (Figure S2, Supplemental Table 3). No significant alteration in the steady state activation/inactivation kinetics and recovery from inactivation was observed for MOG1 siRNAs (Figure 2C–D, Supplemental Table 3).
Figure 1. MOG1 siRNA specifically knocks the expression of MOG1 down but not of SLC25A35 in HEK/Nav1.5 cells.

A. MOG1 and SLC25A35 reside in the same genomic location, but are transcribed from the opposite strand. The triangle points to the siRNA target site. B. Relative mRNA levels of MOG1 analyzed by qRT-PCR. scrm, scrambler siRNA. C. WB analysis for MOG1. GAPDH, loading control. D. Relative mRNA levels of SLC25A35 analyzed by qRT-PCR.
Figure 2. Knockdown of MOG1 expression by siRNAs significantly decreased INa density in HEK/Nav1.5 cells.

A. Raw traces of sodium currents. B. Effects of siRNA1 on the current- voltage relationship of Nav1.5. The current amplitudes were normalized to cell capacitance (pA/pF, abscissa). C. Effects of siRNA1 on steady-state activation (Right) and inactivation (Left) of Nav1.5. D. Effects of siRNA1 on recovery from inactivation of Nav1.5.
We then tested whether MOG1 also affects the late INa generated by WT or ΔKPQ mutation, which was known to generate a larger late INa.9 Overexpression of MOG1 did not have any significant effect on the late INa (Figure S3). Thus, the effect of MOG1 is specific to the peak INa.
More dramatic effects were found for MOG1 siRNA1 on INa in cardiomyocytes. When MOG1 expression was knocked down in mouse neonatal cardiomyocytes by siRNA1, INa was almost diminished (Figure 3). Identical results were obtained with MOG1-specific siRNA2 (Figure S4).
Figure 3. Knockdown of MOG1 expression markedly reduced INa densities in neonatal cardiomyocytes.

Relative mRNA levels of MOG1 (A) and SCN5A (B) were analyzed by qRT-PCR. C. Relative protein levels of MOG1 analyzed by WB analysis (12% gel, Top) and quantified by densitometry (Bottom). D. Raw traces of peak INa and current densities (pA/pF). Current densities (pA/pF) were 8.37±3.15 (siRNA1) and 107.24±10.13 pF (scrm) (P=4.31×10⁻⁶).
We performed similar electrophysiological analyses on the L-type voltage-dependent calcium current (ICa-L) and the transient outward potassium current (ITo) in mouse neonatal cardiomyocytes. MOG1 siRNA1 and siRNA2 did not have any significant effect on nifedipine- sensitive ICa-L (Figure S5) or ITo in neonatal cardiomyocytes (Figure S6).
MOG1 Is Required for the Cell Surface Expression of Nav1.5
To explore the potential mechanism by which reduced MOG1 expression decreased INa, we determined the effects of MOG1 siRNA1 and siRNA2 on the expression level of Nav1.5 on PM. Figure 4A showed that knockdown of MOG1 expression in HEK/Nav1.5 cells significantly decreased the level of Nav1.5 on PM. The decreased PM expression of Nav1.5 was not caused by decreased SCN5A gene expression since the total amounts of SCN5A mRNA and Nav1.5 protein did not decrease significantly in the cells (Figure 4B–C). Therefore, down-regulation of MOG1 expression led to a decrease of the cell surface expression of Nav1.5.
Figure 4. Knockdown of MOG1 expression significantly decreased the PM expression of NaV1.5 without affecting the expression of total Nav1.5.

A. Relative amounts of Nav1.5 in the PM of HEK/Nav1.5 cells analyzed by WB analysis. Inputs, 1/50 of total cell extracts used for PM protein isolation; GAPDH, loading control. B. Relative amounts of SCN5A mRNA analyzed by qRT-PCR. C. Relative amounts of Nav1.5 protein in the total cell extracts analyzed by WB analysis.
Molecular Mechanism by which MOG1 Regulates PM Expression of Nav1.5
The steady state level of Nav1.5 in the PM is determined by the rate of trafficking to the PM and the rate of internalization back to the intracellular compartments. To identify the molecular mechanism by which MOG1 increases PM expression of Nav1.5, we tested whether MOG1 affects the stability of Nav1.5 on PM. PM proteins of tsA201 cells co-transfected with an SCN5A expression plasmid and MOG1 expression plasmid pcMOG1 (empty vector pcDNA as control) were biotinylated and then allowed to internalize for 3, 6, and 9 hrs. At each time point, one set of cells were stripped off biotin and lysed (pool 1 of internalized biotinylated Nav1.5), and another set of cells were lysed directly (pool 2 of both PM and the internalized Nav1.5). Subtraction of pool 1 Nav1.5 from pool 2 results in the PM pool of biotinylated Nav1.5. The PM pool of Nav1.5 reduced by more than 50% by 3 hrs (Figure 5), suggesting that the turnover of Nav1.5 is considerably fast. No significant difference on the amount of the PM pool of Nav1.5 was found with and without overexpression of MOG1 at all three time points (P=0.84, 0.33, 0.57, Figure 5). These results suggest that MOG1 does not modulate the stability and/or internalization of Nav1.5 on PM.
Figure 5. MOG1 does not affect the stability of PM Nav1.5.
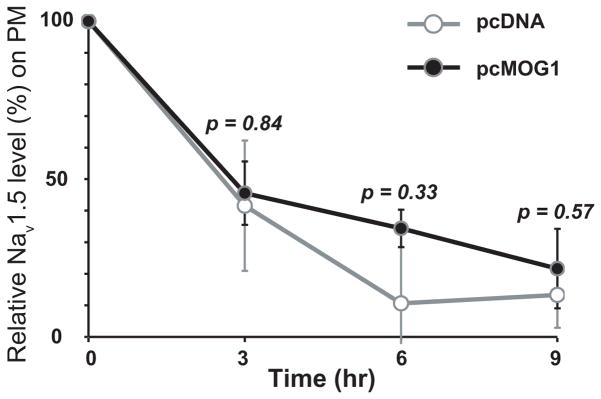
A relative amount of biotinylated plasma membrane Nav1.5 from tsA201 cells overexpressing SCN5A and MOG1 (pcMOG1) or vector as a control (pcDNA3.1) was analyzed by cell surface biotinylation assays. The experiment was repeated 3 times.
Exclusion of an effect of MOG1 on the turnover of PM Nav1.5 suggests that increased PM expression of Nav1.5 by MOG1 may be due to enhanced trafficking of Nav1.5 to PM. Trafficking of Nav1.5 to PM consists of transport from the ER to the Golgi apparatus and from the Golgi apparatus to PM. MOG1 was previously shown to interact with RAN4 in the nucleocytoplasmic transport system which is close to the ER. Therefore, we tested whether MOG1 is critical to the trafficking of Nav1.5 from the ER to Golgi apparatus. HEK/Nav1.5 cells were transfected with MOG1 specific siRNAs and scrambler siRNAs as controls for 48 hrs and lysed. The lysates enriched with RER were used to determine the amount of Nav1.5. Knockdown of MOG1 significantly increased the amount of Nav1.5 in RER (Figure 6A). Thus, knockdown of MOG1 expression resulted in retention of Nav1.5 in RER.
Figure 6. Knockdown of MOG1 expression causes retention of Nav1.5 in the ER and the redistribution of Nav1.5 from caveolin-3 enriched fractions and other fractions.

A. Relative amounts of Nav1.5 in the RER-enriched fractions of HEK/Nav1.5 cells analyzed by WB analysis (10% gel). Calnexin (an ER marker), loading control. B. HEK/Nav1.5 cells were transiently transfected with an expression plasmid for caveolin-3. Cell lysates were fractionated, one ml of fractions (a total of 12 fractions) were collected from the top of the gradient and analyzed by WB (10% gel) with antibodies against Nav1.5, MOG1 or caveolin-3 (Cav-3). The experiment was repeated three times.
Because MOG1 interacts with Nav1.5, we examined whether MOG1 was also present in RER. WB analysis detected the presence of MOG1 in the RER-enriched fraction of HEK/Nav1.5 cell lysates (Figure S7). Overexpression of MOG1 increased the MOG1 level in RER, while MOG1 siRNA dramatically decreased the MOG1 level in that fraction (Figure S7).
Knockdown of MOG1 Expression Leads to Redistribution of Nav1.5 in a Caveolin-3- Enriched Pool to Other Areas
Different ion channels are trafficked to their respective membrane subdomains to efficiently exert their functional effects. Caveolae, the specialized caveolin-enriched compartments, have been implicated in the cellular trafficking of PM proteins. It was shown that Nav1.5 was associated with caveolin-3 in the caveolin-rich membranes.10 Since MOG1 interacts with Nav1.5,3 MOG1 might also be present in the caveolin-rich membranes. Protein extracts from HEK293 cells with co-expression of Nav1.5 and caveolin-3 were fractionated through a sucrose density gradient into 12 different fractions. WB analysis showed that MOG1 indeed co-localized with Nav1.5 in the cavolin-3-rich membrane fractions (Figure 6B). We then determined whether MOG1 affects localization of Nav1.5 in caveolar membrane compartments. Nav1.5 was normally associated with caveolar fractions (Figure 6B). However, MOG1 knockdown caused redistribution of Nav1.5 to non-caveolar fractions and caveolar Nav1.5 content from caveolin-3-rich fractions 4–7 was decreased significantly (84.19±8.90 % vs. 52.03±9.63%, P=0.0035, n=3) (Figure 6B). These data suggest that knockdown of MOG1 expression disrupts localization of Nav1.5 onto caveolin-3-rich fractions and led to redistribution of Nav1.5 to non-caveolin-3-rich fractions, defining a significant role of MOG1 in regulating and/or maintaining Nav1.5 localization in caveolin-3-rich membrane microdomains.
MOG1 Can Rescue the Disrupted PM Expression of Nav1.5 and Marked INa Reduction by Trafficking-Defective Mutation D1275N Associated with SSS, Atrial Arrhythmias and DCM
Because overexpression of MOG1 can significantly increase the PM expression of Nav1.5,3 we hypothesized that overexpression of MOG1 might rescue the trafficking defect of Nav1.5 caused by mutation D1275N. WB analyses showed that mutation D1275N significantly reduced PM expression of Nav1.5 (Figure 7A, compare Lane 1 and 2), and MOG1 significantly increased PM expression of mutant D1275N Nav1.5 (Figure 7A, compare Lane 2 and 3). The expression level of Nav1.5/D1275N on PM in the presence of MOG1 was at the comparable level as that of the WT Nav1.5 alone (Figure 7A Lane 3 vs. 1, P=0.98). Mutation D1275N significantly reduced the INa densities over a range of test potentials, and MOG1 fully rescued this defect (Figure 7B–C). The peak INa density was significantly lower for D1275N mutant channels than for wild type channels (P=0.016; Figure S8). In the presence of MOG1, no significant difference of the peak INa density was detected between D1275N mutant channels and wild type channels (P=0.81, Figure S8, note that peak currents were at potentials of −30 mV and −15 mV for WT and D1275N channels, respectively), indicating that MOG1 restored the function of D1275N mutant channels. The mean maximal conductance values were 55.11±4.43 nS and 85.68±3.58 (P=0.005) at the membrane potential of −30 mV for WT channels in the absence and presence of MOG1, respectively, and 41.67±4.82 ns and 73.53±5.39 (P=0.001) at the membrane potential of −15 mV for D1275N channels in the absence and presence of MOG1, respectively.
Figure 7. MOG1 rescued PM expression and function of Nav1.5/D1275N mutant.

A. WB analysis of Nav1.5 on the PM from tsA201 cells co-transfected with the wild-type (WT) or mutant (D1275N) SCN5A gene with (+) or without (−) MOG1. N-cadherin, loading control. B. Raw traces of a family of INa in cells transfected with WT (Top) or mutant (Bottom) SCN5A expression constructs without (−) or with (+) MOG1. C. Effects of MOG1 on the current-voltage relationship of WT and mutant Nav1.5. The current amplitudes were normalized to cell capacitance (pA/pF, abscissa). D. Effects of MOG1 on steady-state activation of WT and mutant Nav1.5. E. Effects of MOG1 on steady-state inactivation of WT and mutant Nav1.5. F. Effects of MOG1 on recovery from inactivation of WT and mutant Nav1.5.
Mutation D1275N affected channel kinetics and shifted the steady state activation and inactivation to more positive potentials (Figure 7D–F). However, overexpression of MOG1 did not alter channel kinetics of either wild-type (WT) or mutant D1275N Nav1.5 (Figure 7D–F, Supplemental Table 4).
Effect of MOG1 Overexpression on BrS Mutation G1743R
Although previous attempt in using high concentrations of sodium channel blockers quinidine and especially mexiletine has been shown to restore the INa density of sodium channels with BrS mutation G1743R to some extent, but <16% of the wild-type INa density,7 the potential side-effects of the high doses present a safety concern. Here we examined whether MOG1 overexpression could rescue defects associated with mutation G1743R. WB analyses showed that mutation G1743R significantly reduced PM expression of Nav1.5 (Figure 8A, compare Lane 1 and 2), and MOG1 significantly increased PM expression of mutant G1743R Nav1.5 (Figure 8A, compare Lane 2 and 3). The expression level of Nav1.5/G1743R on PM in the presence of MOG1 was at the comparable level as that of the WT Nav1.5 alone (Figure 8A Lane 3 vs. 1, P=0.67). Functionally, mutant G1743R completely eliminated INa (compare WT to G1743R in the absence of MOG1 overexpression, Figure 8B). Overexpression of MOG1 in cells co-transfected with an equal amount of wild-type and mutant G1743R expression constructs generated a comparable level of INa as the cells transfected with wild-type SCN5A plasmid alone (Figure 8B–C). Similarly, the peak INa density for mixed G1743R+WT sodium channels in the presence of MOG1 was similar to WT sodium channels (P=0.77, Figure S9). The mean maximal conductance values at the membrane potential of −25 mV were 36.31±3.67 nS and 51.92±3.73 (P=0.0013) for WT channels in the absence and presence of MOG1, respectively, and 20.56±3.26 ns and 35.16±3.56 ns (P=0.0058) for WT/G1743R channels in the absence and presence of MOG1, respectively. Thus, overexpression of MOG1 can restore the level of INa densities in the heterozygous state (G1743R+WT) to that of homozygous wild-type state.
Figure 8. Effects of MOG1 on PM expression and function of mutant Nav1.5/G1743R in the presence/absence of wild-type Nav1.5.

A. WB analysis of PM Nav1.5 level for WT or mutant (G1743R) channels with (+) or without (−) MOG1. N-cadherin, loading control. B. Raw traces of INa in cells transfected with WT SCN5A (Top), mutant SCN5A (G1743R, Middle) or an equal amount of mutant+WT (Bottom) without (−) or with (+) MOG1. C. Effects of MOG1 on the current-voltage relationship. D. Effects of MOG1 on steady-state activation. E. Effects of MOG1 on steady-state inactivation. F. Effects of MOG1 on recovery from inactivation.
The steady state activation/inactivation as well as recovery from inactivation were not significantly affected by MOG1 overexpression for either WT or mixture of WT+G1743R channels (Figure 8D–F, Supplemental Table 5).
Discussion
We have previously reported the identification of MOG1 as a Nav1.5-modulating protein that interacts with Nav1.5 and enhances INa density.3 Here, we show that knockdown of MOG1 in HEK/Nav1.5 cells and mouse cardiomyocytes leads to a significant decrease in the amount of Nav1.5 on PM and a significant decrease in INa density. These results were previously published as an Abstract.11 Recently, Kattygnarath et al also found that MOG1 siRNA decreased INa density in HEK293 cells,5 but its effect on Nav1.5 trafficking to PM was not studied. Furthermore, their study did not examine the effect of si-MOG1 either in cardiomyocytes or on expression of SLC25A35 gene, which overlaps with MOG1. In this study we carefully demonstrate that MOG1-specific siRNAs inhibit Nav1.5 expression on PM and result in reduced INa both in HEK293 cells overexpressing Nav1.5 and in mouse cardiomyocytes, indicating the essential regulatory roles of MOG1 in Nav1.5 expression on PM and physiological function.
The data in this study suggest that the molecular mechanism by which MOG1 increases Nav1.5 expression on PM is through increased trafficking of Nav1.5 onto PM, but not by affecting Nav1.5 turnover on PM. Because knockdown of MOG1 expression by siRNA led to retention of Nav1.5 in the RER (Figure 6A), MOG1 may be involved in ER-to-Golgi transport. Most interestingly, MOG1-specific siRNA disrupts localization of Nav1.5 to caveolin-3 rich sarcolemma subdomains (caveolae). The results suggest that MOG1 not only regulates Nav1.5 trafficking to the plasma membrane, but also directs Nav1.5 into caveolae microdomains. However, the underlying mechanism by which Nav1.5 is targeted to and retained in caveolae remains unknown and warrants future studies.
Bioinformatic analysis showed that the intracellular loop II between transmembrane domains II and III of Nav1.5 did not have any homology with the L-type calcium channel Cav1.2 (CACNA1C) or potassium channel proteins Kv4.1, Kv4.2, or Kv4.3 that encode ITo. This may explain why knockdown of MOG1 expression did not affect the ICaL and ITo from neonatal cardiomyocytes. No homology was identified between Nav1.5 loop II and KCNQ1 (encoding the IKs potassium current) or KCNH2 (IKr potassium current). Thus, MOG1 may not affect IKs or IKr,. Recent studies showed that Nav1.5 and Kir2.1 shared a common trafficking mechanism involving their respective protein complex formation with SAP97.12 However, we found that in tsA201 cells, co-expression of Kir2.1 with MOG1 did not increase PM expression of Kir2.1 compared to expression of Kir2.1 alone (P=0.64, Figure S10), suggesting that MOG1 may not be involved in trafficking of Kir2.1 to PM. Interestingly, homology was identified between Nav1.5 loop II and Nav1.1, Nav1.2, Nav1.3, Nav1.4, Nav1.7, Nav1.8, Nav1.9, and Nav1.10. It will be interesting to systematically examine whether MOG1 has any effect on the functions of other sodium channels that share homology with Nav1.5 in the future.
One of the major findings of the present study is that MOG1 can rescue Nav1.5 trafficking defects and INa decreases identified in patients with BrS, DCM, and SSS. Implantation of an implantable cardioverter defibrillator (ICD) and a pacemaker is the only therapeutic option for BrS and SSS patients, respectively, at the present time. The invasive ICD therapy may cause painful shocks or initiate rhythm disturbances due to inappropriate activations, may not prevent syncope and death, and may have devastating impact on quality of life. Thus, alternative therapeutic strategies are needed for BrS and SSS. Data in this study suggest that MOG1- enabled trafficking of Nav1.5 to PM may serve as a novel mechanism that can be used to explore potential therapies for BrS and SSS patients with loss-of-function mutations in Nav1.5. Moreover, reduced sodium current densities were frequently associated with acquired cardiac disorders, such as myocardial infarctions, myocardial ischemia, and heart failure. The causes are heterogeneous, but identification of MOG1 as the molecule that can enhance INa without affecting the kinetics of sodium currents may help the development of therapeutic strategies for such patients with reduced expression of Nav1.5.
Similar to the report by Gui et al 2, we found that mutation D1275N reduced INa densities at more negative membrane potentials from −10 mV to −50 mV (Figure 7C). The results are consistent with those from Western blot studies (Figure 7A) utilizing cultured tsA201 cells that were at physiological, resting membrane potentials reported to be from −20 mV to −40 mV for this type of cells.13 Similarly, mutation D1275N markedly reduced INa densities in ventricular cardiomyocytes isolated from mice with the mutation.14 Mutation D1275N altered the gating properties by shifting the voltage dependence of both activation and inactivation to more positive potentials (Figure 7D and 7E). On the other hand, in ventricular myocytes, D1275N did not affect the voltage dependence of activation and positively, but slightly, shifted the inactivation curve.14 Therefore, we predict that MOG1 is expected to rescue D1275N-associated phenotypes in mice. Ongoing studies in transgenic mice harboring the D1275N mutation will test this hypothesis. For mutation G1743R, the mutant remained non-functional even after its PM expression level was restored to the wild type level (Figure 8A and 8B). Interestingly, when co-expressed with WT Nav1.5, a situation mimicking the heterozygous state in human patients, we found that MOG1 restored INa densities to cells with WT Nav1.5 (a situation mimicking normal people). We postulate that MOG1 may drive the cytoplasmic pool of Nav1.5 to PM, resulting in increased INa densities. The results may have a general implication that MOG1 may be a potential strategy to increase INa densities in patients with haploinsufficiency of Nav1.5 (e.g. nonsense mutations, frame-shift mutations) or with pore mutations that inactivate Nav1.5 and mutations in other genes that lead to a reduction of Nav1.5 cell surface expression.
One of the limitations of this study is the difficulties in achieving high transfection efficiency in cardiomyocytes. Our optimized condition achieved only 10–30% of transfection efficiency for siRNAs in mouse neonatal cardiomyocytes using oligofectamine. This was not a major problem for electrophysiological analysis since the transfected cells could be identified by the green fluorochrome dye that was conjugated to the siRNAs. However, the low transfection efficiency did compromise our biochemical analysis. This explains why MOG1 siRNAs almost eliminated the sodium current in neonatal cardiomyocytes, while MOG1 expression levels were knocked down by 30–50%. There is another important limitation with the present study. In addition to caveolae, Nav1.5 is also targeted to other membrane subdomains such as intercalated disks and T-tubules. Our study was not able to address whether MOG1 also affects Nav1.5 targeting to intercalated disks or T-tubules. MOG1 is expressed in both sarcolemma and intercalated disks,3 thus it will be interesting to explore whether MOG1 is involved in targeting of Nav1.5 to intercalated disks. Future studies with adult cardiomyocytes isolated from MOG1 knockout mice are required to address this issue.
Supplementary Material
Acknowledgments
We would like to thank S. Prasad, S. Karnik for their critical advice.
Funding
This work was supported by the National Institute of Health grant (R01 HL094498), the China National Basic Research Program (973 program 2013CB531101), the American Heart Association Scientist Development grant (0630193N to Q.C.), and the American Heart Association NCRP Innovation Research grant (11IRG5570046).
Footnotes
Disclosures
None.
References
- 1.Chen Q, Kirsch GE, Zhang D, Brugada R, Brugada J, Brugada P, Potenza D, Moya A, Borggrefe M, Breithardt G, Ortiz-Lopez R, Wang Z, Antzelevitch C, O’Brien RE, Schulze-Bahr E, Keating MT, Towbin JA, Wang Q. Genetic basis and molecular mechanism for idiopathic ventricular fibrillation. Nature. 1998;392:293–296. doi: 10.1038/32675. [DOI] [PubMed] [Google Scholar]
- 2.Gui J, Wang T, Jones RP, Trump D, Zimmer T, Lei M. Multiple loss-of-function mechanisms contribute to SCN5A-related familial sick sinus syndrome. PLoS One. 5(6):e10985. doi: 10.1371/journal.pone.0010985. [DOI] [PMC free article] [PubMed] [Google Scholar]
- 3.Wu L, Yong SL, Fan C, Ni Y, Yoo S, Zhang T, Zhang X, Obejero-Paz CA, Rho HJ, Ke T, Szafranski P, Jones SW, Chen Q, Wang QK. Identification of a new co-factor, MOG1, required for the full function of cardiac sodium channel Nav 1.5. J Biol Chem. 2008;283:6968–6978. doi: 10.1074/jbc.M709721200. [DOI] [PubMed] [Google Scholar]
- 4.Steggerda SM, Paschal BM. Identification of a conserved loop in Mog1 that releases GTP from Ran. Traffic. 2001;2:804–811. doi: 10.1034/j.1600-0854.2001.21109.x. [DOI] [PubMed] [Google Scholar]
- 5.Kattygnarath D, Maugenre S, Neyroud N, Balse E, Ichai C, Denjoy I, Dilanian G, Martins RP, Fressart V, Berthet M, Schott JJ, Leenhardt A, Probst V, Le Marec H, Hainque B, Coulombe A, Hatem SN, Guicheney P. MOG1: A New Susceptibility Gene for Brugada Syndrome. Circ Cardiovasc Genet. 4:261–268. doi: 10.1161/CIRCGENETICS.110.959130. [DOI] [PubMed] [Google Scholar]
- 6.Zimmer T, Surber R. SCN5A channelopathies--an update on mutations and mechanisms. Prog Biophys Mol Biol. 2008;98:120–136. doi: 10.1016/j.pbiomolbio.2008.10.005. [DOI] [PubMed] [Google Scholar]
- 7.Valdivia CR, Tester DJ, Rok BA, Porter CB, Munger TM, Jahangir A, Makielski JC, Ackerman MJ. A trafficking defective, Brugada syndrome-causing SCN5A mutation rescued by drugs. Cardiovasc Res. 2004;62:53–62. doi: 10.1016/j.cardiores.2004.01.022. [DOI] [PubMed] [Google Scholar]
- 8.Morimoto S, Nishimura N, Terai T, Manabe S, Yamamoto Y, Shinahara W, Miyake H, Tashiro S, Shimada M, Sasaki T. Rab13 mediates the continuous endocytic recycling of occludin to the cell surface. J Biol Chem. 2005;280:2220–2228. doi: 10.1074/jbc.M406906200. [DOI] [PubMed] [Google Scholar]
- 9.Dumaine R, Wang Q, Keating MT, Hartmann HA, Schwartz PJ, Brown AM, Kirsch GE. Multiple mechanisms of Na+ channel--linked long-QT syndrome. Circ Res. 1996;78:916–924. doi: 10.1161/01.res.78.5.916. [DOI] [PubMed] [Google Scholar]
- 10.Yarbrough TL, Lu T, Lee HC, Shibata EF. Localization of cardiac sodium channels in caveolin-rich membrane domains: regulation of sodium current amplitude. Circ Res. 2002;90:443–449. doi: 10.1161/hh0402.105177. [DOI] [PubMed] [Google Scholar]
- 11.Chakrabarti S, Yong S, Shin Y, Wu L, Wang QK. Knockdown of Mog1 expression reduces sodium currents by reducing the trafficking of cardiac sodium channel Nav1.5 to the cell membrane. Circulation. 2008;118:S_338. [Google Scholar]
- 12.Milstein ML, Musa H, Balbuena DP, Anumonwo JM, Auerbach DS, Furspan PB, Hou L, Hu B, Schumacher SM, Vaidyanathan R, Martens JR, Jalife J. Dynamic reciprocity of sodium and potassium channel expression in a macromolecular complex controls cardiac excitability and arrhythmia. Proc Natl Acad Sci U S A. 109:E2134–2143. doi: 10.1073/pnas.1109370109. [DOI] [PMC free article] [PubMed] [Google Scholar]
- 13.Thomas P, Smart TG. HEK293 cell line: a vehicle for the expression of recombinant proteins. J Pharmacol Toxicol Methods. 2005;51:187–200. doi: 10.1016/j.vascn.2004.08.014. [DOI] [PubMed] [Google Scholar]
- 14.Watanabe H, Yang T, Stroud DM, Lowe JS, Harris L, Atack TC, Wang DW, Hipkens SB, Leake B, Hall L, Kupershmidt S, Chopra N, Magnuson MA, Tanabe N, Knollmann BC, George AL, Jr, Roden DM. Striking In vivo phenotype of a disease-associated human SCN5A mutation producing minimal changes in vitro. Circulation. 124:1001–1011. doi: 10.1161/CIRCULATIONAHA.110.987248. [DOI] [PMC free article] [PubMed] [Google Scholar]
Associated Data
This section collects any data citations, data availability statements, or supplementary materials included in this article.