

Abstract
Fundamental mathematical relationships are widespread in biology yet there is little information on this topic with regard to human limb bone lengths and none related to human limb bone volumes. Forty-six sets of ipsilateral upper and lower limb long bones and third digit short bones were imaged by computed tomography. Maximum bone lengths were measured manually and individual bone volumes calculated from computed tomography images using a stereologic method. Length ratios of femur : tibia and humerus : ulna were remarkably similar (1.21 and 1.22, respectively) and varied little (<7%) between individuals. The volume ratio of femur : tibia was approximately half that of humerus : ulna (1.58 and 3.28, respectively; P < 0.0001). Lower limb bone volume ratios varied much more than upper limb ratios. The relationship between bone length and volume was found to be well described by power laws, with R2 values ranging from 0.983 to 0.995. The most striking finding was a logarithmic periodicity in bone length moving from distal to proximal up the limb (upper limb λ = 0.72, lower limb λ = 0.93). These novel data suggest that human limb bone lengths and volumes follow fundamental and highly conserved mathematical relationships, which may contribute to our understanding of normal and disordered growth, stature estimation, and biomechanics.
Keywords: bone morphometrics, limb development, scaling
Mathematics is ‘the language with which God has written the universe’
Galileo Galilei (1564–1642)
Introduction
The philosophical approach to biology known as process structuralism maintains there are important mechanisms in nature which can be deduced by exploring regularities in biological form (Resnick, 1994). An essential methodology of process structuralism is morphometrics, the quantitative analysis of biological shape and size. Many intriguing mathematical relationships are known to exist in biological form. One such example is the Fibonacci sequence (0, 1, 1, 2, 3, 5, 8, 13, n, m, n + m, …) where a sequence of numbers is generated by the sum of the two previous numbers; the ratio of any two consecutive numbers progressively converges to the golden ratio (φ = 1.618). The golden ratio can be found throughout nature and the physical world (Hutchison & Hutchison, 2010). It manifests in biological structural proportions as diverse as the florets in a cauliflower head, the structure of DNA, the proportions of the mandible, and the configuration of facial features (Ricketts, 1982; Ulmer et al. 2009).
Relatively few mathematical ratios have been studied in the human skeleton. Lowrance & Latimer (1967) observed that vertebral weights increased caudally in a predictable sequence related to load-bearing. Dogan et al. (2007) found evidence of fixed proportions between the length and width of metatarsals and phalanges in the foot. The most intensively studied region has been the human hand. In a theoretical paper, Littler (1973) first postulated that a Fibonacci sequence described the movement arcs of the interphalangeal and carpometacarpal joints of the fingers; the latter segment was defined as being between the head of each metacarpal and the head of the capitate. Hamilton & Dunsmuir (2002) measured the distances between the axes of rotation at interphalangeal and metacarpophalangeal joints in radiographs of adult hands and claimed to refute Littler's hypothesis. In a related study that measured phalangeal and metacarpal bone lengths in radiographs of healthy adult hands, Park et al. (2003) reached a similar conclusion. Hutchison & Hutchison (2010) recently reinterpreted the data from Hamilton & Dunsmuir (2002) and concluded that there was indeed evidence of a Fibonacci sequence for the functional lengths of bone segments between consecutive axes of rotation in all fingers but it remains uncertain as to whether actual short bone lengths show this sequence. It is also unknown whether this mathematical relationship extends to include long bones in the upper limb and to lower limb bones in general.
These ratios may not only be of academic interest. For example, the ratio of the length of the second to fourth digit has been correlated with prenatal androgen exposure (Manning et al. 1998) and the risk of developing prostate cancer (Rahman et al. 2011) and myocardial infarction (Kyriakidis et al. 2010). There is a surprising lack of information on length ratios in human limb bones, and almost no data on normal limb bone volumes. The latter may in part reflect difficulties in developing appropriate methods to estimate bone volume.
One way to comprehensively describe the fundamental geometrical properties of a set of variably sized segments such as the bones of the limbs is to consider each segment as an element of a mathematical sequence with a systematically changing interval length. A regular periodic function such as a sinusoidal waveform describes an interval with a constant length prescribed by the wavelength λ in relation to the spatial parameter x, as shown in Fig. 1A. An extension of this concept of regular periodicity is a logarithmic periodic (log-periodic) function which produces a changing interval size which scales according to the value of λ (Fig. 1B). The Fibonacci sequence, with a successive interval length equal to the sum of the two previous interval lengths, can be expressed by a log-periodic function with a value of λ equal to 0.5 (Fig. 1C). Hence, while the Fibonacci sequence may not provide an appropriate description of actual limb bone lengths, it is hypothesized that a log-periodic function with a different value of λ may indeed explain human limb bone proportions. An advantage of using a log-periodic function is that only one parameter, λ, is required to account for the sequence of segmental lengths in the whole upper or lower limb.
Fig. 1.
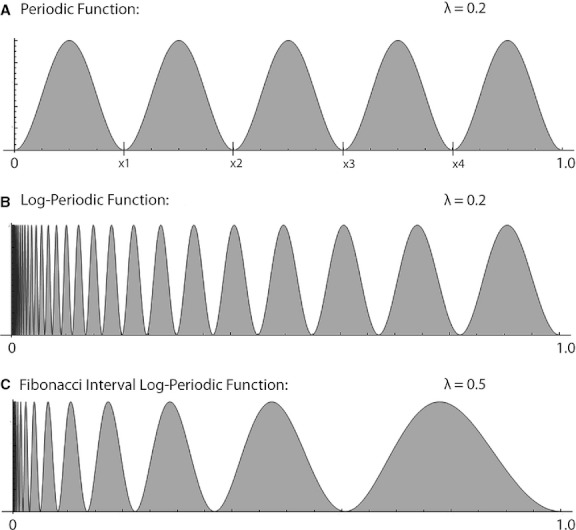
A regular periodic function (A) has nodes (x1, x2, x3,…) at regular points generating a constant interval width (xn+1 − xn) equal to the function's wavelength, λ. In contrast, a log-periodic function (B,C) has nodes with steadily increasing width as the dimensional parameter x gets larger. For log-periodic functions the parameter λ dictates how the interval size scales with x. A log-periodic function with interval sizes corresponding to the Fibonacci sequence is shown in (C).
The aim of this study was to obtain accurate measurements of limb bone lengths and novel data on human limb bone volumes in order to investigate the possible existence of mathematical predictive ratios in both weight-bearing and non-weight-bearing human limb bones. Furthermore, this study tests the hypothesis that the lengths of consecutive human limb bones can be described by a log-periodic relationship using a single parameter (λ) to account for proportions within the entire sequence.
Materials and methods
Study material consisted of sets of adult limb bones available in the W.D. Trotter Anatomy Museum at the University of Otago. After excluding bones with significant damage or major osteoarthritic pathology, 46 sets of ipsilateral upper and lower limb bones (24 right, 22 left; 30 males) were available for analysis. The majority of these [38 (83%) sets, 24 males] were of Asian Indian origin and the remainder [8 (17%) sets, six males, consisting of two half sets and three full skeletons] were from New Zealand Europeans. Third digit metacarpals, metatarsals and phalanges were present in 30 sets (15 right sides).
Measurements
Length
The maximum length of each long bone was measured using an osteometric board (Paleo-Tech Concepts, IL, USA; accuracy ±0.5 mm); a modified board (University of Otago, New Zealand; accuracy ± 1 mm) was used for the tibia to exclude the intercondylar eminence. Maximum long bone lengths were defined according to established criteria (Buikstra & Ubelaker, 1994). The maximum length of third digit metacarpals, metatarsals and phalanges was measured between the most proximal and distal points of the bone using electronic digital calipers (Series SC02 Tresna® Point Digital Calipers, Guilin Guanglu Measuring Instrument Co. Ltd, China; accuracy ± 0.03 mm; resolution 0.01 mm).
Volume
Each set of limb bones was imaged using computed tomography (CT) (Somatom Emotion 16 CT scanner, Siemens Shanghai Medical Equipment Ltd, China). Long bones were scanned at 6-mm intervals with a 3-mm slice thickness; metacarpals, metatarsals and phalanges were scanned at 2-mm intervals with a 2-mm slice thickness. DICOM files were analyzed using imagej 1.41o (National Institutes of Health, USA). Individual axial images of each bone were selected and a standardized threshold applied to optimize the bone perimeter. Each image was then converted into binary form and cross-sectional area (CSA) calculated using the multi-measure function tool. Images were viewed at 300% for long bones and 400% for short bones at a window setting of approximately 400 and level setting of approximately −800. A small proportion of images required manual tracing of the bone perimeter to provide a complete perimeter silhouette.
Bone volumes were calculated using the Cavalieri principle (Gunderson et al. 1988). In brief, this entails the random selection of an axial image less than d mm from the end of the bone and measuring the CSA in this and successive parallel axial images taken at intervals of d mm along the entire length of the bone. Bone volume is estimated as the average CSA multiplied by the distance between adjacent slices.
Validation and reliability
A set of replica plastic limb bones (SOMSO-Plast®, Coburg, Germany) were scanned by CT under identical conditions and their volumes calculated using the same methods. Resultant volumes were compared with values obtained by water displacement in graduated measuring cylinders (5–50 mL). Intra-rater reliability was assessed by repeating measurements of length and volume in 20% of the sets after an interval of at least 1 week with the observer blinded to the original results.
Data analysis
Statistics
Data were analyzed using Microsoft Excel 2008 for Mac version 12.2.4 (Microsoft Corporation, WA, USA) and PASW Statistics 18.0 (SPSS Inc., Chicago, IL, USA). Continuous variables were compared using paired and unpaired t-tests as appropriate and correlation was assessed by Pearson's coefficient, taking P < 0.05 as statistically significant. Intra-rater repeatability was assessed by intraclass correlation coefficients (ICCs). As the ICC approaches 1.0, progressively more of the total variation in the data relates to variation within the sample and less to measurement error. ICCs were classified as follows: <0 poor agreement, 0–0.20 slight, 0.21–0.40 fair, 0.41–0.60 moderate, 0.61–0.80 substantial, and 0.81–1.0 almost perfect agreement (Landis & Koch, 1977).
Power laws, geometry, and length-volume relationships
A power law is a mathematical relationship between two measurable quantities of the form:
| (1) |
where f(x) represents a generic quantity in relation to the property x, and α and β are two variables defining the specific form of the power law. If data follow a power law relationship, they can be expressed as a straight line with slope of β and intercept of Ln(α) by taking the logarithms of each measurable quantity as:
| (2) |
The dimensions of a geometrical object, i.e. its length, width, or radius and its volume follow power law relationships which depend on the specific geometry of the object. For instance, the volume of a sphere (Vsphere) can be expressed entirely in terms of a single dimensional parameter, its radius (rsphere):
| (3) |
If the volumes and radii of a large number of different kinds of perfect spheres are measured, the relationship between sphere volume and radius will be a power law with α = (4/3)π and β = 3. In contrast, a perfect cylinder has two-dimensional measures, a radius (rcylinder) and a length (Lcylinder), and its volume (Vcylinder) is denoted by:
| (4) |
For a collection of variable sized cylinders, if only Lcylinder is measured, Vcylinder follows a power law relationship with α = πr2 and β = 1.
Human limb bones have a complex three-dimensional geometry with no clearly definable or constant radius like a true cylinder. However, as they are expected to follow power law relationships between their dimensional measures and volumes it was hypothesized that the relationship between limb bone length (Lbone) and volume (Vbone) would have the following form:
| (5) |
Equation (5) can be reduced to a line with slope β and intercept Ln(α) by taking logarithms of Lbone and Vbone as indicated by Eqn (2). Note that the value of α relates to the magnitude of the radial dimension of the bone, which was not measured in this study due to its variable nature. In general, higher values of α imply thicker bones. The value of β relates to the geometry of the bone; a value of β around 1 indicates a cylindrical bone, and a value nearer three indicates more globular morphology.
The natural logarithms of all bone lengths (cm) and volumes (cm3) obtained in this study were analyzed using linear regression analysis.
Logarithmic periodicity
Periodic functions repeat a pattern at regular intervals. An example of a classic periodic function describing a series of peaks is the sinusoidal function having a spatial dimension x and a wavelength λ (Fig. 1A):
| (6) |
The sinusoidal function of Eqn (6) repeats itself at regular intervals defined by the wavelength. The points at which the function becomes zero are called nodes. If each node is indexed by the integer n (where n = 1, 2, 3, …), a segment interval length (Sn) can be defined for each node in the series by measuring from the starting point (x = 0) to each node along the x axis (Fig. 2). For the periodic function defined in Eqn (6), the value of Sn for each node starting from x = 0 is given by the expression:
Fig. 2.
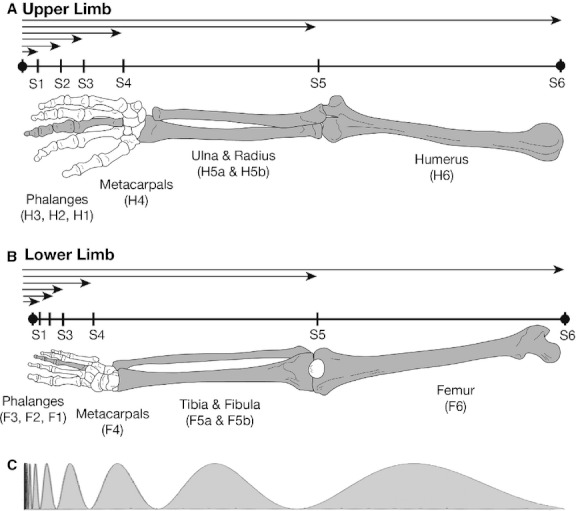
A schematic illustration of the parameters defined in this study. (A) Human upper limb bones were indexed by H6 for humerus; H5 for the segment shared by the ulna (H5a) and radius (H5b); H4 for third metacarpal; and H3, H2, H1 for the proximal, middle, and distal phalanges of the middle finger, respectively. (B) Human lower limb bones were indexed by F6 for femur; F5 for the segment shared by the tibia (F5a) and fibula (F5b); F4 for third metatarsal; and F3, F2, F1 for the proximal, middle, and distal phalanges of the middle toe, respectively. The tip of the distal phalanx of the third digit of the hand or foot was taken to be the origin (x = 0) and six ‘segment intervals’ (S1, S2, S3, etc.) were defined as measures from the fingertip to each bone endpoint, normalized to an individual's total limb length. Carpal and tarsal bones were not included in the analysis. (C) The interval widths for determining a log-periodic function were taken from the lengths of the six segment intervals.
| (7) |
which reduces to:
| (8) |
Therefore, the function of Eqn (8) is zero at all points where x = Sn, which are whole number multiples of λ.
A variation on this concept is log-periodicity (Fig. 1B), which can be derived by taking the logarithm of x (Fig. 1B):
| (9) |
The log-periodic expression of Eqn (9) is zero for:
| (10) |
Equation (10) follows a straight line with a slope equivalent to the value of λ when the logarithm of the segment interval distance Ln(Sn) is plotted against the node index n.
The human limbs consist of distinct long and short bones in series. To apply the concept of log-periodicity to human limbs, the distance between the tip of the distal phalanx of the third finger or toe was taken to be the origin (x = 0) of a distance x, while the proximal limit of successive short and long bones in each limb represented the nth node of a log-periodic function (Fig. 2). The distance between the tip of the distal phalanx and each node (normalized to the combined length of the bones in that limb) was assumed to be a measure of Sn and the sequence of such measurements was hypothesized to follow Eqn (10). Each bone was indexed by a letter and a number (Fig. 2). For length measurements, the average length of the ulna and radius or tibia and fibula was used to define a length measurement for the forearm and leg bones, respectively. Starting from the tip of the distal phalanx of the third digit (x = 0) six ‘segment intervals’ (Sn*) were defined for length (L) as shown in Fig. 2. The final values for Sn were the values of each Sn* normalized by the value of S6* in an individual's upper or lower limb bone set, the value of S6* being an approximate estimate of total limb length in that individual.
To test for log-periodicity, the natural logarithm of Sn values in each bone set was taken and a linear regression analysis was performed against the node index n for the entire dataset. A preliminary multivariate linear regression analysis was also performed, which included, in addition to the node index n, the parameters of ethnicity (Asian Indian = 1, NZ European = 2), sex (male = 1, female = 2), and limb (upper = 1, lower = 2) as independent descriptors for bone length measures Ln(Lbone). Based on these results (see below) two final regression models of Ln(Lbone) in terms of n were produced with data pooled for ethnicity and sex but separately for limb.
Results
Bone length and volume ratios
Mean values for limb bone lengths and volumes are shown in Table 1 and length : volume ratios in Table 2. Limb bones of New Zealand European origin were significantly longer (P = 0.04) and tended to be larger in volume (P = 0.09) than their Asian Indian counterparts. There were no significant differences between right and left limbs (P = 0.76). CT-derived bone volumes were consistently slightly greater than volumes derived from water displacement: long bones by 3.9–7.5%, metacarpals and metatarsals by 2.3–3.0%, proximal phalanges by 4.5–5.4%, middle phalanges by 2.9–10.4%, and distal phalanges by 13%. ICCs for all measurements were 0.98 or greater, indicating almost perfect intra-rater agreement.
Table 1.
Means and standard deviations (SD) of human limb bones of Asian Indian and New Zealand European origin
| Asian Indian | Humerus | Radius | Ulna | Femur | Tibia | Fibula | MC | PPH | MPH | DPH | MT | PPF | MPF | DPF | |||
|---|---|---|---|---|---|---|---|---|---|---|---|---|---|---|---|---|---|
| Length (mm) | Male (n = 24) | Mean | 307.0 | 237.0 | 253.5 | 425.4 | 353.3 | 348.6 | Male (n = 13) | 65.3 | 43.4 | 27.9 | 18.4 | 67.7 | 26.5 | 11.3 | 9.5 |
| SD | 17.6 | 17.1 | 19.3 | 21.8 | 21.5 | 20.6 | 4.7 | 2.7 | 2.5 | 1.8 | 3.5 | 2.5 | 2.9 | 1.6 | |||
| Female (n = 14) | Mean | 286.6 | 220.3 | 238.9 | 403.6 | 339.9 | 332.6 | Female (n = 9) | 62.4 | 41.6 | 26.5 | 16.8 | 66.1 | 24.6 | 10.5 | 9.4 | |
| SD | 17.2 | 10.7 | 9.8 | 23.3 | 17.6 | 18.4 | 2.2 | 2.6 | 2.4 | 1.3 | 3.0 | 1.5 | 2.9 | 1.0 | |||
| Volume (cm3) | Male (n = 24) | Mean | 144.3 | 38.0 | 44.4 | 388.5 | 250.2 | 41.6 | Male (n = 13) | 5.9 | 3.3 | 1.4 | 0.5 | 5.9 | 1.2 | 0.4 | 0.2 |
| SD | 27.9 | 7.2 | 8.3 | 66.4 | 36.2 | 7.2 | 1.5 | 0.8 | 0.3 | 0.1 | 1.1 | 0.2 | 0.1 | 0.1 | |||
| Female (n = 14) | Mean | 105.2 | 28.6 | 32.0 | 303.0 | 195.1 | 33.1 | Female (n = 9) | 4.7 | 2.6 | 1.1 | 0.4 | 4.5 | 0.9 | 0.3 | 0.2 | |
| SD | 24.8 | 4.9 | 5.7 | 60.6 | 35.2 | 7.5 | 0.5 | 0.4 | 0.1 | 0.1 | 0.4 | 0.2 | 0.1 | 0.1 | |||
| New Zealand European | Humerus | Radius | Ulna | Femur | Tibia | Fibula | MC | PPH | MPH | DPH | MT | PPF | MPF | DPF | ||
|---|---|---|---|---|---|---|---|---|---|---|---|---|---|---|---|---|
| Length (mm) | Male (n = 6) | Mean | 317.1 | 229.2 | 245.8 | 444.3 | 354.9 | 353.3 | 64.9 | 45.2 | 30.4 | 20.4 | 70.5 | 27.4 | 10.7 | 12.3 |
| SD | 24.1 | 23.8 | 22.6 | 34.0 | 29.3 | 28.7 | 5.4 | 4.3 | 2.9 | 2.4 | 6.6 | 3.9 | 2.6 | 1.2 | ||
| Female (n = 2) | Mean | 289.6 | 224.9 | 244.1 | 416.3 | 340.8 | 339.9 | 65 | 43.2 | 29.8 | 20.5 | 66.7 | 26.2 | 10.9 | 289.6 | |
| SD | 4.1 | 3.7 | 2.7 | 1.1 | 0.4 | 0.5 | 3.8 | 0.6 | 0.4 | 1.5 | 0 | 0.2 | 0 | 4.1 | ||
| Volume (cm3) | Male (n = 6) | Mean | 175.3 | 43.6 | 51.0 | 518.1 | 305.7 | 50.6 | 7.3 | 4.3 | 1.9 | 0.7 | 6.4 | 1.3 | 0.5 | 0.3 |
| SD | 56.5 | 14.0 | 15.3 | 124.6 | 67.1 | 11.5 | 2.4 | 1.4 | 0.6 | 0.3 | 1.8 | 0.4 | 0.2 | 0.1 | ||
| Female (n = 2) | Mean | 116.8 | 31.6 | 36.9 | 358.5 | 213.5 | 37.4 | 5.4 | 3.4 | 1.7 | 0.6 | 4.6 | 0.9 | 0.3 | 0.2 | |
| SD | 2.7 | 0.5 | 0.2 | 11.3 | 6.6 | 1.4 | 0.3 | 0.2 | 0.1 | 0 | 0 | 0 | 0 | 0 | ||
DP, distal phalanx, F, foot; H, hand; MC, metacarpal; MP, middle phalanx; MT, metatarsal; NA, not available; PP, proximal phalanx.
Table 2.
Mean length and volume ratios of limb bones of Asian Indian origin
| Length | H:R | H:U | H:mean (R+U) | MC:PPH | MC:sum PH | PPH:MPH | MPH : DPH | F:T | F:mean (T+F) | MT:PPF | MT : sum PF | PPF:MPF | MPF:DPF |
|---|---|---|---|---|---|---|---|---|---|---|---|---|---|
| Male (n = 24) | |||||||||||||
| Mean | 1.30 | 1.22 | 1.26 | 1.50 | 0.73 | 1.56 | 1.52 | 1.21 | 1.21 | 2.57 | 1.45 | 2.45 | 1.19 |
| SD | 0.08 | 0.09 | 0.08 | 0.07 | 0.04 | 0.09 | 0.13 | 0.05 | 0.05 | 0.15 | 0.13 | 0.48 | 0.22 |
| Female (n = 14) | |||||||||||||
| Mean | 1.30 | 1.20 | 1.25 | 1.50 | 0.74 | 1.58 | 1.58 | 1.19 | 1.20 | 2.70 | 1.50 | 2.49 | 1.11 |
| SD | 0.06 | 0.06 | 0.06 | 0.07 | 0.04 | 0.11 | 0.16 | 0.02 | 0.02 | 0.16 | 0.15 | 0.68 | 0.22 |
| Male (n = 24) | |||||||||||||
| Mean | 3.81 | 3.26 | 1.75 | 1.80 | 1.15 | 2.40 | 2.94 | 1.55 | 1.32 | 5.15 | 3.34 | 3.20 | 1.79 |
| SD | 0.42 | 0.28 | 0.15 | 0.13 | 0.09 | 0.30 | 0.62 | 0.12 | 0.09 | 0.52 | 0.31 | 1.19 | 0.60 |
| Female (n = 14) | |||||||||||||
| Mean | 3.65 | 3.27 | 1.72 | 1.80 | 1.14 | 2.33 | 3.00 | 1.55 | 1.33 | 5.48 | 3.37 | 2.93 | 1.52 |
| SD | 0.40 | 0.34 | 0.18 | 0.22 | 0.09 | 0.29 | 0.52 | 0.08 | 0.07 | 1.22 | 0.68 | 1.14 | 0.33 |
DP, distal phalanx; F, foot; F, femur; Fb, fibula; H, hand; H, humerus; MC, metacarpal; MP, middle phalanx; MT, metatarsal; P, phalanges; PP, proximal phalanx; R, radius; T, tibia; U, ulna.
For bones of Asian Indian (AI) origin, the mean length ratio of humerus to ulna and femur to tibia were almost identical for men and women at about 1.2 (Table 3) and showed minimal inter-individual variation (6.6 and 3.3%, respectively). Volume ratios of humerus to ulna were approximately twice that of femur to tibia in both men and women (P < 0.0001) (Table 3). Length and volume ratios were remarkably similar in upper and lower limbs for men and women.
Table 3.
Statistical comparisons of upper and lower limb bone length and volume ratios
| Upper : Lower | |||
|---|---|---|---|
| Male | |||
| Upper limb | Lower limb | Female | P value |
| Length ratios | |||
| Humerus : radius | Femur : tibia | 1.08 | <0.0001 |
| 1.10 | <0.0001 | ||
| Humerus : ulna | 1.01 | 0.65 | |
| 1.01 | 0.45 | ||
| Humerus : mean (radius + ulna) | Femur : mean (tibia + fibula) | 1.03 | 0.035 |
| 1.04 | 0.010 | ||
| Third metacarpal : proximal phalanx | Third metatarsal : proximal phalanx | 0.59 | <0.0001 |
| 0.56 | <0.0001 | ||
| Third metacarpal : sum phalanges | Third metatarsal : sum phalanges | 0.50 | <0.0001 |
| 0.49 | <0.0001 | ||
| Proximal phalanx : distal phalanx | Proximal phalanx : distal phalanx | 0.64 | <0.0001 |
| 0.63 | 0.001 | ||
| Middle phalanx : distal phalanx | Middle phalanx : distal phalanx | 1.27 | <0.0001 |
| 1.43 | <0.0001 | ||
| Volume ratios | |||
| Humerus : radius | Femur : tibia | 2.46 | <0.0001 |
| 2.35 | <0.0001 | ||
| Humerus : ulna | 2.10 | <0.0001 | |
| 2.10 | <0.0001 | ||
| Humerus : mean (radius + ulna) | Femur: mean (tibia + fibula) | 1.33 | <0.0001 |
| 1.29 | <0.0001 | ||
| Third metacarpal : proximal phalanx | Third metatarsal : proximal phalanx | 0.35 | <0.0001 |
| 0.33 | <0.0001 | ||
| Third metacarpal : sum phalanges | Third metatarsal : sum phalanges | 0.34 | <0.0001 |
| 0.34 | <0.0001 | ||
| Proximal phalanx : distal phalanx | Proximal phalanx : distal phalanx | 0.75 | 0.029 |
| 0.80 | 0.146 | ||
| Middle phalanx : distal phalanx | Middle phalanx : distal phalanx | 1.64 | <0.0001 |
| 1.97 | <0.0001 | ||
Power law relationships
Preliminary multivariate linear regression analyses attempting to describe limb bone volumes [Ln(Vbone)] using the descriptive parameters of ethnicity (Asian Indian = 1, NZ European = 2), sex (male = 1, female = 2), limb (upper = 1, lower = 2), and bone length (Ln(Lbone) found that all were statistically significant (P = 0.005 for ethnicity and P < 0.0001 for other parameters). Therefore, separate regression analyses of Ln(Vbone) in terms of Ln(Lbone) were performed on eight subsets of the data: upper and lower limb bones (U and L) in males and females (M and F) of Asian Indian and New Zealand European (AI and NZ) origin. The resulting R2 values, and the power law parameters α and β [see Eqn (5)] resulting from the regression fits are summarized in Table 4 and individual power-law fits to each subgroup are shown in Fig. 3. Power laws accurately described the relationship between bone volume and length, with R2 values ranging from 0.983 to 0.995. Values of power law parameters α and β were distributed over relatively narrow ranges of 0.16–0.23 for α and 1.90–2.02 for β (Table 4).
Table 4.
Regression analysis results, including parameters α and β (see Eqn (5)), describing the power-law relationship between human limb bone volume and length
| Cohort | R2 | α | β | Measures (n) |
|---|---|---|---|---|
| NZF U | 0.995 | 0.18 ± 0.02 | 1.91 ± 0.04 | 12 |
| NZF L | 0.989 | 0.17 ± 0.03 | 2.02 ± 0.07 | 12 |
| NZM U | 0.989 | 0.19 ± 0.02 | 1.97 ± 0.04 | 36 |
| NZM L | 0.983 | 0.23 ± 0.02 | 1.99 ± 0.05 | 36 |
| AIF U | 0.994 | 0.16 ± 0.01 | 1.90 ± 0.02 | 54 |
| AIF L | 0.986 | 0.21 ± 0.02 | 1.92 ± 0.03 | 54 |
| AIM U | 0.993 | 0.16 ± 0.01 | 1.97 ± 0.02 | 78 |
| AIM L | 0.987 | 0.22 ± 0.01 | 1.96 ± 0.03 | 78 |
Fig. 3.
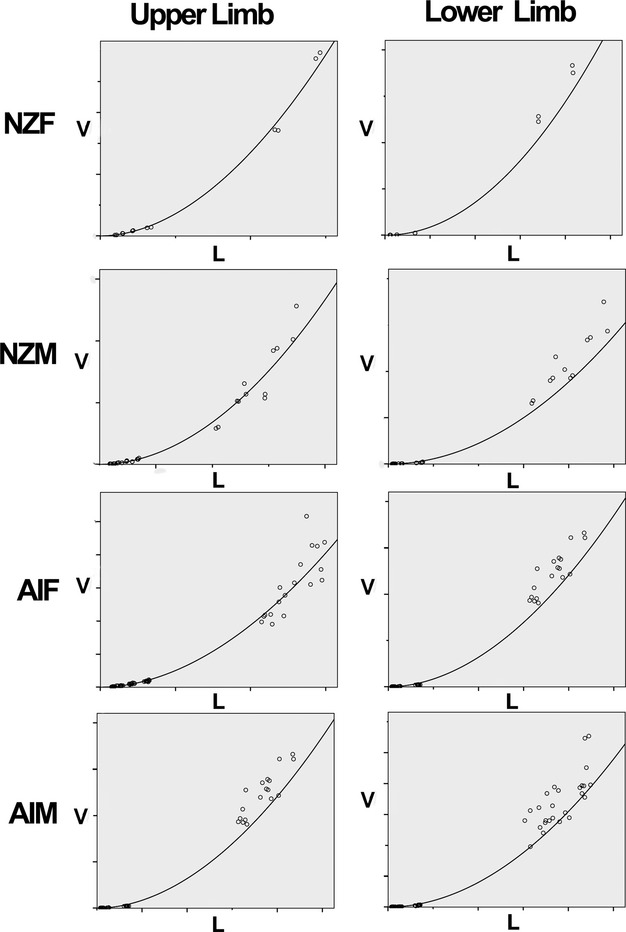
Scatter plots showing power law fits to measures of bone volume (V in cm3) vs. length (L in cm) for upper (left column) and lower (right column) limb bones. Specific parameters for each of these subgroups are summarized in Table 4.
Log-periodic relationships
Preliminary multivariate linear regression analyses found no statistical significance for ethnicity (P = 0.176) or sex (P = 0.669) as descriptors of Ln(Lbone) but highly significant results for node index (P < 0.0001) and limb (P < 0.0001). Therefore, two final regression models of Ln(Lbone) in terms of n were performed with pooled ethnicity and sex but separate limb data. The normalized, cumulative lengths of human long bones and third digit short bones were found to be well described by a log-periodic relationship. This logarithmic periodicity is demonstrated by the strong linear relationship between segment index (n) and the natural logarithm of the normalized segment interval length [Ln(Sn)] after fitting least squares regression lines to the data (Fig. 4). For the upper limb, Sn = (0.716 ± 0.005)n − (4.24 ± 0.02) with R2 = 0.992 and for the lower limb, Sn = (0.932 ± 0.009)n − (5.57 ± 0.03) with R2 = 0.985. Given Eqn (10), these results indicate the upper limb bone lengths follow a log periodic relationship with λ = 0.72, whereas lower limb bone lengths follow a log-periodic relationship, with λ = 0.93. The actual form of the log-periodic functions [following Eqn (9)] corresponding to the parameters obtained from the regression model and applied to human limb bone lengths is shown in Fig. 5.
Fig. 4.
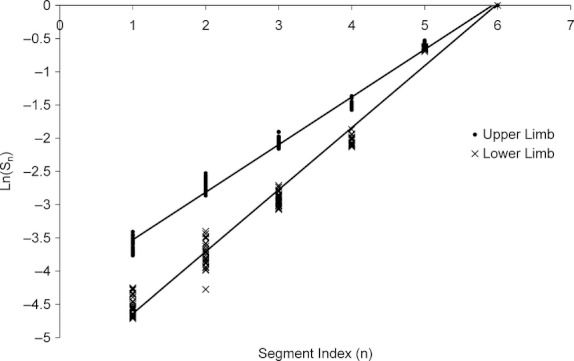
Logarithmic periodicity of human limb bones. A strong linear relationship exists between segment index (n) and the natural logarithm of the normalized segment interval length (Sn), following the equation lnSn = nλ.
Fig. 5.
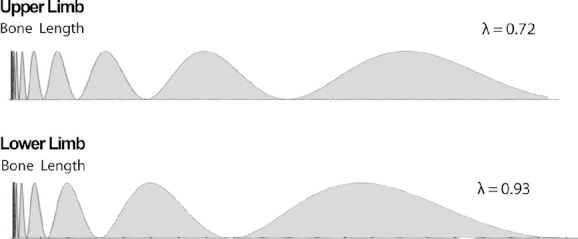
Depiction of the log-periodic function fits to the lengths of limb bones in the human upper and lower limb. The lengths of bones in the upper limb are well described (R2 = 0.992) by the interval sizes of a log-periodic function with λ = 0.72 and lower limb bone lengths by a log-periodic function (R2 = 0.985) with a λ = 0.93. The greater λ value for the lower limb represents a more intensive scaling of each interval.
Discussion
Bone lengths have been studied by anthropologists (Byers et al. 1989; Buikstra & Ubelaker, 1994) and forensic scientists (Mall et al. 2001; Muñoz et al. 2001; Pelin & Duyar, 2003; Hauser et al. 2005) attempting to determine correlations with stature, and by orthopedic specialists (Aydinlioglu et al. 1998; Dogan et al. 2007) with a view to reconstructive surgery and prosthesis design. To our knowledge, only four studies have investigated length ratios in human limb bones with a view to exploring mathematical relationships: two analyzed functional (Hamilton & Dunsmuir, 2002) or actual (Park et al. 2003) bone lengths in the fingers, and two Turkish studies examined relationships between the lengths and widths of metacarpals and phalanges (Aydinlioglu et al. 1998) or metatarsals and phalanges (Dogan et al. 2007). The length ratios observed in the short bones of the hands and feet in our study are very similar to the published data from Turkey derived from radiographs of healthy volunteers (Table 5), suggesting that these ratios are remarkably well conserved. Limb bone volumes have rarely been reported, which may in part reflect methodological challenges. We were able to identify only one other study of human limb bone volumes. Eshak et al. (2011) estimated the volumes of left second and fourth metacarpal bones from CT scans in a study investigating sexual dimorphism but did not attempt to validate their measurements.
Table 5.
Comparison of study data for short bone length ratios with two previous studies
| Length ratio (hand) | Study data | Aydinlioglu et al. (1998) | Length ratio (foot) | Study data | Dogan et al. (2007) |
|---|---|---|---|---|---|
| Third metacarpal : proximal phalanx | 1.49 | 1.41 | Third metatarsal : proximal phalanx | 2.61 | 2.76 |
| Third metacarpal : sum phalanges | 0.72 | 0.69 | Third metatarsal : sum phalanges | 1.45 | 1.51 |
| Proximal phalanx : distal phalanx | 1.54 | 1.57 | Proximal phalanx : distal phalanx | 2.50 | 2.35 |
| Middle phalanx : distal phalanx | 1.53 | 1.56 | Middle phalanx : distal phalanx | 1.08 | 1.07 |
Main findings from this study
Our study found that average length ratios of the main conjoining bones (humerus : ulna compared with femur : tibia) were highly conserved irrespective of load-bearing function. In contrast, bone volume ratios for these same bones were approximately double in the upper limb. Length and volume ratios between equivalent bones in males and females were remarkably similar, indicating a conserved length scaling relationship.
Power laws accurately described the relationship between bone volume and length, with R2 values ranging from 0.983 to 0.995 and values of power law parameters α and β distributed over relatively narrow ranges. The value of α relates to the radial dimension of the bone, which was not measured in this study; in cylindrical bones, higher values of α indicate thicker bones [see Eqn (4)]. The value of β relates to the geometrical character of the bone, approaching 1 in more cylindrical bones and 3 in more spherical bones. Overall, values of α and β tended to be higher in lower limbs, consistent with lower limb bones being thicker and showing greater deviation from cylindrical morphology compared to upper limb bones, as expected for a weight bearing limb. Values of α and β were also higher in New Zealand European bones than in the Asian Indian cohort and in males compared with females, consistent with expected differences in bone morphology.
A striking finding from our study was the existence of highly conserved log-periodic relationships in the short and long bones of the limbs. While log-periodic functions were not statistically significantly different for limb bone lengths between sexes and ethnic groups, values of λ were distinctly different between the upper (λ = 0.72) and lower (λ = 0.93) limbs. As shown in Fig. 5, the greater value of λ in the lower limb represents more intensive scaling of bone length for each segment of the series. Being able to describe human limb bone lengths in terms of a log-periodic function means that only one parameter, the wavelength λ, is needed to explain the proportional configuration of the limb.
Phylogenetic and ontogenetic implications
Log-periodic scaling in human limbs presumably reflects evolutionary selection pressures associated with biomechanical and other factors. It would be interesting to see whether the same relationships are conserved in other tetrapods. Bats, for example, have highly derived forelimbs adapted to flight, with greatly elongated digits relative to other mammals, and it is not immediately apparent how this could be achieved by log-periodic scaling. However, it is known that during embryonic formation, the proportions of bat limbs resemble those of equivalent-stage mice (Sears et al. 2006), and disproportionate growth of forelimb digits correlates with the appearance of a novel interdigital morphogenetic field (Hockman et al. 2008), suggesting modification of the underlying pattern. The log-periodic relationship in human limb bone lengths most likely arises as a result of developmental patterning mechanisms but it is not possible to exclude the possibility that the relationship is derived later by differential growth rates of separate limb elements. This could be explored by measuring precartilage condensations in a model tetrapod such as the chicken. During limb development in tetrapods, cartilage condensations appear within the mesenchyme of the limb bud, marking the future skeletal elements. In most tetrapods the proximal condensations of the stylopod are first to form, as a single element limited to the center of the developing limb. Later, the zeugopod condensations form, most often as two distinct elements, one anterior and one posterior (the radius/ulna or tibia/fibula), and finally the autopod is divided into up to five rays of smaller condensations that make up the digits. Interestingly, the carpal and tarsal bones are not incorporated in this orderly sequence of differentiation and are relatively delayed (Richardson et al. 2004). This type of developmental pattern can be explained by a self-organizing, local activation–lateral inhibition model (Zhu et al. 2010). Lateral inhibition accounts for the increasing number of anteroposterior condensations along the proximal to distal axis, whereas reaction diffusion could account for the relative spacing of these elements along this same axis, which is the subject of this current study.
It is interesting to note that the number of nodes predicted by the log-periodic relationship is theoretically infinite. Further, the number of nodes is not fixed; six nodes can be identified in human limbs although the first digit (thumb/great toe) has only two phalanges and therefore five nodes. In African clawed frogs and chickens, digit IV of the hindlimb has four and five phalanges, respectively (a total of seven and eight nodes). Not only can our analysis explain such variation, it could also account for the hyperphalangy (>10 phalanges on digit II) seen in dolphin forelimbs (Richardson & Oelschläger, 2002).
During limb development, outgrowth of the limb bud is regulated by morphogens of the fibroblast growth factor family (FGFs) from the apical epithelial ridge, the distal-most structure of the limb bud. Decay of the FGF signal is controlled by a two-phase feedback loop involving another morphogen, sonic hedgehog (shh), in the posterior limb bud and gremlin, a diffusible inhibitor of a third family of morphogens, the bone morphogenetic proteins (Verheyden & Sun, 2008). Prolonging the active phase of this loop via topical application of shh morphogen results in formation of an additional phalanx in chickens, rather than increasing the length of the distal phalanx (Dahn & Fallon, 2000). This suggests that node number depends on the action of morphogens during early limb development.
Log-periodic relationships and morphogens
Patterns of morphogens formed by reaction–diffusion mechanisms are hypothesized, and in some cases known, to generate various biological patterns and forms by influencing development and growth (Meinhardt, 1992; Dekanty & Milan, 2011). Differential equations that take into account various chemical and physiological processes operating in a biological system are the foundation of reaction–diffusion theory. A basic differential equation capable of describing a periodic modulation of a phenomenon such as the concentration of a hypothetical morphogen (C) over a spatial range (x) is:
| (11) |
which has general wave solutions:
| (12) |
Here a, b, and ω = 2π/λ, are constants which depend on the initial and boundary conditions of the system being considered. A log-periodic wave occurs by the simple modification of the parameter ω varying as:
| (13) |
which yields the log-periodic solutions:
| (14) |
Solutions to the standard and log-periodic wave equation on a two-dimensional ellipsoidal geometry using a numerical finite element modelling technique confirm the emergence of log-periodic waves for a parameter varying as ω /x instead of a constant ω. This is shown diagrammatically in Fig. 6. Thus, identification of a log-periodic characteristic within human limb bones may ultimately reflect the mathematical form of underlying chemical and physiological mechanisms at play in development. Specific models, such as the reaction–diffusion of a morphogen, can be proposed and tested to better understand growth and developmental processes.
Fig. 6.
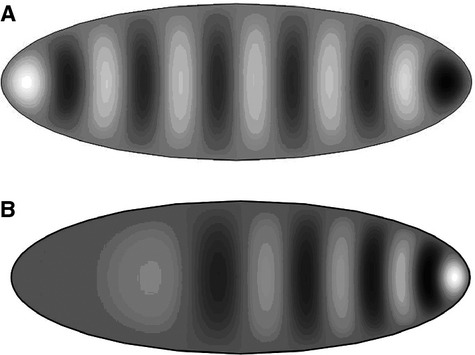
Solutions of the conventional wave equation with constant parameter ω(A) and the log-periodic wave equation with spatially varying parameter ω/x (B) on an ellipsoidal geometry using a numerical finite element analysis technique. The wave height is indicated by colour gradients with white representing peaks and black showing the minima.
Strengths and limitations of the study
Measurement techniques used in this study showed excellent intra-rater reliability. Comparison of CT volumetry with water displacement yielded values within 10% for all bones except the distal phalanges, which, because of their small size, showed greater variance. Attempts to use real bones rather than high-quality plastic replicas created inaccuracies from water permeation despite numerous attempts to seal the bone by wrapping it in plasticine or a thin plastic film (and subtracting the volume of these coverings). Although we did not record inter-observer agreement in our study, the principle of using stereology in sequential CT slices to determine bone volumes has shown excellent inter-rater reproducibility in a previous study of lumbar vertebrae (Odaci et al. 2003). Bone lengths were similar to ranges reported in the literature (Aydinlioglu et al. 1998; Dogan et al. 2007; Yazar et al. 2012). However, our study has some limitations. Sample size was limited by the availability of specimens and the time-consuming nature of volume estimations. Minor degrees of osteoarthritic change were accepted. To simplify the analysis, only the third digits of the hand and foot were studied and carpal and tarsal bones were not included. Considering that the functional lengths of bone segments between consecutive axes of rotation in all fingers show evidence of a log-periodic relationship, other digits in the hand are likely to follow similar scaling relationships (Littler, 1973; Hutchison & Hutchison, 2010). Finally, there are likely to be minor changes in bone volume associated with activity and muscle bulk (Agostini & Ross, 2011), which could not be considered in this study.
Our findings raise many questions of potential practical significance. For example, how are log-periodic relationships disturbed in skeletal dysplasias which affect between 1 in 2000 and 1 in 4000 births and include conditions such as achondroplasia, thanatophoric dysplasia, and achondrogenesis (Orioli et al. 1986)? And to what extent are normal relationships restored by limb-lengthening surgery? In a small group of Korean patients with Turner syndrome, tibia : femur ratio increased from a mean of 0.68 preoperatively to 0.81 after limb lengthening (Hahn et al. 2003) and in a similar European series the ratio increased from 0.76 to 0.81 (Trivella et al. 1996). These values compare with a normal tibia : femur ratio of 0.84 in female Asian Indian skeletons in our study. Restoration of relatively normal tibia : femur ratios may be optimum in terms of limb lengthening but will affect the ratio of long : short lower limb bone lengths, which could have long-term biomechanical consequences.
This study reports relatively simple and highly conserved relationships that describe the scaling of human limb bone lengths and volumes. Using these relationships, models could be constructed and tested from developmental and mechanical perspectives to explore potential advantages gained by specific configurations (specific values of λ). Being able to describe and predict the linear dimensions of human limb bones may assist our understanding of normal and disordered development and growth, estimation of stature, and biomechanics.
Acknowledgments
This research project was supported in part by a University of Otago Health Science Summer Scholarship. We are grateful to the following for their assistance with technical aspects of the research: Chris Smith (Curator, W.D. Trotter Anatomy Museum, University of Otago); Angela Clark (Department of Anatomy, University of Otago); and Jo Young (Otago Radiology).
Conflict of interest
The authors have no conflicts of interest.
Author contributions
Concept /design: Mark Stringer, Alexis Pietak. Data acquisition: Siyan Ma, Mark Stringer. Data analysis/interpretation: Alexis Pietak, Mark Stringer, Siyan Ma. Drafting of the manuscript: Mark Stringer, Alexis Pietak, Siyan Ma. Critical revision: Alexis Pietak, Mark Stringer, Caroline Beck. Approval of final manuscript: all authors.
References
- Agostini GM, Ross AH. The effect of weight on the femur: a cross-sectional analysis. J Forensic Sci. 2011;56:339–343. doi: 10.1111/j.1556-4029.2010.01648.x. [DOI] [PubMed] [Google Scholar]
- Aydinlioglu A, Akpinar F, Tosun N. Mathematical relations between the lengths of the metacarpal bones and phalanges: surgical significance. Tohoku J Exp Med. 1998;185:209–216. doi: 10.1620/tjem.185.209. [DOI] [PubMed] [Google Scholar]
- Buikstra JE, Ubelaker DH. Standards for Data Collection from Human Skeletal Remains. Fayetteville: Arkansas Archaeological Survey Press; 1994. Report No. 44. [Google Scholar]
- Byers S, Akoshima K, Curran B. Determination of adult stature from metatarsal length. Am J Phys Anthropol. 1989;79:275–279. doi: 10.1002/ajpa.1330790303. [DOI] [PubMed] [Google Scholar]
- Dahn RD, Fallon JF. Interdigital regulation of digit identity and homeotic transformation by modulated BMP signaling. Science. 2000;289:438–441. doi: 10.1126/science.289.5478.438. [DOI] [PubMed] [Google Scholar]
- Dekanty A, Milan M. The interplay between morphogens and tissue growth. EMBO Rep. 2011;12:1003–1010. doi: 10.1038/embor.2011.172. [DOI] [PMC free article] [PubMed] [Google Scholar]
- Dogan A, Uslu M, Aydinlioglu A, et al. Morphometric study of the human metatarsals and phalanges. Clin Anat. 2007;20:209–214. doi: 10.1002/ca.20348. [DOI] [PubMed] [Google Scholar]
- Eshak GA, Ahmed HM, Abdel Gawad EA. Gender determination from hand bones length and volume using multidetector computed tomography: a study in Egyptian people. J Forensic Leg Med. 2011;18:246–252. doi: 10.1016/j.jflm.2011.04.005. [DOI] [PubMed] [Google Scholar]
- Gunderson HJ, Bendsten TF, Korbo L, et al. Some new, simple and efficient stereological methods and their use in pathological research and diagnosis. APMIS. 1988;96:379–394. doi: 10.1111/j.1699-0463.1988.tb05320.x. [DOI] [PubMed] [Google Scholar]
- Hahn SB, Park HW, Park HJ, et al. Lower limb lengthening in Turner dwarfism. Yonsei Med J. 2003;44:502–507. doi: 10.3349/ymj.2003.44.3.502. [DOI] [PubMed] [Google Scholar]
- Hamilton R, Dunsmuir RA. Radiographic assessment of the relative lengths of the bones of the fingers of the human hand. J Hand Surg Br. 2002;27:546–548. doi: 10.1054/jhsb.2002.0822. [DOI] [PubMed] [Google Scholar]
- Hauser R, Smoliński J, Gos T. The estimation of stature on the basis of measurements of the femur. Forensic Sci Int. 2005;147:185–190. doi: 10.1016/j.forsciint.2004.09.070. [DOI] [PubMed] [Google Scholar]
- Hockman D, Cretekos CJ, Mason MK, et al. A second wave of Sonic hedgehog expression during the development of the bat limb. Proc Natl Acad Sci U S A. 2008;105:16982–16987. doi: 10.1073/pnas.0805308105. [DOI] [PMC free article] [PubMed] [Google Scholar]
- Hutchison AL, Hutchison RL. Fibonacci, Littler, and the hand: a brief review. Hand (NY) 2010;5:364–368. doi: 10.1007/s11552-010-9268-6. [DOI] [PMC free article] [PubMed] [Google Scholar]
- Kyriakidis I, Papaioannidou P, Pantelidou V, et al. Digit ratios and relation to myocardial infarction in Greek men and women. Gend Med. 2010;7:628–636. doi: 10.1016/j.genm.2010.11.008. [DOI] [PubMed] [Google Scholar]
- Landis JR, Koch GG. The measurement of observer agreement for categorical data. Biometrics. 1977;33:159–174. [PubMed] [Google Scholar]
- Littler JW. On the adaptability of man's hand (with reference to the equiangular curve) Hand. 1973;5:187–191. doi: 10.1016/0072-968x(73)90027-2. [DOI] [PubMed] [Google Scholar]
- Lowrance EW, Latimer HB. Weights and variability of components of the human vertebral column. Anat Rec. 1967;159:83–88. doi: 10.1002/ar.1091590112. [DOI] [PubMed] [Google Scholar]
- Mall G, Hubig M, Büttner A, et al. Sex determination and estimation of stature from the long bones of the arm. Forensic Sci Int. 2001;117:23–30. doi: 10.1016/s0379-0738(00)00445-x. [DOI] [PubMed] [Google Scholar]
- Manning JT, Scutt D, Wilson J, et al. The ratio of 2nd to 4th digit length: a predictor of sperm numbers and concentrations of testosterone, luteinizing hormone and oestrogen. Hum Reprod. 1998;13:300–304. doi: 10.1093/humrep/13.11.3000. [DOI] [PubMed] [Google Scholar]
- Meinhardt H. Pattern formation in biology: a comparison of models and experiments. Rep Prog Phys. 1992;55:797–849. [Google Scholar]
- Muñoz JI, Liñares-Iglesias M, Suárez-Peñaranda JM, et al. Stature estimation from radiographically determined long bone length in a Spanish population sample. J Forensic Sci. 2001;46:363–366. [PubMed] [Google Scholar]
- Odaci E, Sahin B, Sonmez OF, et al. Rapid estimation of the vertebral body volume: a combination of the Cavalieri principle and computed tomography images. Eur J Radiol. 2003;48:316–326. doi: 10.1016/s0720-048x(03)00077-9. [DOI] [PubMed] [Google Scholar]
- Orioli IM, Castilla EE, Barbosa-Neto JG. The birth prevalence ratios for the skeletal dysplasias. J Med Genet. 1986;23:328–332. doi: 10.1136/jmg.23.4.328. [DOI] [PMC free article] [PubMed] [Google Scholar]
- Park AE, Fernandez JJ, Schmedders K, et al. The Fibonacci sequence: Relationship to the human hand. J Hand Surg. 2003;28A:157–160. doi: 10.1053/jhsu.2003.50000. [DOI] [PubMed] [Google Scholar]
- Pelin IC, Duyar I. Estimating stature from tibia length: a comparison of methods. J Forensic Sci. 2003;48:708–712. [PubMed] [Google Scholar]
- Rahman AA, Lophatananon A, Stewart-Brown S, et al. Hand pattern indicates prostate cancer risk. Br J Cancer. 2011;104:175–177. doi: 10.1038/sj.bjc.6605986. [DOI] [PMC free article] [PubMed] [Google Scholar]
- Resnick D. The rebirth of rational morphology: process structuralism's philosophy of biology. Acta Biotheor. 1994;42:1–14. [Google Scholar]
- Richardson MK, Oelschläger HH. Time, pattern, and heterochrony: a study of hyperphalangy in the dolphin embryo flipper. Evol Dev. 2002;4:435–444. doi: 10.1046/j.1525-142x.2002.02032.x. [DOI] [PubMed] [Google Scholar]
- Richardson MK, Jeffery JE, Tabin CJ. Proximodistal patterning of the limb: insights from evolutionary morphology. Evol Dev. 2004;6:1–5. doi: 10.1111/j.1525-142x.2004.04008.x. [DOI] [PubMed] [Google Scholar]
- Ricketts RM. The biologic significance of the divine proportion and Fibonacci series. Am J Orthod. 1982;81:351–370. doi: 10.1016/0002-9416(82)90073-2. [DOI] [PubMed] [Google Scholar]
- Sears KE, Behringer RR, Rasweiler JJ, IV, et al. Development of bat flight: morphologic and molecular evolution of bat wing digits. Proc Natl Acad Sci U S A. 2006;103:6581–6586. doi: 10.1073/pnas.0509716103. [DOI] [PMC free article] [PubMed] [Google Scholar]
- Trivella GP, Brigadoi F, Aldegheri R. Leg lengthening in Turner dwarfism. J Bone Joint Surg Br. 1996;78:290–293. [PubMed] [Google Scholar]
- Ulmer H, Kelleher CC, Dunser MW. George Clooney, the cauliflower, the cardiologist, and phi, the golden ratio. BMJ. 2009;339:b4745. [Google Scholar]
- Verheyden JM, Sun X. An Fgf/Gremlin inhibitory feedback loop triggers termination of limb bud outgrowth. Nature. 2008;454:638–641. doi: 10.1038/nature07085. [DOI] [PMC free article] [PubMed] [Google Scholar]
- Yazar F, Imre N, Battal B, et al. Is there any relation between distal parameters of the femur and its height and width? Surg Radiol Anat. 2012;34:125–132. doi: 10.1007/s00276-011-0847-1. [DOI] [PubMed] [Google Scholar]
- Zhu J, Zhang YT, Alber MS, et al. Bare bones pattern formation: a core regulatory network in varying geometries reproduces major features of vertebrate limb development and evolution. PLoS ONE. 2010;5:e10892. doi: 10.1371/journal.pone.0010892. [DOI] [PMC free article] [PubMed] [Google Scholar]