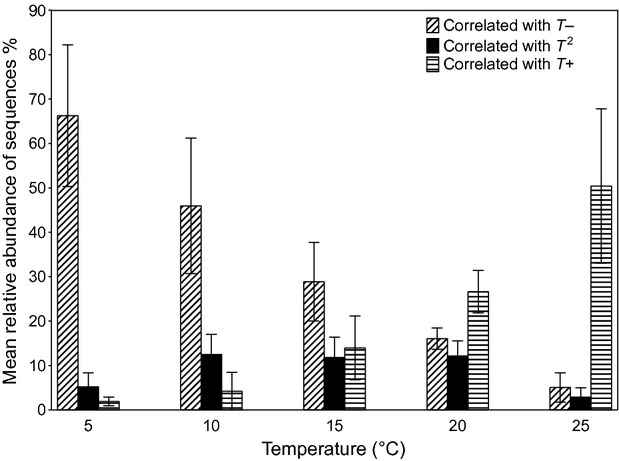
Figure 4.

Cumulative relative abundances of operational taxonomic units (OTUs) that were negatively correlated with temperature (correlated with T−), positively correlated with temperature (correlated with T+), and negatively correlated with the squared temperature term (correlated with T2), that is, showing an unimodal response to temperature. Bars represent the mean of five replicates per temperature level and error bars represent ±95% CI.
