

Abstract
Mutations in PKD1 (85%) or PKD2 (15%) account for almost all cases of autosomal dominant polycystic kidney disease (ADPKD). The ADPKD proteins, termed as polycystin-1 (PC1) and polycystin-2 (PC2), interact via their C-termini to form a receptor–ion channel complex whose function and regulation are not fully understood. Here, we report the first phosphorylated residue (Ser829) in PC2, whose dephosphorylation is mediated by PC1 binding through the recruitment of protein phosphatase-1 alpha (PP1α). Using a new phosphospecific antibody (pPC2) to this site, we demonstrate that Ser829 is phosphorylated by Protein kinase A (PKA) but remains constitutively phosphorylated in cells and tissues lacking PC1. cAMP increased pSer829 basolateral localization in MDCK cells in a time dependent manner and was essential for pronephric development in Xenopus embryos. When constitutively expressed, a complex phenotype associated with enhanced ATP-dependent ER Ca2+ release and loss of growth suppression was observed in cycling cells. These results reveal a reciprocal functional link between PC1 and PC2 which is critically dependent on their interaction. Unopposed cAMP stimulated hyperphosphorylation of PC2 in the absence of functional PC1 could contribute to cyst initiation in PKD1 patients and represents a new molecular paradigm in understanding ADPKD pathogenesis.
INTRODUCTION
Autosomal dominant polycystic kidney disease (ADPKD) is the most common inherited human renal disease and accounts for ∼10% of all patients with end-stage renal disease (ESRD) on renal replacement therapy. It is due to germ-line mutations in PKD1 (85%) or PKD2 (15%). Extrarenal manifestations include liver or pancreas cysts, hypertension, cardiac valvular abnormalities and cerebral aneurysms (1). The genotypes are clinically indistinguishable except that PKD2 patients have a later mean age of onset of hypertension and ESRD (1,2).
The ADPKD proteins, polycystin-1 (PC1) and polycystin-2 (PC2) interact to form a heterodimeric complex in vivo and together regulate key signalling pathways regulating tubular morphogenesis (3). Complex formation requires the obligate formation of PC2 dimers (or trimers) via a C-terminal coiled-coil domain (aa 835–873) followed by PC1 binding through a coiled-coil domain in its C-terminus to a short heterodimerization sequence on PC2 (aa 873–895) (4,5). Two additional dimerization motifs have been reported for PC2 in its N-terminus (aa199–207) and a cysteine (C632) in the third extracellular loop (6,7). These mediate the likely tetramerization of PC2 (or the ion channel TRPP2) to generate non-selective Ca2+ channels. In view of the phenotypic similarity of both patients and animal models, it is highly likely that PC1 and PC2 function together to regulate epithelial morphogenesis.
Analysis of the polycystin proteins has been complicated by their complex and dynamic subcellular localization in epithelial cells which is dependent on cell type, developmental status, differentiation, confluence and quiescence (8). In quiescent cells, PC1 and PC2 can be localized in primary cilia and centrosomes, where a role in mechanosensitive Ca2+ signalling has been reported (9). In dividing cells, PC2 (though not PC1) has been reported to localize at mitotic spindle poles in association with mDia-1 and pericentrin, where its function is thought to regulate intracellular Ca2+ during or after mitosis (10,11). A direct role in cell cycle regulation has also been proposed for PC1 and PC2 through the regulation of the CDK inhibitor p21 (12,13). Both proteins are expressed at or close to the basolateral membrane in confluent cells where they are likely to mediate or regulate cell–cell and cell–matrix adhesion (14–16). PC1 and PC2 may also reconstitute an ER Ca2+ release channel together with the IP3 receptor (4,17,18). Finally, both proteins have been detected in urinary exosomes where a role in urocrine signalling has been postulated (19). Several models for PC1 and PC2 interaction have been proposed based on the current evidence (4). Despite the consensus that the function of the PC1–PC2 complex is critical to understanding their role in disease, we still have an incomplete understanding of how the biological complex is regulated and how it activates specific signalling pathways critical in maintaining tubular morphogenesis.
In this paper, we report that phosphorylation of PC2 at a PKA-catalyzed residue (Ser829) is dynamically regulated by the specific binding of PC1 to recruit and localize protein phosphatase-1 alpha (PP1α). Using a newly generated phospho-specific antibody, we also demonstrate that disruption of this complex by mutagenesis or in disease results in constitutive phosphorylation at Ser829.
RESULTS
PC2 is phosphorylated at Ser829 by PKA
We identified human PC2 peptides phosphorylated on Ser829in vitro (by PKA) and in vivo (HA-PC2 in MDCKI cells) (Fig. 1A). Ser829 is highly conserved to lower vertebrates and showed perfect conservation for a canonical cAMP-dependent protein kinase A (PKA) consensus recognition sequence (RRGS, Fig. 1B). In view of evolutionary conservation and the putative role of cAMP in cystic formation, we decided to study its functional significance in greater detail.
Figure 1.

PC2 is phosphorylated in situ at Ser829 by PKA. (A) LC MS/MS identified PC2 phospho-peptides phosphorylated on Ser829 in two in vitro and one in vivo sample. (B) Multiple ClustalW sequence alignments show that Ser829is conserved among vertebrates and represents a canonical PKA consensus-phosphorylation site (underlined). Accession numbers indicated in brackets. (C) A phospho-specific antibody to pSer829 (pPC2) showed specificity by immunoblot for phosphorylated Ser829. It did not detect a mutant S829A HA-tagged PC2 construct expressed in HEK cells, but showed no change with mutations at other previously recognized sites (S801G, S812A). Total PC2 expression was shown by re-probing with an HA antibody after stripping. (D) PC2 phosphorylation at Ser829 is catalyzed by cAMP and PKA. Transient expression of a PKAα catalytic subunit resulted in a significant increase in endogenous Ser829 phosphorylation in HEK cells. Elevation of cAMP levels resulted in a significant increase in endogenous Ser829 phosphorylation. HEK cells were incubated with forskolin and dbcAMP (100 µM/0.5 mm) for 30 min following overnight serum starvation. PKA inhibition blocked the dbcAMP-stimulated increase in Ser829phosphorylation. HEK cells were pre-treated with PKA inhibitors (10 µm H89, 20μm PKA peptide inhibitor) or DMSO for 4 h prior to incubation with 0.5 mm dbcAMP. Loading of PC2 and actin detected by immunoblotting. (E) HEK cells were treated with control or PKA-specific siRNA specific to PKA. PKA knockdown was monitored with a PKA-specific antibody and was associated with a reduction in endogenous pSer829. (F) Inhibition of PKA/AKAP binding by an Ht31 peptide resulted in a significant decrease in endogenous pSer829. HEK cells were incubated for 48 h with Ht31 (50 µm), a specific AKAP inhibitor peptide or a negative control peptide. A PKA substrate phospho-antibody confirmed the inhibition of other PKA substrates by Ht31. (G) Phosphosite prediction algorithm predicts that Ser829can be phosphorylated by PKA and AurA, which share substrate preferences. Both PKA and Aurora A kinase, but not PrKD1, were able to phosphorylate Ser829 in a recombinant PC2 C-terminal protein (aa 700–968) in vitro. A pPC2 antibody was used to detect Ser829 phosphorylation.
Initial studies using a commercial phospho-PKA substrate-specific antibody which recognizes the sequence RRXS*/T* (RRGS) detected heterologous HA-PC2 (∼110 kDa) in human embryonic kidney (HEK) cells but not a PC2-S829A mutant (Supplementary Material, Fig. S1A). We next generated a phospho-specific antibody to PC2-Ser829 (pPC2), the first to be reported for this protein. This antibody showed high specificity and sensitivity when tested by enzyme-linked immunosorbent assay (ELISA) using the immobilized phosphopeptide immunogen (not shown), recombinant PC2 C-terminal (CT2) protein phosphorylated in vitro by recombinant PKA (Supplementary Material, Fig. S1B) and heterologous expressed full-length HA-PC2 protein by immunofluorescence (Supplementary Material, Fig. S1C). Importantly, mutagenesis at S829A but not at two previously reported adjacent residues (S801G, S812A) abolished antibody recognition in cell extracts (Fig. 1C). Consistently, stimulation of PKA activity either by transfection of a PKA catalytic subunit (PKA-Cα) or by elevating cAMP levels (dbcAMP and forskolin) resulted in enhanced endogenous Ser829 phosphorylation (Fig. 1D). The latter could be blocked by the chemical PKA inhibitor H89 or by the highly specific PKI-inhibitory peptide sequence (PKA inhibitor 14–22 amide) (Fig. 1D). Finally, we found that basal Ser829 phosphorylation decreased after incubation with small interfering RNA (siRNA) to PKA catalytic subunit (Fig. 1E) or by employing a specific A-kinase anchor protein (AKAP) inhibitor (AKAP St-Ht31) compared with irrelevant siRNA or control peptides (Fig. 1F). Our results demonstrate unequivocally that PC2 Ser829 is a potential substrate for PKA.
It was recently reported that Ser829 of PC2 was phosphorylated exclusively by the mitotic kinase AurA, but not by PKA (20). Since the consensus substrate phosphorylation sequence for AurA is extremely similar to that of PKA, we utilized our phospho-specific antibody to demonstrate that both PKA and AurA (but not PrKD1) were able to phosphorylate Ser829 in vitro (Fig. 1G). These results indicate that Ser829 is a potential substrate for both kinases.
Basolateral expression of pSer829 is stimulated by cAMP in a PKA-dependent manner
PC2 proteins have been localized to multiple subcellular compartments, including primary cilia, centrosomes, ER and the basolateral membrane. In renal epithelial cells, its localization or trafficking is regulated by site-specific phosphorylation (Ser812 and Ser76) (21,22).We next examined the localization of endogenous PC2 phosphorylation at Ser829 in a number of epithelial lines to assess whether this modification was specific to a particular compartment in intact cells.
In confluent MDCK II monolayers, Ser829 phosphorylation was localized to the ER and basolateral cell borders where it is co-localized with E-cadherin (Fig. 2A–C). It was also detectable at the mitotic spindle poles in dividing cells but was not localized to primary cilia, unlike total PC2 (Supplementary Material, Fig. S2A-B). Following cAMP stimulation, basolateral expression of pSer829 was significantly increased and decayed in a time-dependent manner (Fig. 2B). ER expression of pSer829 was also increased following cAMP stimulation (Fig. 2C). Plasma membrane localization was blocked by H89 but not by MLN8237, showing that this was PKA-dependent (Fig. 2A). In contrast, spindle pole pSer829 expression was reduced by MLN8237 but not H89, indicating conversely that this was AurA-dependent (data not shown). Antibody specificity was shown by loss of staining following pre-incubation with the immunizing blocking peptide or replacement of the primary antibody with non-immune rabbit IgG (Fig. 2D).
Figure 2.

Basolateral expression of pSer829 is stimulated by cAMP in a PKA-dependent manner. (A) Weak pPC2 staining was detected following 48 h serum starvation. Stimulation with cAMP resulted in a significant increase in basolateral surface staining which co-localized with E-cadherin expression. This was blocked by preincubation with the PKA inhibitor H89 (10 µm) but not the Aurora A inhibitor MLN 8237 (250 nM). Magnification (×60). –Z-stacks (0.25 µm thickness) were deconvolved using Autoquant X software (Media Cybernetics Inc, USA) to show colocalization of pPC2 with E-cadherin at the lateral cell borders in MDCK cells. (B) Following 30 min stimulation with cAMP, the cells were washed, incubated without cAMP and followed for 120 min. Basolateral surface expression of pPC2 decreased in a time-dependent manner, returning to baseline levels at 120 min. Magnification (×60). (C) Weak pPC2 staining colocalized with the ER marker calnexin in subconfluent cells. Stimulation with cAMP resulted in a significant increase in ER staining. Image analysis intensity measurements were carried out using ImageJ (NIH) on multiple fields from eight separate experiments. *P < 0.0001. Magnification (×60). (D) Antibody specificity was shown by pre-incubation with the immunizing blocking peptide used to generate a pPC2 antibody. No visible staining was observed with non-immune rabbit IgG. Image analysis intensity measurements were carried out using ImageJ (NIH, USA) on multiple fields from three separate experiments. *P < 0.0001.
PC2 pSer829 is regulated by PC1 expression and binding
Previous studies from our group and others have shown that PC1 cannot bind to monomers of PC2 but specifically recognizes PC2 oligomers (i.e. dimers or trimers) (4,5). C-terminal PC2 dimerization is mediated by a coiled-coil domain (aa 835–873), though an additional downstream sequence (aa 873–895) is required for PC1 binding. In initial experiments, we found that coiled-coil mutations (4M: V846A, I853A, I860A, L867A) in heterologous HA-PC2 expressed either as a full-length protein (PC2), C-terminal domain (CT2) or with a deletion of the N-terminal domain (PC2 224–968) showed a marked increase in Ser829 phosphorylation (Fig. 3A, Supplementary Material, Fig. S1D).
Figure 3.

PC2 Ser829 phosphorylation is regulated by PC1 expression and binding to PC2. (A) Ser829 phosphorylation was increased in a mutant PC2 construct containing four mutations in the coiled-coil domain (PC2 4M) preventing binding of PC2 to PC1. Loading of total PC2 and actin is shown. A graph below shows quantification of Ser829 phosphorylation as a ratio of pPC2/PC2 band intensity from triplicate wells **P < 0.005. (B) Endogenous Ser829 phosphorylation was increased in Pc1 null (−/−) MEK cells compared with wild-type (+/+) litter mate controls. PC1 expression was detected with a highly specific mAb (7e12). There was no difference in total PC2 or actin expression between both the lines. A graph below shows quantification of Ser829 phosphorylation as a ratio of pPC2/PC2 band intensity from triplicate wells, **P < 0.005. (C) Endogenous Ser829 phosphorylation was lower in PKD1 transgenic cells (M7) compared with control (M8) mouse collecting duct lines. PC1 expression was detected with a highly specific antibody (7e12). There was no difference in total PC2 or actin between both the lines. A graph below shows quantification of Ser829 phosphorylation as a ratio of pPC2/PC2 band intensity from triplicate wells, **P < 0.005. (D) Endogenous Ser829 phosphorylation was significantly higher in a conditionally immortalized human kidney cell line from a PKD1 patient (OX161) compared with a normal control (UCL93). There was no difference in total PC2 or actin between both the lines. A graph below shows quantification of Ser829 phosphorylation as a ratio of pPC2/PC2 band intensity from triplicate wells (**P < 0.005).
To exclude the unlikely possibility that the coiled-coil mutant (4M) proteins had increased accessibility to an AKAP (and hence increased local PKA activation) due to a conformation change induced by mutagenesis, we also examined the expression of Ser829 phosphorylation in Pc1 null cells. As shown, Pc1 null MEK cells also showed a significant increase in endogenous Ser829 phosphorylation compared with wild-type cells (Fig. 3B), whereas PKD1 transgenic cells (M7) showed a reduction in endogenous Ser829 phosphorylation compared with cells from litter mate controls (M8) (Fig. 3C). These findings led us to conclude that PC1 expression levels regulate pSer829 levels and that PC1 binding to PC2 was critical in mediating this regulation. Ser829 is located just proximal to the predicted coiled-coil domain (CC2, aa 835–873), which is essential for C-terminal dimerization of PC2 and PC1 binding (4). Interestingly, the PC2 phosphorylation status at Ser829 did not affect the ability of PC2 to oligomerize or bind to PC1 in co-IP experiments (3,4,7) (Supplementary Material, Fig. S3A, B).
We confirmed these findings in human cystic cell lines and ADPKD renal tissue. PC2 Ser829 phosphorylation was significantly increased in a PC1 null human PKD1 cystic line (OX161) compared to a control line (UCL93) despite normal levels of PC2 (Fig. 3D). OX161 has been shown to express both germ-line (E1537X) and somatic (402delG) truncating PKD1 mutations and is therefore null for PC1expression (23). Similarly, pSer829 immunostaining was increased in cyst lining cells and in the interstitium surrounding cysts in human PKD1 end-stage kidney tissue (n = 6) (Fig. 4A and C). We also examined cystic and normal mouse tissue derived from an inducible kidney-specific Pkd1 mutant (iKsp-Pkd1del) (24) due to the better quality of tissue preservation compared with human archival tissue. These findings confirmed that similar to human tissue, PC2 Ser829 phosphorylation was significantly higher in cystic mouse tissue (Fig. 4B and D).
Figure 4.
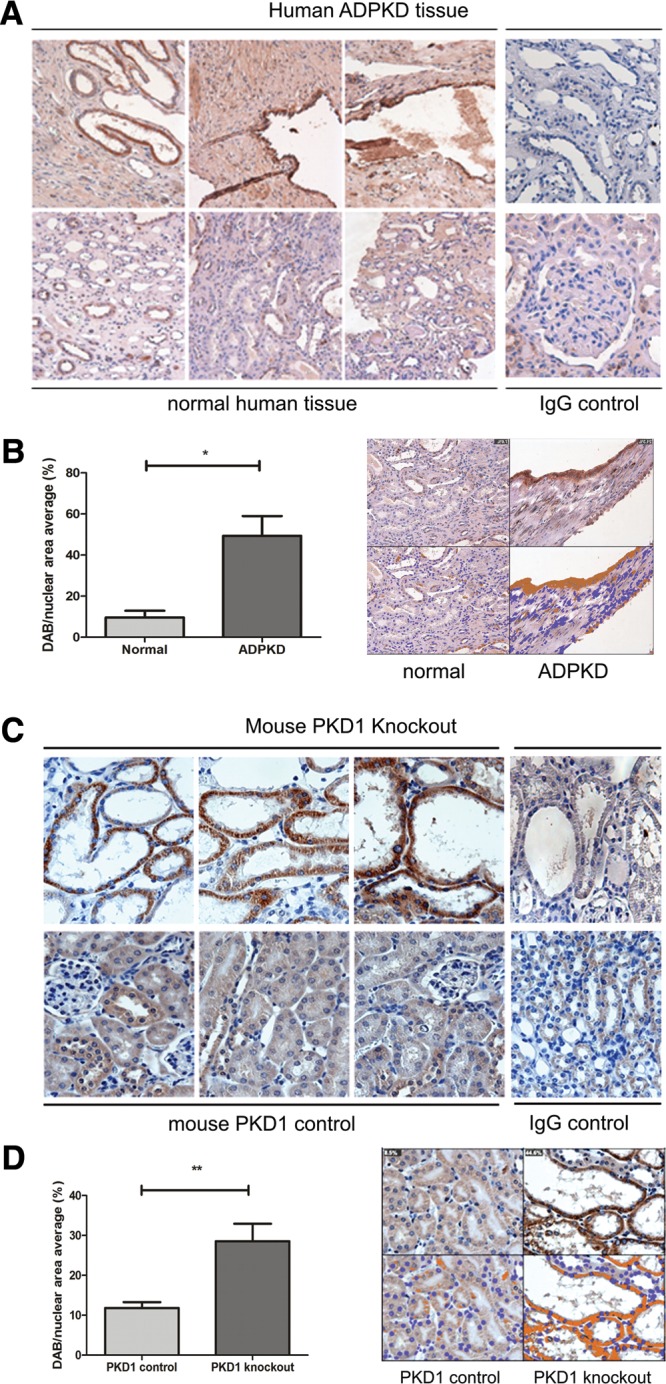
pSer829 is increased in PKD1 disease kidney tissue. (A) Archival nephrectomy tissue sections were obtained from controls and ADPKD patients with defined pathogenic PKD1 mutations (53). Increased pSer829 staining was observed in areas surrounding cysts and in cyst lining cells. Positive staining was detectable but significantly lower in control tissue and some weak non-specific staining was present in normal and ADPKD sections incubated with non-immune rabbit serum (IgG control). Magnification (×20). (B) Kidney tissue from untreated and tamoxifen-treated iKsp-Pkd1del mice was stained with pPC2. Strong staining for pSer829 was seen in the cyst lining epithelium in tamoxifen-treated animals. In untreated mice, weak staining for pSer829 was observed in the normal tubular lining. Some weak non-specific staining was present in control and PKD1 knockout sections incubated with non-immune rabbit serum (IgG control). Magnification (×20). (C) Image analysis was performed on control (n = 3) and PKD1 patient (n = 6) nephrectomy tissue using the Image J Immunoratio plug-in following immunohistochemistry with a pPC2 antibody. A significant increase in DAB-positive staining was seen in ADPKD tissue represented by the average percentage DAB/nuclear area (N = 9.6 ± 3.3%, ADPKD = 49.4 ± 9.6%; n = 3–6), *P < 0.01. (D) Image analysis was performed on control and Pkd1del cystic tissue using the ImageJ Immunoratio plug-in following immunohistochemistry with pPC2 antibody. A significant increase in DAB-positive staining was seen in Pkd1 null tissue represented by the average percentage DAB/nuclear area (N = 11.8 ± 1.4%, PKD1 = 28.6 ± 4.4%; n = 6) (**P < 0.005).
PP1α binds to the C-terminus of PC1 and dephosphorylates PC2 at Ser829
The increase in Ser829 phosphorylation observed in the absence of PC1 expression or binding to PC2 led us to postulate two possible explanations. First that PC1 was critical in binding to and localizing a protein phosphatase that could dephosphorylate pSer829. Alternatively, PC1 binding to PC2 could compete with an adaptor protein (e.g. an AKAP) and thus its removal could enhance access of the active kinase (PKA) to PC2, stimulating phosphorylation at Ser829. To distinguish between these two possibilities, we studied the temporal expression of pSer829 following transient cAMP stimulation in MEK cells expressing or lacking PC1. In wild-type cells, the pSer829 signal peaked at 5 min and rapidly declined (Fig. 5A). In contrast, null cells displayed higher constitutive Ser829 expression. These results indicated that an inability to dephosphorylate pSer829 rather than an increase in localized PKA activity was a more likely explanation for the persistence in Ser829 phosphorylation.
Figure 5.

PP1α forms a complex with PC1 and dephosphorylates pSer829. (A) Pc1 null MEK cells show a defect in dephosphorylation following dbcAMP stimulation. Wild-type (+/+) and Pc1 null (−/−) MEK cells were serum starved for 24 h (control), incubated with dbcAMP (30 min), washed and followed for 120 min. In wild-type cells, basal pSer829 was low, peaked at 5 min and returned to baseline after 120 min. In contrast, Pc1 null cells had a much higher basal level of pSer829, which did not change significantly throughout the experimental time course. There was no difference in total PC2 expression between both lines. PC1 expression was absent from the MEK (−/−) cells as expected. A graph shows quantification of Ser829 phosphorylation as a ratio of pPC2/PC2 band intensity from triplicate wells. (B) PP1 and PP2A, but not PP2B, can dephosphorylate pSer829 following PKA phosphorylation in vitro. A dephosphorylation assay was carried out using a recombinant GST-CT2 fusion protein (680–968aa) and active PP1, PP2A or PP2B over 2 h. Ser829 phosphorylation was detected with pPC2 and total CT2 with G20. (C) Endogenous Ser829 phosphorylation increases following chemical inhibition of PP1 or PP2A but not PP2B. HEK cells were treated with 100 nm okadaic acid (PP1, PP2A and others), 1 µm tautomycin (PP1) or 1 µm cyclosporine A (PP2B) for 5 h. There was a significant increase in Ser829 phosphorylation in cells treated with okadaic acid and tautomycin with a greater increase seen in the former. Equivalent loading of total PC2 is shown. (D) Heterologous PP1 dephosphorylates endogenous pSer829 following dbcAMP stimulation in HEK cells. A clear reduction in Ser829 phosphorylation was observed in HA-PP1α expressing cells compared with pcDNA3 controls. Equivalent loading was shown by total PC2 and actin. (E) Heterologous expression of a chimeric protein containing the PC1 C-terminus (Tac-CT1-myc) is sufficient to inhibit Ser829 phosphorylation. HEK cells were co-transfected with HA-PC2 and Tac-CT1-myc or mutant Tac-CT1 constructs. A significant reduction in Ser829 phosphorylation was observed in Tac-CT1-myc expressing cells compared with cells transfected with a Tac-MCOLN control. PC1 mutations previously shown to abolish PC2 binding (R4227X) or predicted to abolish a putative PP1-binding motif in CT1 (F4155V) either singly or in combination (R4227X/F4155V) exhibited no significant effect on Ser829 phosphorylation. Equivalent loading was confirmed for total PC2 and actin. A graph below shows quantification of Ser829 phosphorylation as a ratio of pPC2/PC2 band intensity from triplicate wells, **P < 0.005. (F) A CT1 truncation mutant (R4227X) can still bind to PP1α. Co-IP experiments with Tac-CT1-myc and Tac CT1-R4227X-myc showed that both could bind to HA-PP1α in co-IP assays. This suggests that the PP1 binding sequence in CT1 must lie upstream of R4227. A putative PP1 binding motif (KVRF) is present in PC1 (aa 4152–4155). A reported missense mutation at this motif (F4155V) had no effect on the binding of CT1 to PP1α by co-IP.
To help identify the protein phosphatase activity responsible for dephosphorylating pSer829, in vitro and in vivo experiments were performed. Using a recombinant GST-CT2 protein phosphorylated at Ser829 as a substrate, we found that PP1α and PP2A, but not PP2B, could dephosphorylate this site in vitro (Fig. 5B). Consistently, the selective inhibition of endogenous PP1, PP2A or PP2B using the PP1 inhibitor tautomycin and the PP1/PP2A inhibitor okadaic acid but not the PP2B inhibitor cyclosporine A increased Ser829 phosphorylation in HEK cells (25,26) (Fig. 5C).
Since PKA phosphorylated proteins are often dephosphorylated by PP1 and AKAPs are known to co-localize PKA and PP1 to specific subcellular locations, we decided to investigate the role of PP1α in dephosphorylating pSer829 in greater detail (27–29). In cAMP-stimulated cells, over-expression of PP1α resulted in a significant decrease in endogenous Ser829 phosphorylation compared with mock transfectants (Fig. 5D). We reasoned that the PC1 C-terminus alone could dephosphorylate pSer829 by recruiting endogenous PP1. Indeed, expression of a PC1 C-terminal (CT1, 4107–4303 aa) chimeric protein fused to the luminal and transmembrane domains of the IL-2 receptor (Tac-CT1) at the plasma membrane led to a significant reduction in Ser829 phosphorylation (Fig. 5E). The PC1 mutant Tac-CT1-R4227X, which cannot bind to PC2, or a naturally occurring missense mutation (Tac-CT1-F4155V) (PKD Mutation Database, Mayo Clinic, http://pkdb.mayo.edu/) (30), predicted to disrupt a PP1α consensus recognition sequence (RVxF) (31) did not significantly alter Ser829 phosphorylation compared with Tac alone (Fig. 5E). These results confirm that direct binding of PC1 to PC2 and the presence of a CT1 PP1α recognition sequence are required for Ser829 dephosphorylation. Finally, we confirmed that Tac-CT1 was sufficient to bind PP1 by co-IP and that Tac-CT1-R4227X and Tac-CT1-F4155V could still bind to PP1, suggesting that the PP1 binding sequence in PC1 must be upstream of R4227 and/or involve several motifs (Fig. 5F) as has also been suggested by a recent paper (31). Nonetheless, our data indicate that dephosphorylation at Ser829 requires the formation of a PC1–PC2 complex and this is sufficient to recruit and localize PP1.
A S829D phosphomimic mutant shows increased ATP-stimulated Ca2+transients compared with wild-type PC2
The functional consequences of constitutive Ser829 phosphorylation for cystogenesis were investigated using Ca2+ release assays. PC2 has been shown to be both a flow-sensitive channel in primary cilia and an ER Ca2+ release channel, with both these functions requiring a tight association with PC1 (4,9). We speculated that mimicking Ser829 phosphorylation by stable expression of a S829D mutant might also alter its channel properties. ATP-induced Ca2+ transients are likely to reflect the activity of an ER PC1-PC2-IP3R ion channel complex reflecting Ca2+-induced Ca2+release (4,32).
In HEK cells, expression of wild-type PC2 or S829A resulted in an increase in the amplitude of ATP-induced Ca2+transients compared with mock transfected cells or a channel dead mutant, D511V, as previously reported (6) (Fig. 6A). Strikingly, S829D expression led to a further increase in the amplitude of ATP-induced Ca2+release compared with wild-type PC2. These results were replicated in stably transfected MDCK I cells, which do not express primary cilia, confirming that these responses most likely represent ER Ca2+ release (33) (Fig. 6B).
Figure 6.

Effect of a S829D phosphomimic mutation on ATP induced calcium release. (A) S829D-transfected HEK cells express higher amplitude Ca2+ transients following ATP (10 μm) stimulation. Ca2+ transients were measured as 340/380 nm ratio in Fura2/AM loaded cells. Each trace represents mean ± SEM values for more than 50 cells. The area under the curve (AUC) was calculated from the results of three independent experiments. PC2 and S829A cells differed significantly from pcDNA3 (control) and D511V transfected cells. S829D transfected cells showed an even larger increase compared to cells expressing wild-type PC2. **P < 0.005. (B) Similar experiments studying ATP-induced Ca2+ transients in stably transfected MDCK I cells using radiometric Ca2+ imaging. Each trace represents mean ± SEM values for >50 cells. AUC was calculated from three independent experiments. S829D expressing cells showed a significantly greater increase in ATP-induced Ca2+ transients compared with cells expressing wild-type PC2 (***P < 0.005).
A S829D phosphomimic mutant shows loss of growth suppression compared with wild-type PC2
In previous studies, we and others had shown that heterologous expression of wild-type PC2 inhibited cell proliferation via a number of cellular pathways (13,33–35). Inducible expression of wild-type PC2 in a stable MDCK I clone led to a slowing of cell growth only upon induction (Fig. 7A and B). A S829A clone behaved similarly to wild-type PC2 but strikingly a S829D clone did not express this inhibitory phenotype and had a proliferation rate similar to mock transfected cells (Fig. 7A and B). Cell cycle analysis confirmed that there was a significant reduction in the percentage of cells in S/G2 in wild-type PC2 expressing cells accompanied by a corresponding increase in G1 (Fig. 7C and D). However, cells expressing S829D showed no difference from mock transfectants, while S829A cells exhibited an intermediate phenotype. These results suggest that persistence of Ser829 phosphorylation may uncouple the ability of PC2 to regulate cell cycle progression, and are consistent with the observations of increased S-phase entry in Pkd1 null MEK cells or PKD1 depleted cells (36,37).
Figure 7.

Effect of an inducible S829D phosphomimic mutation on cell proliferation and the cell cycle. (A) Expression of HA-PC2 in MDCK I cells was induced following incubation with 1 μg/ml tetracycline for 24 h as shown by immunofluorescence (red, Bar = 25 μm) or immunoblotting with an anti-HA antibody. Equal induction of wild-type, S829A and S829D expression was observed by both the methods. Magnification (×60). (B) Expression of wild-type or S829A but not S829D inhibits MDCK cell growth following tetracycline induction. Cells were counted daily for up to 4 days after plating and grown in normal growth media. Compared with mock transfectants, MDCK cells expressing PC2 or S829A showed a significant slowing of growth but this inhibitory effect was lost in S829D expressing cells. Cell numbers were unchanged in the absence of tetracycline. (C, D) Expression of wild-type PC2 but not S829D leads to G1/S arrest. Cell cycle analysis was performed in MDCK I clones following tetracycline induction (24 h). Typical traces for each line are shown in (C) The percentage of cells in G1 was significantly increased and the number of cells in S/G2 correspondingly reduced in cells expressing wild-type PC2 compared with S829D (** P < 0.01, n = 9). S829A showed an intermediate phenotype between wild-type and S829D but was significantly different from wild-type (*P < 0.05).
Phosphorylation of PC2 at Ser829 is necessary to rescue a Pkd2 knockdown phenotype in the Xenopus pronephros
To address the in vivo relevance of pSer829, we turned to an amphibian model of PKD2 (38) and examined the potential of different PC2 proteins to rescue the defects caused by loss of PC2. Following a previously reported strategy, Nbc1 expression in the late distal tubule of the Xenopus pronephros was examined by whole mount in situ hybridization (38,39). Although loss of Nbc1 is just one aspect of the PKD phenotype in Xenopus, it allows a quantitative functional assessment of different mutant human PC2 proteins in vivo. As previously reported (Tran et al., 2010), Nbc1 expression in the late distal tubule was lost upon injection of Pkd2-MO and re-expressed upon injection of PKD2 mRNA (Fig. 8A–C and G). Of the two-point mutation constructs analysed, only PKD2(S829D) mimicked the effects of wild-type PKD2 and induced re-expression of Nbc1 mRNA (Fig. 8D and G); the second construct, PKD2(S829A), displayed only background levels of asymmetric Nbc1 expression similar to embryos injected with Pkd2-MO only (Fig. 8E and G). Finally, the observed effects were totally dependent on channel activity, since the channel-dead PC2 mutant, PKD2 (D511V), did not rescue activity in vivo (Fig. 8F and G).
Figure 8.

In vivo mutant analysis using Xenopus Pronephros. (A–F). Analysis of the expression of Nbc1 in the late distal tubule at stage 39 by whole mount in situ hybridization of un-injected control embryos, embryos injected radially with Pkd2-MO in the presence or absence of a single injection of 2ng PKD2, PKD2 (S829D), PKD2 (S829A) or PKD2 (D511V) mRNA. (G) Quantification of the expression of Nbc1 in the late distal tubule from A-F; unilateral expression rescued by co-injected mRNA is depicted; numbers of embryos analysed is indicated above the individual bars.
DISCUSSION
In this paper, we report the first serine residue (Ser829) in PC2 whose phosphorylation status is dynamically regulated by the binding of PC1 through the recruitment of PP1. Truncating mutations in PKD1 result in the constitutive phosphorylation of Ser829, in part due to the loss of binding between PC1 and PC2 and the concomitant mislocalization of PP1 dephosphorylation activity. We demonstrate that Ser829 hyperphosphorylation is not just a marker of PC1 inactivation, but may have direct functional cellular consequences for the development of the cystic phenotype in PKD1 patients.
During the course of this study, phosphorylation of PC2 at Ser829 was reported in three global phospho-proteomic screens from murine cells and tissues (40–42) (Table 1). These results confirm the likely physiological relevance of Ser829 phosphorylation. In addition, these and other phospho-proteomic screens (43–47) have also revealed the presence of multiple phosphorylated sites in PC2, including some previously identified through biochemical screens (Ser76, Ser812) (22,48) (Table 1). Although the functional consequence of most of these events is unknown, they reveal that PC2 phosphorylation is common and represents an important regulatory mechanism for modifying its biological functions.
Table 1.
List of reported phosphorylation sites in PC2. A summary of all reported phosphorylation sites in PC2, combining biochemical analysis and proteomic-driven mass spectrometry of cell lysates
| Residue | Kinase | Species/cell line | Methodology | Function | Reference |
|---|---|---|---|---|---|
| S74 | Unknown | Mouse tissue | Proteomic screen | Unknown | Huttlin et al. (42) |
| S76 | GSK3 | Human PC2 Mouse tissue |
Biochemistry/site-directed mutagenesis Proteomic screen |
PC2 trafficking Unknown |
Streets et al. (22) Huttlin et al. (42) |
| S166 | Unknown | HeLa cells | Proteomic screen | Unknown | Olsen et al. (44) |
| S254 | Unknown | HEK 293T cells | Proteomic screen | Unknown | Molina et al. (43) |
| T260 | Unknown | HEK 293T cells | Proteomic screen | Unknown | Molina et al. (43) |
| S263 | Unknown | HEK 293T cells | Proteomic screen | Unknown | Molina et al. (43) |
| S801 | PrKD1 | Human PC2 | Biochemistry/site-directed mutagenesis/ phospho-serine antibody mapping | Cell proliferation calcium channel regulation |
Streets et al. (33) |
| S808 | Unknown | Mouse tissue | Proteomic screen | Unknown | Huttlin et al. (42) |
| S812 | CKII | Human PC2 Human PC2 Mouse tissue Mouse cells Mouse cells Mouse tissue |
Biochemistry/site-directed mutagenesis Biochemistry Proteomic screen Proteomic screen Proteomic screen Proteomic screen |
Calcium channel regulation PC2 trafficking Unknown Unknown Unknown Unknown |
Cai et al. (48) Kottgen et al. (21) Huttlin et al. (42) Yu et al. (40) Li et al. (47) Zanivan et al. (46) |
| S829 | AuroraA PKA |
HEK 293 Mouse tissue Mouse cells Mouse cells Human cells and tissue |
Biochemistry/site-directed mutagenesis/
phospho-serine antibody mapping Proteomic screen Proteomic screenProteomic screen Biochemistry/site-directed mutagenesis/ phospho-serine antibody mapping |
Calcium channel regulation (indirect) Unknown Unknown Unknown Calcium channel regulation/cell proliferation |
Plotnikova et al. (20) Huttlin et al. (42) Hsu et al. (41) Yu et al. (40) This study |
| S831 | Unknown | Mouse tissue Mouse cells |
Proteomic screen Proteomic screen |
Unknown Unknown |
Huttlin et al. (42) Hsu et al. (41) |
| S832 | Unknown | Mouse tissue Mouse cells |
Proteomic screen Proteomic screen |
Unknown Unknown |
Huttlin et al. (42) Hsu et al. (41) |
| S835 | Unknown | Mouse tissue | Proteomic screen | Unknown | Huttlin et al. (42) |
| S852 | Unknown | HEK 293T | Proteomic screen | Unknown | Molina et al. (43) |
| S858 | Unknown | HEK 293T | Proteomic screen | Unknown | Molina et al. (43) |
| T931 | Unknown | Rat tissue | Proteomic screen | Unknown | Hoffert et al. (45) |
| S943 | Unknown | Rat tissue | Proteomic screen | Unknown | Hoffert et al. (45) |
| S944 | Unknown | Rat tissue | Proteomic screen | Unknown | Hoffert et al. (45) |
By in silico analysis, Ser829 conformed perfectly to canonical PKA and Aurora A recognition sequences. With respect to PKA, there is strong evidence that increased cAMP levels are a common feature of the cystic phenotype in both cellular and animal models of PKD including PKD1 mutants. Increased cAMP concentrations drive cell proliferation and stimulate fluid secretion in cystic cells (49). Our data suggest that Ser829 is likely to be a physiological PKA substrate in the kidney and elsewhere. The sequence around Ser829 is highly evolutionarily conserved and Ser829 phosphorylation exhibits functional significance in Xenopus pronephric development in vivo. In previous studies, Nbc-1 expression in the Xenopus late distal tubule was shown to be dependent on Pc2 expression and function (38). Our results extend these findings by demonstrating that phosphorylation at Ser829 is required for this Pc2-specific function in vivo.
In PC1 null cells, it is feasible that the increase in Ser829 phosphorylation results from increased PKA activity due to elevated cAMP concentrations. In a recent paper, the absence of primary cilia in Kif3a null cells was linked to an overall increase in cAMP levels potentially due to a disruption in a ciliary PC2/PKA complex which regulates cAMP production (45). We found no difference in Ser829 phosphorylation between cells unable to form primary cilia (Kif3a null) and wild-type cells, confirming that Ser829 phosphorylation is likely to be regulated in compartments outside primary cilia (data not shown). In this regard, our data indicate an alternative pathway by which cAMP might play a direct role in the development of a cystic phenotype in PKD1 patients.
Ser829 was also recently identified as a candidate site for AurA phosphorylation. The authors proposed a non-canonical role for AurA phosphorylation in inhibiting PC2-mediated ER Ca2+ release (20). The authors also claimed that Ser829 could not function as a PKA substrate. However, given the perfect PKA consensus for phosphorylation at Ser829 and our new cellular data, we propose a more complex situation in which AurA and PKA can catalyze the phosphorylation of this site, albeit in different cellular compartments and during different phases of the cell cycle. During mitosis, pSer829 is located at mitotic spindle poles where AurA appears to be the responsible kinase. During interphase, pSer829 is increased at the ER and the basolateral surface and this expression is dependent on PKA. The precise function of PC2 at the mitotic spindle pole is unclear. Possible roles include regulating Ca2+ release during (or after) mitosis and/or ensuring symmetric segregation of PC2 to daughter cells during cell division (10).
The finding that PC1 expression and binding to PC2 were essential for pSer829 dephosphorylation was unexpected. Although a role for PP2A was not addressed in this manuscript, our data provide compelling evidence that PP1 plays the major enzymatic role in this process. Moreover, PP1 activity requires the binding of PC1 to PC2, since the PC1 truncation mutant (R4227X) which cannot bind PC2 but still bound PP1 was defective in dephosphorylating Ser829. The precise binding motif for PP1 association with PC1 is uncertain, and multiple sequence variations are known (51). Indeed, a putative PP1 recognition sequence (RVxF) in the PC1 C-terminus can be identified and was recently reported to be essential for binding PP1α (31). In agreement with their results which showed that a mutation in this motif (F4145V) reduced the ability of PP1α to dephosphorylate the PKA phosphorylated C-terminus of murine PC1 in vitro, we found that the equivalent missense human mutation at this site (F4155V) did not reduce Ser829 phosphorylation in vivo.
Constitutive phosphorylation of Ser829 may not be just a marker of PKD1 mutation but could directly contribute to the cystic phenotype. We observed a significant increase in ATP-induced Ca2+ transients in S829D expressing cells. The most likely explanation is that phosphorylation at Ser829 increases the affinity of an activator protein or decreases the affinity of an inhibitory protein. While the nature of this protein is still unknown, the resulting changes in intracellular Ca2+ would probably lead to changes in other signalling cascades and/or gene expression. The molecular basis of these findings requires further investigation. These results initially seem to be at odds with those previously reported for AurA inhibitors on AVP-stimulated PC2-mediated ER Ca2+ release (20). However, our results are not directly comparable since the authors were unable to study the direct effect of a S829A mutation on AVP-stimulated ER Ca2+ release apparently due to cell death and did not report the effect of a S829D mutation (20). We did not observe any effect on cell viability of either mutation in MDCK I stable lines possibly due to the use of an inducible expression system (Fig. 7). Potentially the effects of AurA inhibition could be indirect or also alter other Aur A phosphorylated residues in PC2. Certainly other residues in PC2 conforming to PKA/AurA consensus sequences have been reported (Table 1). The current paradigm of disease pathogenesis in ADPKD postulates that the consequence of mutation in PC1 or PC2 leads to an overall lowering of intracellular Ca2+ resulting in an increase in cAMP concentrations due to released inhibition of Ca2+-sensitive adenylate cyclases and/or stimulation of Ca2+ sensitive phosphodiesterases. However, the precise abnormalities in Ca2+ homeostasis are complex with reported changes in mechanosensory cilia-stimulated Ca2+ transients, store-operated currents, IP3 stimulated ER Ca2+ release as well as ligand-activated plasma membrane currents (9,18,52,53). Our data implying an increase in ER Ca2+ release due to PC2 Ser829 phosphorylation could apply to localised ER microdomains as has been described during mitosis (54).
Cells stably expressing a phosphomimic mutant (S829D) showed a loss of the growth suppression phenotype seen with wild-type PC2. The cells expressing wild-type PC2 appear to have a delay in G1/S transit leading to a reduction in cells in S/G2. Previous studies in Pkd1 null MEK cells, PKD1 depleted cells or PC2 overexpressing cells have shown that both PC1 and PC2 regulate G1/S transit (13,36,37). Our data suggests that cell cycle progression at G1/S is partially dependent on dephosphorylation at Ser829.
In conclusion, we propose a new paradigm for understanding the complex pathogenesis of ADPKD which involves a balance between the phosphorylation and dephosphorylation of PC2 at Ser829 involving PKA and PP1 (Fig. 9). A similar scenario could apply to AurA-mediated phosphorylation at Ser829. Finally, it is noteworthy that PC2 can be phosphorylated at multiple sites in its C-terminal domain. As such, it is possible that the other residues may be similarly regulated by PC1 binding and co-operate or inhibit Ser829. This merits further investigation.
Figure 9.

Model of dynamic and complex regulation at Ser829 by PKA, PC1 and PP1. In normal cells, PC1 forms a complex with PC2 and PP1, which acts to maintain PC2 in a dephosphorylated state at Ser829. Activation of PKA by intracellular cAMP results in Ser829 phosphorylation. This is transient since PKA activity decreases alongside a fall in cAMP concentration and PP1 acts to dephosphorylate Ser829. In ADPKD cells with PKD1 mutations, increased intracellular levels of cAMP lead to prolonged PKA activation. Coupled with loss of PC1-localized PP1 activity, this could result in persistent phosphorylation at Ser829.
MATERIALS AND METHODS
Materials
All chemicals were purchased from Sigma Chemical (Poole, Dorset, UK), unless otherwise stated. Cell lines were obtained from the following: MDCK I FRT line (O. Frohlich, Emory University, Atlanta), wild-type and Pc1 null MEK cells (J. Zhou, Harvard Medical School, Boston) and Kif3a wild-type and null cells (P. Igarashi, University of Texas South Western, Dallas). Generation of conditionally immortalized human cell lines (OX161 and UCL93) and murine cell lines (M7 and M8) has been previously reported (3,23).
The PC2 C-terminal monoclonal antibody 1A11 was a gift of G. Wu (Vanderbilt University, Nashville, USA). An affinity-purified PC2 C-terminal rabbit polyclonal antibody (p30) has been described previously (3,55). A commercial PC2 goat polyclonal antibody (G20) was purchased from Santa Cruz Biotechnology (Santa Cruz, CA, USA). An antibody raised to PKA phosphorylated substrates (RRXS*/T*) was from Cell Signalling Technology (Beverly, MA, USA). Protein kinase inhibitors were from Calbiochem (Nottingham, UK). AKAP inhibitor peptide Ht31 and negative control peptide were from Promega (UK). PKA-Cα expression plasmid was from Stratagene (La Jolla, CA, USA). The Aurora A inhibitor MLN8237 was a gift from P.Eyers (University of Sheffield).
Generation of cDNA constructs
Generation of mutant and wild-type PC2 constructs has been previously reported (4,6). The introduction of four substitution mutations (V846, I853, I860, L867 or 4 m) in the C-terminal coiled-coil domain (CC2) has been shown to specifically disrupt C-terminal dimerization and abolish PC2 binding to PC1 (4). A Tac construct fused to the C-terminus of MCOLN in pcDNA3.1 was a gift of R. Puertollano (National Institutes of Health, Bethesda) (56). The PC1 C-terminus (CT1, 4107–4303 aa) was subcloned in place of the C-terminus of MCOLN and epitope-tagged to generate a Tac-CT1-myc fusion protein. The PC1 mutants (R4227X, F4155V) were generated by site-directed mutagenesis as previously described (22). All Tac constructs showed cell surface expression in MDCK II cells (not shown). PP1α was amplified from human complementary DNA (cDNA) using specific primers incorporating an N-terminal HA tag and subcloned into a pcDNA3 vector (Invitrogen).
Cell culture and transfection
HEK-293 and MDCK cells were cultured in Dulbecco's modified Eagle's medium supplemented with 10% fetal bovine serum. Transient transfection was carried out on cells cultured to 90% confluence using Lipofectamine 2000 (Invitrogen) according to the manufacturer's instructions. MDCK I FRT cells (57) and Ser829 mutant clones were generated as previously described (33). Culture conditions for MEK (13), Kif3a (50), UCL93/OX161 (23) and M7/M8 murine cell lines (3) have been described previously.
Small interfering (siRNA) knockdown
Isoform-specific siRNA to human PKA was chemically synthesized by Cell Signalling Technology (SignalSilence® PKA C-α siRNA I #6406). A scrambled negative control siRNA (Silencer) was purchased from Ambion. Transfection of siRNA into cells was achieved using Lipofectamine reagent (Invitrogen). Knockdown was confirmed by immunoblotting for PKA or pPC2 at 48 h post-transfection.
Custom antibody generation
A custom rabbit polyclonal PC2 phospho-specific antibody (pPC2) was generated using the Ser829-containing phosphopeptide sequence SGHSSRRRGpSISSG (Genscript, Piscataway, NJ, USA).The phospho-specific antibody was affinity purified and tested against both non-phosphorylated and phosphorylated peptides. ELISA results confirmed the specificity of the antibody for the phosphorylated peptide with a titre of >1:512 000 (the titre is the highest dilution with S/N (sample/blank) ≥2.1).
Immunoprecipitation and immunoblotting
Total cell lysates were prepared and processed for immunoprecipitation and western blotting as described previously (3). Dephosphorylation using λ-phosphatase was carried out as described previously (22,33). To assess the effect of stimulation on PC2 phosphorylation, native HEK or stably transfected MDCK I cells were seeded into 12-well plates and grown in complete medium to reach 75% confluence. Cells were then cultured in serum-free media for 24 h at 37°C to induce quiescence. To activate PKA, the cells were stimulated with 0.5 mm dbcAMP and 100 µm forskolin for 30 min. For inhibitor studies, the cells were pre-treated with inhibitors for 4 h before stimulation. The cells were solubilized in detergent lysis buffer (50 mm Tris, 0.14 M NaCl, 1% Triton X-100, and 0.5% NP40) supplemented with complete protease inhibitors and PhosStop phosphatase inhibitors (Roche Diagnostics, Mannheim, Germany). ECL detection and quantification were carried out using a Biorad Chemidoc XRS+ system running Image Lab automated image capture and analysis software. All quantification was carried out on non-saturated bands as determined by the software. Data are presented as the ratio of pPC2 to PC2. Equal loading was further confirmed by probing blots for total actin (Santa Cruz).
In vitro kinase and phosphatase assays
Recombinant bacterial fusion proteins, Thio-CT2 (700–968 aa) and GST-CT2 (680–968 aa), were generated as previously described (4,33). In vitro kinase assays were performed on 2 μg of recombinant Thio-CT2. Proteins were incubated for 10 min at 30°C in enzyme buffer with 1 µm ATP in the presence of recombinant protein kinases (NEB, UK). In vitro phosphatase assays were carried out on recombinant GST-CT2 phosphorylated by PKA. Following precipitation with glutathione beads (Pharmacia), they were washed with phosphatase buffer to remove PKA and then incubated with PP1 (NEB, UK), PP2A (Cayman Chemical, USA) or PP2B (Promega, UK) for 1–2 h in phosphatase buffer. Reactions were terminated by the addition of SDS–PAGE loading buffer, separated and detected with a pPC2 antibody by western blotting.
Immunofluorescence
Immunofluoresence was carried out as described previously (33). Images were acquired using SimplePCI imaging software (Compix, Hamamatsu) and analysed using ImageJ software (National Institutes of Health). Intensity measurements of centrosomes were carried out using ImageJ. To determine the effect of PKA activation on the subcellular localization of pSer829, confluent MDCK II cells were incubated in normal media or serum-free media for 24 h followed by overnight incubation with DMSO or 10 µm H89. Cells were stimulated with 0.5 mm dbcAMP and 100 µm forskolin for 30 min followed by immunolabelling with pPC2. Deconvolution was carried out on 0.25 µm thick optical Z-stack sections using Autoquant X software (Media Cybernetics Inc., USA).
Immunohistochemistry
Archival nephrectomy sections were obtained from six ADPKD patients with known truncating PKD1 mutations and from three control patients (58). Mouse kidney tissue from inducible kidney-specific Pkd1 deletion (iKsp-Pkd1del) mice was obtained following tamoxifen treatment at post-natal days 38–40 (n = 4) and compared with untreated mice (n = 4) at sacrifice after 105 days (24).
Formalin-fixed paraffin sections were dewaxed and hydrated through graded ethanol solutions. For antigen retrieval, the sections were placed in 10 mm citric acid buffer (pH 6.0) and incubated in a pre-heated water-bath maintained at 95°C for 15 min. Endogenous peroxidase activity was quenched by treatment with methanol containing 3% hydrogen peroxide for 30 min. Sections were then incubated in diluted blocking serum for 30 min, followed by incubation overnight at 4°C with a pPC2 antibody (1:75 dilution). For human and mouse kidney sections, a peroxidase-conjugated secondary antibody was employed and peroxidase activity was visualized using a substrate solution of diaminobenzidine (DAB) containing 0.03% hydrogen peroxide. Negative control sections were processed with omission of the primary antibody and an irrelevant IgG. All sections were counterstained in haematoxylin.
Proliferation assays and flow cytometry
MDCK cells were plated in 24-well plates at a density of 3 × 10⁴ cells per well in the presence or absence of 1 µg/ml tetracycline to induce PC2 expression (33). Triplicate wells from three independent experiments were cell counted at 24, 48 and 72 h. For flow cytometry, MDCK I cells were cultured in 12-well dishes overnight, serum starved for 24 h and returned to normal medium for 24 h. The cells were then fixed with cold 70% ethanol, suspended in propidium iodide (50 μg/ml) containing RNase A (0.1 mg/ml) and incubated at 37°C for 30 min. Fluorescence-activated cell sorting analysis was performed and cell cycle stage analysed using the FlowJo program (TreeStar, Ashland, OR, USA) to determine the number of cells in G1 and S/G2 based upon DNA ploidy. Experiments were carried out in triplicate in three independent experiments.
Radiometric calcium imaging
Control and stably transfected MDCK I FRT or transfected HEK-293 cells were grown in glass chamber slides to subconfluent density. The cells were incubated in 5 µm Fura2/AM (Tocris) for 30 min at 37°C, washed with assay buffer (HBSS/20 mmHepes pH 7.4) and incubated in assay buffer for 20 min at 37°C. The changes in fluorescence intensity were determined based on the observations of more than 50 randomly selected cells in each experiment for MDCK cells or by selecting HEK cells co-transfected with a dsRED reporter plasmid (Clontech). Cells were selected before each experiment and the borders of the entire cell were outlined manually to eliminate any selective contribution from non-uniform distribution of the dye within cells. Fura-2 measurements were made with dual excitation wavelengths of 340 and 380 nm, and the emitted light was measured at an emission wavelength of 510 nm. Images were acquired every 2 s. Calcium transients were initiated by the addition of 10 μm ATP. Images were acquired and analysed using SimplePCI imaging software (Compix, Hamamatsu). Data shown were obtained from at least three independent experiments.
Xenopus experiments
Xenopus embryos obtained by in vitro fertilization were maintained in 0.1× modified Barth medium (59) and staged according to Nieuwkoop and Faber (60). The sequence of the antisense morpholino oligomer (GeneTools, LLC) targeting Pkd2 (Pkd2-MO) was 5′-GGT TTG ATT CTG CTG GGA TTC ATC G-3′ (38). A total of 3.2 pmol xPkd2-MO was injected radially at the two- to four-cell stage into Xenopus embryos.
For Xenopus rescue experiments, pCS2+ PKD2-Pk plasmids were generated by PCR amplification of wild-type, S829A, S829D and D511V PC2 using pcDNA3 PKD2-Pk plasmids as templates. PCR products were subcloned into pCS2+ vectors using XhoI and NotI restriction sites and verified by sequencing. Synthetic mRNA was generated from pCS2-PKD2, pCS2-PKD2-S829A, pCS2-PKD2-S829D and pCS2-PKD2-D511V following linearization with NotI and transcribed with SP6 RNA polymerase. Embryos were categorized into those with normal bilateral expression of Nbc1 in the late distal tubule, those with absent expression and those with unilateral expression rescued by the co-injected mRNA. Xenopus embryos were injected at the two- to four-cell stage radially with the Pkd2-MO. At the eight-cell stage, a subset of these embryos were then injected with PKD2, PKD2 (S829D), PKD2(S829A) or PKD2(D511V) mRNA into a single blastomere. Embryos were grown until stage 39 and processed for whole-mount in situ hybridizations for Nbc1 mRNA as previously described (39).
Statistical analysis
Data are presented as mean ± SEM. Student's t test was used for statistical analysis with a P-value of <0.05 indicating statistical significance.
SUPPLEMENTARY MATERIAL
FUNDING
This project was funded by the Wellcome Trust (GR071201, A.C.M.O.), Research Councils UK (A.J.S.), the Sheffield Kidney Research Foundation (A.J.S.) and National Institutes of Health (7R01DK080745-03, O.W.).
Supplementary Material
ACKNOWLEDGEMENTS
We thank Patrick Eyers and Leo Tsiokas for helpful discussions and comments on the manuscript; Fiona Morrow, Spencer Shaw, Uyen Tran and Jessie Hassey for expert technical assistance. We acknowledge kind gifts of reagents and samples from G. Wu, J. Zhou, C. Winearls, P. Igarashi, R. Puertollano and P. Eyers. A.J.S. is a Research Councils UK Academic Fellow and A.C.M.O. was a Wellcome Trust Research Leave Senior Fellow.
Conflict of Interest statement. None declared
REFERENCES
- 1.Torres V.E., Harris P.C., Pirson Y. Autosomal dominant polycystic kidney disease. Lancet. 2007;369:1287–1301. doi: 10.1016/S0140-6736(07)60601-1. doi:10.1016/S0140-6736(07)60601-1. [DOI] [PubMed] [Google Scholar]
- 2.Ong A.C., Harris P.C. Molecular pathogenesis of ADPKD: the polycystin complex gets complex. Kidney Int. 2005;67:1234–1247. doi: 10.1111/j.1523-1755.2005.00201.x. doi:10.1111/j.1523-1755.2005.00201.x. [DOI] [PubMed] [Google Scholar]
- 3.Newby L.J., Streets A.J., Zhao Y., Harris P.C., Ward C.J., Ong A.C. Identification, characterization, and localization of a novel kidney polycystin-1-polycystin-2 complex. J. Biol. Chem. 2002;277:20763–20773. doi: 10.1074/jbc.M107788200. doi:10.1074/jbc.M107788200. [DOI] [PubMed] [Google Scholar]
- 4.Giamarchi A., Feng S., Rodat-Despoix L., Xu Y., Bubenshchikova E., Newby L.J., Hao J., Gaudioso C., Crest M., Lupas A.N., et al. A polycystin-2 (TRPP2) dimerization domain essential for the function of heteromeric polycystin complexes. EMBO J. 2010;29:1176–1191. doi: 10.1038/emboj.2010.18. doi:10.1038/emboj.2010.18. [DOI] [PMC free article] [PubMed] [Google Scholar]
- 5.Yu Y., Ulbrich M.H., Li M.H., Buraei Z., Chen X.Z., Ong A.C., Tong L., Isacoff E.Y., Yang J. Structural and molecular basis of the assembly of the TRPP2/PKD1 complex. Proc. Natl Acad. Sci. USA. 2009;106:11558–11563. doi: 10.1073/pnas.0903684106. doi:10.1073/pnas.0903684106. [DOI] [PMC free article] [PubMed] [Google Scholar]
- 6.Feng S., Rodat-Despoix L., Delmas P., Ong A.C. A single amino acid residue constitutes the third dimerization domain essential for the assembly and function of the tetrameric polycystin-2 (TRPP2) channel. J. Biol. Chem. 2011;286:18994–19000. doi: 10.1074/jbc.M110.192286. doi:10.1074/jbc.M110.192286. [DOI] [PMC free article] [PubMed] [Google Scholar]
- 7.Feng S., Okenka G.M., Bai C.X., Streets A.J., Newby L.J., DeChant B.T., Tsiokas L., Obara T., Ong A.C. Identification and functional characterization of an N-terminal oligomerization domain for polycystin-2. J. Biol. Chem. 2008;283:28471–28479. doi: 10.1074/jbc.M803834200. doi:10.1074/jbc.M803834200. [DOI] [PMC free article] [PubMed] [Google Scholar]
- 8.Ong A.C. Polycystin expression in the kidney and other tissues: complexity, consensus and controversy. Exp. Nephrol. 2000;8:208–214. doi: 10.1159/000020670. doi:10.1159/000020670. [DOI] [PubMed] [Google Scholar]
- 9.Nauli S.M., Alenghat F.J., Luo Y., Williams E., Vassilev P., Li X., Elia A.E., Lu W., Brown E.M., Quinn S.J., et al. Polycystins 1 and 2 mediate mechanosensation in the primary cilium of kidney cells. Nat. Genet. 2003;33:129–137. doi: 10.1038/ng1076. doi:10.1038/ng1076. [DOI] [PubMed] [Google Scholar]
- 10.Rundle D.R., Gorbsky G., Tsiokas L. PKD2 interacts and co-localizes with mDia1 to mitotic spindles of dividing cells: role of mDia1 in PKD2 localization to mitotic spindles. J. Biol. Chem. 2004;279:29728–29739. doi: 10.1074/jbc.M400544200. doi:10.1074/jbc.M400544200. [DOI] [PubMed] [Google Scholar]
- 11.Jurczyk A., Gromley A., Redick S., San Agustin J., Witman G., Pazour G.J., Peters D.J., Doxsey S. Pericentrin forms a complex with intraflagellar transport proteins and polycystin-2 and is required for primary cilia assembly. J. Cell Biol. 2004;166:637–643. doi: 10.1083/jcb.200405023. doi:10.1083/jcb.200405023. [DOI] [PMC free article] [PubMed] [Google Scholar]
- 12.Bhunia A.K., Piontek K., Boletta A., Liu L., Qian F., Xu P.N., Germino F.J., Germino G.G. PKD1 induces p21(waf1) and regulation of the cell cycle via direct activation of the JAK-STAT signaling pathway in a process requiring PKD2. Cell. 2002;109:157–168. doi: 10.1016/s0092-8674(02)00716-x. doi:10.1016/S0092-8674(02)00716-X. [DOI] [PubMed] [Google Scholar]
- 13.Li X., Luo Y., Starremans P.G., McNamara C.A., Pei Y., Zhou J. Polycystin-1 and polycystin-2 regulate the cell cycle through the helix–loop–helix inhibitor Id2. Nat. Cell Biol. 2005;7:1202–1212. doi: 10.1038/ncb1326. [DOI] [PubMed] [Google Scholar]
- 14.Streets A.J., Newby L.J., O'Hare M.J., Bukanov N.O., Ibraghimov-Beskrovnaya O., Ong A.C. Functional analysis of PKD1 transgenic lines reveals a direct role for polycystin-1 in mediating cell–cell adhesion. J. Am. Soc. Nephrol. 2003;14:1804–1815. doi: 10.1097/01.asn.0000076075.49819.9b. doi:10.1097/01.ASN.0000076075.49819.9B. [DOI] [PubMed] [Google Scholar]
- 15.Ibraghimov-Beskrovnaya O., Bukanov N.O., Donohue L.C., Dackowski W.R., Klinger K.W., Landes G.M. Strong homophilic interactions of the Ig-like domains of polycystin-1, the protein product of an autosomal dominant polycystic kidney disease gene, PKD1. Hum. Mol. Genet. 2000;9:1641–1649. doi: 10.1093/hmg/9.11.1641. doi:10.1093/hmg/9.11.1641. [DOI] [PubMed] [Google Scholar]
- 16.Streets A.J., Wagner B.E., Harris P.C., Ward C.J., Ong A.C. Homophilic and heterophilic polycystin 1 interactions regulate E-cadherin recruitment and junction assembly in MDCK cells. J. Cell Sci. 2009;122:1410–1417. doi: 10.1242/jcs.045021. doi:10.1242/jcs.045021. [DOI] [PMC free article] [PubMed] [Google Scholar]
- 17.Li Y., Santoso N.G., Yu S., Woodward O.M., Qian F., Guggino W.B. Polycystin-1 interacts with inositol 1,4,5-trisphosphate receptor to modulate intracellular Ca2+ signaling with implications for polycystic kidney disease. J. Biol. Chem. 2009;284:36431–36441. doi: 10.1074/jbc.M109.068916. doi:10.1074/jbc.M109.068916. [DOI] [PMC free article] [PubMed] [Google Scholar]
- 18.Mekahli D., Sammels E., Luyten T., Welkenhuyzen K., van den Heuvel L.P., Levtchenko E.N., Gijsbers R., Bultynck G., Parys J.B., De Smedt H., et al. Polycystin-1 and polycystin-2 are both required to amplify inositol-trisphosphate-induced Ca2+ release. Cell Calcium. 2012;51:452–458. doi: 10.1016/j.ceca.2012.03.002. doi:10.1016/j.ceca.2012.03.002. [DOI] [PubMed] [Google Scholar]
- 19.Hogan M.C., Manganelli L., Woollard J.R., Masyuk A.I., Masyuk T.V., Tammachote R., Huang B.Q., Leontovich A.A., Beito T.G., Madden B.J., et al. Characterization of PKD protein-positive exosome-like vesicles. J. Am. Soc. Nephrol. 2009;20:278–288. doi: 10.1681/ASN.2008060564. doi:10.1681/ASN.2008060564. [DOI] [PMC free article] [PubMed] [Google Scholar]
- 20.Plotnikova O.V., Pugacheva E.N., Golemis E.A. Aurora A kinase activity influences calcium signaling in kidney cells. J. Cell. Biol. 2011;193:1021–1032. doi: 10.1083/jcb.201012061. doi:10.1083/jcb.201012061. [DOI] [PMC free article] [PubMed] [Google Scholar]
- 21.Kottgen M., Benzing T., Simmen T., Tauber R., Buchholz B., Feliciangeli S., Huber T.B., Schermer B., Kramer-Zucker A., Hopker K., et al. Trafficking of TRPP2 by PACS proteins represents a novel mechanism of ion channel regulation. EMBO J. 2005;24:705–716. doi: 10.1038/sj.emboj.7600566. doi:10.1038/sj.emboj.7600566. [DOI] [PMC free article] [PubMed] [Google Scholar]
- 22.Streets A.J., Moon D.J., Kane M.E., Obara T., Ong A.C. Identification of an N-terminal glycogen synthase kinase 3 phosphorylation site which regulates the functional localization of polycystin-2 in vivo and in vitro. Hum. Mol. Genet. 2006;15:1465–1473. doi: 10.1093/hmg/ddl070. doi:10.1093/hmg/ddl070. [DOI] [PMC free article] [PubMed] [Google Scholar]
- 23.Parker E., Newby L.J., Sharpe C.C., Rossetti S., Streets A.J., Harris P.C., O'Hare M.J., Ong A.C. Hyperproliferation of PKD1 cystic cells is induced by insulin-like growth factor-1 activation of the Ras/Raf signalling system. Kidney Int. 2007;72:157–165. doi: 10.1038/sj.ki.5002229. doi:10.1038/sj.ki.5002229. [DOI] [PMC free article] [PubMed] [Google Scholar]
- 24.Novalic Z., van der Wal A.M., Leonhard W.N., Koehl G., Breuning M.H., Geissler E.K., de Heer E., Peters D.J. Dose-dependent effects of sirolimus on mTOR signaling and polycystic kidney disease. J. Am. Soc. Nephrol. 2012;23:842–853. doi: 10.1681/ASN.2011040340. [DOI] [PMC free article] [PubMed] [Google Scholar]
- 25.Mitsuhashi S., Matsuura N., Ubukata M., Oikawa H., Shima H., Kikuchi K. Tautomycetin is a novel and specific inhibitor of serine/threonine protein phosphatase type 1, PP1. Biochem. Biophys. Res. Commun. 2001;287:328–331. doi: 10.1006/bbrc.2001.5596. doi:10.1006/bbrc.2001.5596. [DOI] [PubMed] [Google Scholar]
- 26.Favre B., Turowski P., Hemmings B.A. Differential inhibition and posttranslational modification of protein phosphatase 1 and 2A in MCF7 cells treated with calyculin-A, okadaic acid, and tautomycin. J. Biol. Chem. 1997;272:13856–13863. doi: 10.1074/jbc.272.21.13856. doi:10.1074/jbc.272.21.13856. [DOI] [PubMed] [Google Scholar]
- 27.Cohen P.T. Protein phosphatase 1—targeted in many directions. J. Cell. Sci. 2002;115:241–256. doi: 10.1242/jcs.115.2.241. [DOI] [PubMed] [Google Scholar]
- 28.Schillace R.V., Scott J.D. Association of the type 1 protein phosphatase PP1 with the A-kinase anchoring protein AKAP220. Curr. Biol. 1999;9:321–324. doi: 10.1016/s0960-9822(99)80141-9. doi:10.1016/S0960-9822(99)80141-9. [DOI] [PubMed] [Google Scholar]
- 29.Schillace R.V., Scott J.D. Organization of kinases, phosphatases, and receptor signaling complexes. J. Clin. Invest. 1999;103:761–765. doi: 10.1172/JCI6491. doi:10.1172/JCI6491. [DOI] [PMC free article] [PubMed] [Google Scholar]
- 30.Tan Y.C., Blumenfeld J.D., Anghel R., Donahue S., Belenkaya R., Balina M., Parker T., Levine D., Leonard D.G., Rennert H. Novel method for genomic analysis of PKD1 and PKD2 mutations in autosomal dominant polycystic kidney disease. Hum. Mutat. 2009;30:264–273. doi: 10.1002/humu.20842. doi:10.1002/humu.20842. [DOI] [PubMed] [Google Scholar]
- 31.Parnell S.C., Puri S., Wallace D.P., Calvet J.P. Protein phosphatase-1alpha interacts with and dephosphorylates polycystin-1. PloS One. 2012;7:e36798. doi: 10.1371/journal.pone.0036798. doi:10.1371/journal.pone.0036798. [DOI] [PMC free article] [PubMed] [Google Scholar]
- 32.Sammels E., Devogelaere B., Mekahli D., Bultynck G., Missiaen L., Parys J.B., Cai Y., Somlo S., De Smedt H. Polycystin-2 activation by inositol 1,4,5-trisphosphate-induced Ca2+ release requires its direct association with the inositol 1,4,5-trisphosphate receptor in a signaling microdomain. J. Biol. Chem. 2010;285:18794–18805. doi: 10.1074/jbc.M109.090662. doi:10.1074/jbc.M109.090662. [DOI] [PMC free article] [PubMed] [Google Scholar]
- 33.Streets A.J., Needham A.J., Gill S.K., Ong A.C. Protein kinase D-mediated phosphorylation of polycystin-2 (TRPP2) is essential for its effects on cell growth and calcium channel activity. Mol. Biol. Cell. 2010;21:3853–3865. doi: 10.1091/mbc.E10-04-0377. doi:10.1091/mbc.E10-04-0377. [DOI] [PMC free article] [PubMed] [Google Scholar]
- 34.Grimm D.H., Karihaloo A., Cai Y., Somlo S., Cantley L.G., Caplan M.J. Polycystin-2 regulates proliferation and branching morphogenesis in kidney epithelial cells. J. Biol. Chem. 2006;281:137–144. doi: 10.1074/jbc.M507845200. doi:10.1074/jbc.M507845200. [DOI] [PubMed] [Google Scholar]
- 35.Liang G., Li Q., Tang Y., Kokame K., Kikuchi T., Wu G., Chen X.Z. Polycystin-2 is regulated by endoplasmic reticulum-associated degradation. Hum Mol Genet. 2008;17:1109–1119. doi: 10.1093/hmg/ddm383. doi:10.1093/hmg/ddm383. [DOI] [PubMed] [Google Scholar]
- 36.Fan L.X., Li X., Magenheimer B., Calvet J.P. Inhibition of histone deacetylases targets the transcription regulator Id2 to attenuate cystic epithelial cell proliferation. Kidney Int. 2012;81:76–85. doi: 10.1038/ki.2011.296. doi:10.1038/ki.2011.296. [DOI] [PMC free article] [PubMed] [Google Scholar]
- 37.Kim H., Bae Y., Jeong W., Ahn C., Kang S. Depletion of PKD1 by an antisense oligodeoxynucleotide induces premature G1/S-phase transition. Eur. J. Hum. Genet. 2004;12:433–440. doi: 10.1038/sj.ejhg.5201136. doi:10.1038/sj.ejhg.5201136. [DOI] [PubMed] [Google Scholar]
- 38.Tran U., Zakin L., Schweickert A., Agrawal R., Doger R., Blum M., De Robertis E.M., Wessely O. The RNA-binding protein bicaudal C regulates polycystin 2 in the kidney by antagonizing miR-17 activity. Development. 2010;137:1107–1116. doi: 10.1242/dev.046045. doi:10.1242/dev.046045. [DOI] [PMC free article] [PubMed] [Google Scholar]
- 39.Tran U., Pickney L.M., Ozpolat B.D., Wessely O. Xenopus Bicaudal-C is required for the differentiation of the amphibian pronephros. Dev. Biol. 2007;307:152–164. doi: 10.1016/j.ydbio.2007.04.030. doi:10.1016/j.ydbio.2007.04.030. [DOI] [PMC free article] [PubMed] [Google Scholar]
- 40.Yu Y., Yoon S.O., Poulogiannis G., Yang Q., Ma X.M., Villen J., Kubica N., Hoffman G.R., Cantley L.C., Gygi S.P., et al. Phosphoproteomic analysis identifies Grb10 as an mTORC1 substrate that negatively regulates insulin signaling. Science. 2011;332:1322–1326. doi: 10.1126/science.1199484. doi:10.1126/science.1199484. [DOI] [PMC free article] [PubMed] [Google Scholar]
- 41.Hsu P.P., Kang S.A., Rameseder J., Zhang Y., Ottina K.A., Lim D., Peterson T.R., Choi Y., Gray N.S., Yaffe M.B., et al. The mTOR-regulated phosphoproteome reveals a mechanism of mTORC1-mediated inhibition of growth factor signaling. Science. 2011;332:1317–1322. doi: 10.1126/science.1199498. doi:10.1126/science.1199498. [DOI] [PMC free article] [PubMed] [Google Scholar]
- 42.Huttlin E.L., Jedrychowski M.P., Elias J.E., Goswami T., Rad R., Beausoleil S.A., Villen J., Haas W., Sowa M.E., Gygi S.P. A tissue-specific atlas of mouse protein phosphorylation and expression. Cell. 2010;143:1174–1189. doi: 10.1016/j.cell.2010.12.001. doi:10.1016/j.cell.2010.12.001. [DOI] [PMC free article] [PubMed] [Google Scholar]
- 43.Molina H., Horn D.M., Tang N., Mathivanan S., Pandey A. Global proteomic profiling of phosphopeptides using electron transfer dissociation tandem mass spectrometry. Proc. Natl. Acad. Sci. USA. 2007;104:2199–2204. doi: 10.1073/pnas.0611217104. [DOI] [PMC free article] [PubMed] [Google Scholar]
- 44.Olsen J.V., Blagoev B., Gnad F., Macek B., Kumar C., Mortensen P., Mann M. Global, in vivo, and site-specific phosphorylation dynamics in signaling networks. Cell. 2006;127:635–648. doi: 10.1016/j.cell.2006.09.026. [DOI] [PubMed] [Google Scholar]
- 45.Hoffert J.D., Pisitkun T., Wang G., Shen R.-F., Knepper M.A. Quantitative phosphoproteomics of vasopressin-sensitive renal cells: regulation of aquaporin-2 phosphorylation at two sites. Proc. Natl. Acad. Sci. USA. 2006;103:7159–7164. doi: 10.1073/pnas.0600895103. [DOI] [PMC free article] [PubMed] [Google Scholar]
- 46.Zanivan S., Gnad F., Wickstrom S.A., Geiger T., Macek B., Cox J., Fassler R., Mann M. Solid tumor proteome and phosphoproteome analysis by high resolution mass spectrometry. J. Proteome. Res. 2008;7:5314–5326. doi: 10.1021/pr800599n. [DOI] [PubMed] [Google Scholar]
- 47.Li H., Xing X., Ding G., Li Q., Wang C., Xie L., Zeng R., Li Y. SysPTM: a systematic resource for proteomic research on post-translational modifications. Mol. Cell. Proteomics. 2009;8:1839–1849. doi: 10.1074/mcp.M900030-MCP200. [DOI] [PMC free article] [PubMed] [Google Scholar]
- 48.Cai Y., Anyatonwu G., Okuhara D., Lee K.B., Yu Z., Onoe T., Mei C.L., Qian Q., Geng L., Wiztgall R., et al. Calcium dependence of polycystin-2 channel activity is modulated by phosphorylation at Ser812. J. Biol. Chem. 2004;279:19987–19995. doi: 10.1074/jbc.M312031200. doi:10.1074/jbc.M312031200. [DOI] [PubMed] [Google Scholar]
- 49.Torres V.E. Cyclic AMP, at the hub of the cystic cycle. Kidney Int. 2004;66:1283–1285. doi: 10.1111/j.1523-1755.2004.00945.x. doi:10.1111/j.1523-1755.2004.00945.x. [DOI] [PubMed] [Google Scholar]
- 50.Choi Y.H., Suzuki A., Hajarnis S., Ma Z., Chapin H.C., Caplan M.J., Pontoglio M., Somlo S., Igarashi P. Polycystin-2 and phosphodiesterase 4C are components of a ciliary A-kinase anchoring protein complex that is disrupted in cystic kidney diseases. Proc. Natl Acad. Sci. USA. 2011;108:10679–10684. doi: 10.1073/pnas.1016214108. doi:10.1073/pnas.1016214108. [DOI] [PMC free article] [PubMed] [Google Scholar]
- 51.Hendrickx A., Beullens M., Ceulemans H., Den Abt T., Van Eynde A., Nicolaescu E., Lesage B., Bollen M. Docking motif-guided mapping of the interactome of protein phosphatase-1. Chem. Biol. 2009;16:365–371. doi: 10.1016/j.chembiol.2009.02.012. doi:10.1016/j.chembiol.2009.02.012. [DOI] [PubMed] [Google Scholar]
- 52.Qian Q., Hunter L.W., Li M., Marin-Padilla M., Prakash Y.S., Somlo S., Harris P.C., Torres V.E., Sieck G.C. Pkd2 haploinsufficiency alters intracellular calcium regulation in vascular smooth muscle cells. Hum. Mol. Genet. 2003;12:1875–1880. doi: 10.1093/hmg/ddg190. doi:10.1093/hmg/ddg190. [DOI] [PubMed] [Google Scholar]
- 53.Bai C.X., Kim S., Li W.P., Streets A.J., Ong A.C., Tsiokas L. Activation of TRPP2 through mDia1-dependent voltage gating. EMBO J. 2008;27:1345–1356. doi: 10.1038/emboj.2008.70. doi:10.1038/emboj.2008.70. [DOI] [PMC free article] [PubMed] [Google Scholar]
- 54.Parry H., McDougall A., Whitaker M. Microdomains bounded by endoplasmic reticulum segregate cell cycle calcium transients in syncytial Drosophila embryos. J. Cell Biol. 2005;171:47–59. doi: 10.1083/jcb.200503139. doi:10.1083/jcb.200503139. [DOI] [PMC free article] [PubMed] [Google Scholar]
- 55.Ong A.C., Ward C.J., Butler R.J., Biddolph S., Bowker C., Torra R., Pei Y., Harris P.C. Coordinate expression of the autosomal dominant polycystic kidney disease proteins, polycystin-2 and polycystin-1, in normal and cystic tissue. Am. J. Pathol. 1999;154:1721–1729. doi: 10.1016/S0002-9440(10)65428-4. doi:10.1016/S0002-9440(10)65428-4. [DOI] [PMC free article] [PubMed] [Google Scholar]
- 56.Vergarajauregui S., Puertollano R. Two di-leucine motifs regulate trafficking of mucolipin-1 to lysosomes. Traffic. 2006;7:337–353. doi: 10.1111/j.1600-0854.2006.00387.x. doi:10.1111/j.1600-0854.2006.00387.x. [DOI] [PMC free article] [PubMed] [Google Scholar]
- 57.Frohlich O., Klein J.D., Smith P.M., Sands J.M., Gunn R.B. Urea transport in MDCK cells that are stably transfected with UT-A1. Am. J. Physiol. Cell Physiol. 2004;286:C1264–1270. doi: 10.1152/ajpcell.00499.2003. doi:10.1152/ajpcell.00499.2003. [DOI] [PubMed] [Google Scholar]
- 58.Ong A.C., Harris P.C., Davies D.R., Pritchard L., Rossetti S., Biddolph S., Vaux D.J., Migone N., Ward C.J. Polycystin-1 expression in PKD1, early-onset PKD1, and TSC2/PKD1 cystic tissue. Kidney Int. 1999;56:1324–1333. doi: 10.1046/j.1523-1755.1999.00659.x. doi:10.1046/j.1523-1755.1999.00659.x. [DOI] [PubMed] [Google Scholar]
- 59.Sive H.L., Grainger R.M., Harland R.M. Early Development of Xenopus laevis: A Laboratory Manual. Cold Spring Harbor, NY: Cold Spring Harbor Laboratory Press; 2000. [Google Scholar]
- 60.Nieuwkoop P.D., Faber J. Normal Table of Xenopus laevis. New York: Garland Publishing; 1994. [Google Scholar]
Associated Data
This section collects any data citations, data availability statements, or supplementary materials included in this article.