

Abstract
Although the majority of first-line antidepressants increase brain serotonin and rare polymorphisms in tryptophan hydroxlase-2 (Tph2), the rate-limiting enzyme in the brain serotonin synthesis pathway, have been identified in cohorts of subjects with major depressive disorder, the circuit level alterations that results from serotonergic hypofunction remain poorly understood. Here we use chronic multicircuit neurophysiological recordings to characterize functional interactions across cortical and limbic circuits in mice engineered to express a human loss-of-function depression allele Tph2-(R441H) [Tph2 knockin (Tph2KI)]. Our results show that Tph2KI mice exhibit increased intra-network synchrony within medial prefrontal cortex (mPFC) and basal amygdala (AMY) and increased inter-network synchrony between these two brain networks. Moreover, we demonstrate that chronic treatment with fluoxetine reverses several of the circuit alterations observed within Tph2KI mice. Together, our findings establish a functional link between functional hyposerotonergia and altered mPFC–AMY network dynamics.
Introduction
Major depressive disorder (MDD) is a complex multifactorial neuropsychiatric illness characterized by profound changes in mood, sleep, affect, and interests (American Psychiatric Association, 2000; Akil et al., 2010). At least 4% of the U.S. population is affected by an MDD each year, and 17% of the population is expected to experience symptoms of an MDD in their lifetime (Blazer et al., 1994; Kessler et al., 1994). The majority of first-line antidepressant pharmacotherapeutics increase brain serotonin (5-HT), and rare naturally occurring genetic variants in human tryptophan hydroxlase-2 (Tph2; the rate-limiting enzyme in the brain 5-HT synthesis) have been shown to confer risk for MDD (Zill et al., 2004; Zhang et al., 2005; Tsai et al., 2009). Mice genetically engineered to express one of these rare variants in Tph2 (R441H) observed in a subset of human subjects with MDD [Tph2 knockin mice (Tph2KI)] exhibit reduced baseline and evoked extracellular 5-HT levels (Jacobsen et al., 2012). This further suggests that dysregulation of brain 5-HT may contribute to the central pathophysiological changes that confer risk for MDD. Notably, Tph2KI mice also recapitulate several endophenotypes associated with MDD and MDD risk in human, including reduced CSF 5-hydroxyindoleacetic acid (a primary 5-HT metabolite), blunted fenfluramine-induced plasma prolactin release, blunted 5-HT1AR agonist hypothermia, increased frontal 5-HT2AR (Jacobsen et al., 2012), and trait anxiety (Beaulieu et al., 2008).
Functional changes across vast circuits spanning multiple cortical and subcortical brain areas are thought to contribute to the endophenotypes comprising MDD (Drevets, 2001; Liotti and Mayberg, 2001). For example, positron emission tomography, functional magnetic resonance imaging (fMRI), and postmortem brain studies have identified changes in prefrontal cortex (PFC) and amygdala (AMY) function in depressed subjects (Drevets et al., 2008; Savitz and Drevets, 2009b; Covington et al., 2010). Nevertheless, the neurophysiological microcircuit level alterations that confer MDD risk and how they may relate to changes in serotonergic tone remain poorly understood.
Here, we set out to characterize the function of widely distributed brain circuits in Tph2KI mice by performing simultaneous neurophysiological recordings across multiple cortical and limbic brain areas in each subject. These areas, implicated in mediating depressive endophenotypes, included the following: the prelimbic/infralimbic cortex (anatomical subdivisions of mPFC), the orbital frontal cortex (OFC), the frontal association cortex (FrA), AMY, nucleus accumbens (NAC), the lateral hypothalamus (LH), the ventral hippocampus (V_Hipp), the ventral tegmental area (VTA), and the dorsal raphe nucleus (DR) (Krishnan and Nestler, 2008).
Materials and Methods
Animal care and use.
Knockin mice carrying the R439H Tph2 allele, equivalent to the human R441H TPH2 allele identified in subjects with MDD (Zhang et al., 2005), were generated as described previously (Beaulieu et al., 2008). All animals used in this study were bred from heterozygous breeding pairs on a 129S6/SvEv and C57BL/6J mixed strain background. Male TPH2-KI (homozygous knockin, Tph2KI) and wild-type (WT) littermate controls, 4–9 months old, were used for all experiments presented in this study. Mice were housed on a 12 h light/dark cycle, three to five per cage and maintained in a humidity- and temperature-controlled room with water and food available ad libitum.
Tph2KI mice and age-matched WT littermate controls were separated into individual cages and surgically implanted with recording electrodes. Experiments were initiated after a 2–4 week recovery, and neurophysiological recordings were performed for 20 min while mice explored a 10.75 × 10.75-inch open-field test environment (MED-OFA-MS; MED Associates) located inside a sound-attenuating cubicle. The chamber illumination was measured at 35 lux, 5 inches from the ceiling-mounted light source (ENV-221CL; MED Associates). These experiments then were repeated in mice after chronic fluoxetine treatment (see below).
All studies were conducted with approved protocols from the Duke University Institutional Animal Care and Use Committee and were in accordance with the National Institutes of Health Guidelines for the Care and Use of Laboratory Animals.
Tail-suspension task.
Tail suspension was performed as described previously (Beaulieu et al., 2008). Briefly, naive animals were examined during the last 6 h of the light cycle using a MED Associates apparatus. Immobility times were measured over a 6 min period using MED Associates software.
Surgery.
Tph2KI mice and WT littermate controls were anesthetized with ketamine (100 mg/kg) and xylazine (10 mg/kg) and placed in a stereotaxic device, and metal ground screws were secured to the cranium above cerebellum and anterior cortex. A total of 32–64 tungsten microwires (35 μm diameter) were arranged in array bundles (Dzirasa et al., 2011a) and implanted as shown in Table 1 (all coordinates are measured from bregma). Implanted electrodes were anchored to ground screws using dental acrylic. The full details for electrode construction and surgical implantation have been described previously (Dzirasa et al., 2011a). After our initial studies, five to six additional WT and Tph2KI mice were implanted with recording electrodes solely in AMY and mPFC. Several of these mice were implanted in the anterior portion of mPFC (2.4 mm anteroposterior, 0.25 mm mediolateral, −1.0 mm dorsoventral from bregma).
Table 1.
Stereotaxic coordinates for electrode implantation
| Area | Anteroposterior (mm) | Mediolateral (mm) | Dorsoventral (mm) |
|---|---|---|---|
| NAC | +1.2 | +1.25 | −3.9 |
| DR | −4.6 | 0.1 | 2.25 |
| FrA | 2.7 | 1.0 | 1.0 |
| LH | −1.0 | −1.25 | 4.75 |
| OFC | 2.7 | 1.75 | 1.7 |
| mPFC | +1.7 | +0.25 | −1.75 |
| AMY | −1.6 | −2.5 | −4.75 |
| V_Hipp | −3.4 | +3.0 | 3.25 |
| VTA | −3.4 | +0.2 | −4.0 |
Neuronal and local field potential data acquisition.
Neuronal activity was sorted online and recorded using the Multi-Neuron Acquisition Processor system (Plexon). At the end of the recording, cells were sorted again using an offline sorting algorithm, based on cluster analysis (Plexon), to confirm the quality of the recorded cells. Only clearly defined single-unit cell clusters with interspike intervals >2 ms were used for analysis. Local field potentials (LFPs) were preamplified (500×), filtered (0.7–300 Hz), and digitized at 1000 Hz using a Digital Acquisition card (National Instruments) and a Multi-Neuron Acquisition Processor (Plexon). All electrophysiological recordings were referenced to two ground screws, and neuronal recordings were referenced online against other wires implanted in the same brain area that did not exhibit unit activity. Notably, ground screws were connected such that they were isoelectric. LFPs were recorded from every implanted tungsten electrode, and recording segments demonstrating LFP saturation resulting from movement artifacts were excluded from analysis (<0.1% of the total data recorded). Neurophysiological recordings were performed in a 10.75 × 10.75-inch open-field test environment (MED-OFA-MS; MED Associates).
Determination of LFP oscillatory power and cross-area synchrony.
Two microwires implanted in each structure were pseudorandomly selected for LFP analysis. Using MATLAB, a sliding window Fourier transform was applied to the first 10 min of the LFP signal recorded using a 1 s window with a 1 s step. The Fourier transform parameters were chosen to allow for a frequency resolution of 0.5 Hz. The LFP oscillatory power values used for analysis were then assigned as the mean power observed across the two LFP channels used for analysis. All values were averaged across the recording time window.
LFP cross-structural coherence was calculated from the LFP pairs used for LFP oscillatory power analysis using the MATLAB (MathWorks) mscohere function at a 1 s sliding window with a 1 s step. The transform parameters were chosen to allow for a frequency resolution of 0.5 Hz. This process yielded four continuous cross-structural synchrony values (one for each LFP channel pair), and the average of the four synchrony values was used for analysis. To determine the threshold for significant synchrony across a specific circuit, we performed a bootstrapping method in which the LFP time series recorded from one of the brain areas was reversed before coherence analysis. All bootstrapped measurements calculated for each brain area were grouped together across genotype to determine the range of coherence values that would be expected from two waves randomly oscillating at the same frequency.
Determination of LFP phase coherence and temporal offset for optimal phase coupling.
The same LFPs used for spectral coherence analysis between AMY and mPFC were used for phase synchrony analysis. LFP data acquired during the first 5 min of the recording period was filtered using Butterworth bandpass filters designed to isolate LFP oscillations within a 2 Hz window using a 1 Hz step (1–100 Hz). The instantaneous phase of the filtered AMY and mPFC LFPs was then determined using the Hilbert transform, and the instantaneous phase offset (φAMY − φmPFC)t was calculated for each time point. The deviation from circular uniformity for the phase offset time series was then calculated using the Rayleigh's test (Siapas et al., 2005; Jacobs et al., 2007). To determine that significant deviation from circular uniformity did not simply result from comparisons between two LFPs oscillating in the same frequency, we applied two separate bootstrapping methods. First, we reversed the phase time series for the mPFC LFP signals and recalculated the deviation from circular uniformity the Rayleigh's statistic. The Rayleigh's statistic values using this bootstrapping approach were three to four orders of magnitude less than those observed during our initial analysis. Second, we introduced temporal offsets [−2000, 2000 ms] between the two LFPs and recalculated Rayleigh's statistic at each temporal offset. We found that the introduction of temporal offsets greater that 500 ms virtually eliminated phase synchrony between the two LFPs. Although successive points in the phase offset time series were not truly independent at a sampling rate of 1000 Hz, our second bootstrapping approach demonstrated that phase synchrony did indeed exist between AMY and mPFC oscillations because the maximum phase synchrony value within the [−100, 100 ms] offset window exceeded phase synchrony within the [−2000, −500 ms] and [500, 2000 ms] offset windows for all of the animals examined in this study (n = 22, corresponding to a p value <0.00001). Most importantly, the same approach was used to quantify AMY–mPFC phase synchrony in both WT and Tph2KI mice; thus, differences identified between the two genotypes represented true phenomena. The temporal offset for optimal phase coupling was determined for each frequency band as the offset at which the highest Rayleigh's statistic value was observed.
Determination of cross-frequency phase coupling.
The quantification of cross-frequency phase coupling (CFPC) using the modulation index has been described previously (Canolty et al., 2006; Dzirasa et al., 2009, 2010). The modulation index was calculated as the average modulation value observed across all of the LFP channels corresponding to a single brain area at a Bonferroni's-corrected significance threshold of α = 0.0125 (0.05/2 brain areas/2 genotypes). Comparisons across genotype were then made using a two-tailed t test. Drug effects on CFPC were quantified using a two-way ANOVA of genotype × drug effects.
Determination of phase locking.
LFPs were filtered using Butterworth bandpass filters designed to isolate LFP oscillations within the delta (2–4 Hz) frequency range. The instantaneous phase of the filtered LFP was then determined using the Hilbert transform, and phase locking was detected using the Rayleigh's test at α = 0.05 (Siapas et al., 2005; Jacobs et al., 2007). Because phase-locking analysis is highly influenced by the number of spike events used for analysis, we used exactly 600 spike events to quantify phase locking. The first 600 spike events observed for each cell were used for analysis, and cells that fired <600 times during the 20 min recording period were excluded from this study (six mPFC and two AMY cells in WT mice, and three mPFC cells and four AMY cells in Tph2KI mice).
Fluoxetine treatment.
After our initial neurophysiological recordings, WT and Tph2KI mice were given fluoxetine (77 mg/L) in their drinking water for 21 d. This corresponded with a daily dose of ∼13–15 mg · kg−1 · d−1. Water bottles were replaced twice a week.
Statistics.
Circuit analysis was initially performed using data from the first five to six implanted WT and Tph2KI mice from which we were able to acquire neurophysiological signals for a given brain area or brain area pair. LFP oscillatory power and spectral coherence was averaged within the delta (2–4 Hz), theta (4–11 Hz), beta (15–30 Hz), low-gamma (30–55 Hz), and high-gamma (70–100 Hz) frequency bands and subject to power analysis [power = 0.9, α = 0.0011 for spectral power analysis (0.05/9 brain areas/5 frequency bands) and α = 0.0006 for coherence analysis (0.05/17 cross area comparisons/5 frequency bands)] to exclude all of the differences in specific frequency bands that were not powered to exhibit statistical differences using 12 or less mice per genotype. We chose a population size of 12 mice per group for our power analysis because multiple previous studies have shown that this population size is sufficient to characterize gross circuit alterations induced by genetic disruptions (Dzirasa et al., 2010, 2011b; Sigurdsson et al., 2010). This corresponded with an effect size threshold of 1.8 and 1.9 for spectral power and coherence, respectively, in which the effect size was given as the difference between the mean values observed in WT and Tph2KI mice normalized to the pooled SD of the two populations (Cohen's d effect size). We then implanted five more mice per genotype across the brain areas that were powered to display statistical significance within the specified number of 12 mice (i.e., AMY and mPFC). Although our initial power analysis in six mice identified the strongest differences in the AMY–mPFC delta frequency band, AMY–mPFC beta coherence was also powered to reach significance with <20 animals per group (corresponding to an effect size threshold of 1.25). Given that our additional mice (five to six per genotype) were implanted in AMY and mPFC, we compared differences in this frequency band as well. This multilevel approach was used to define potential differences in a small group of WT and Tph2KI mice and ultimately limit the number of statistical comparisons we performed across the full group of mutants.
Genotype-based differences in AMY–mPFC spectral and phase coherence were examined in the delta and beta frequency bands using a two-way ANOVA of genotype × frequency band [α = 0.005 (0.05/2 cross area comparison/5 frequencies)], followed by a false discovery rate (FDR) corrected one-way ANOVA of coherences values within the delta and beta frequency bands. All data in the text are presented as mean ± SEM unless otherwise specified.
Results
Chronic fluoxetine treatment ameliorates behavioral dysfunction in Tph2KI mice
The tail-suspension test is commonly used to model depression-like phenotypes in rodents and to evaluate the efficacy of antidepressant agents (Crawley, 2007). Consistent with our previous report (Beaulieu et al., 2008), Tph2KI mice exhibited increased immobility in the tail-suspension test compared with WT mice at baseline [two-way ANOVA of genotype × drug treatment revealed a significant genotype × drug interaction (F(1,35) = 10.4, p = 0.0027), followed by two-tailed unpaired t test (t(18) = 2.53, p = 0.02); n = 10 mice per genotype; Fig. 1A]. Importantly, no differences in gross locomotor activity were observed between WT and Tph2KI mice at baseline [mixed-model ANOVA of genotype × drug treatment revealed a significant drug effect (F(1,21) = 22.65, p = 1.1 × 10⁻⁴); unpaired two-tailed t test failed to reveal significant genotype effects on baseline locomotor activity (t(21) = 0.24, p = 0.81); n = 10 WT and 13 Tph2KI mice per group; Fig. 1B]. Chronic fluoxetine treatment decreased immobility in Tph2KI mice (t(17) = 3.14, p = 0.006; n = 9 mice treated with fluoxetine) but had no effect on immobility time in WT mice (t(18) = 1.37, p = 0.19; n = 10 mice treated with fluoxetine). Conversely, fluoxetine treatment significantly decreased forward locomotion in the mutants (t(12) = 4.39, p = 8.8 × 10⁻⁴ using paired two-tailed t test) and their WT littermates (t(9) = 2.52, p = 0.03 using paired two-tailed t test).
Figure 1.

Chronic fluoxetine ameliorate behavioral dysfunction in Tph2KI mice. A, Immobility time on a tail-suspension task in WT and Tph2KI mice. #p < 0.05 using FDR-corrected paired t test for within-drug comparisons across genotype; *p < 0.05 using FDR-corrected paired t test for within-genotype comparisons; n = 10 mice per genotype per drug condition. B, Locomotor behavioral profiles in WT and Tph2KI mice. *p < 0.05 using FDR-corrected paired t test for within-genotype comparison; n = 10 WT and 13 Tph2KI mice treated with water, and 10 WT and 9 Tph2KI mice treated with fluoxetine.
Circuit dysfunction in Tph2KI mice exhibits face validity with putative MDD endophenotype
WT and Tph2KI mice implanted with microelectrodes recovered well and behaved normally, allowing us to simultaneously record multicircuit neurophysiological activity across widely distributed cortical and limbic circuits in awake, non-restrained conditions (Fig. 2). First, we set out to determine whether Tph2KI mice exhibited changes in neurophysiological oscillatory power across any of the implanted brain areas. Although Tph2KI mice tended to exhibit lower OFC total oscillatory power, no differences across any of the brain areas or frequency bands examined were powered to reach statistical significance using the number of animals outlined for this study (i.e., low Cohen's d effect size, including AMY and mPFC; Fig. 3 and Table 2).
Figure 2.

Neurophysiological circuit examined in Tph2KI mice. A, Widely distributed circuit proposed to underlie behavioral endophenotypes in MDD. B, Ten second trace of LFP oscillations recorded concurrently from the entire circuit shown in A in a freely behaving WT mouse.
Figure 3.

LFP oscillatory power profiles within limbic brain areas in WT and Tph2KI mice. Differences between WT and Tph2KI mice were not powered to reach statistical significance (n = 6 mice per genotype).
Table 2.
Stats table of Cohen's d values for LFP power analysis between WT and Tph2KI mice
| Area | n (WT/Tph2KI) | Cohen's d effect size |
||||
|---|---|---|---|---|---|---|
| Delta | Theta | Beta | Low gamma | High gamma | ||
| NAC | 6/6 | 0.106 | 0.544 | 0.219 | 0.545 | 0.023 |
| AMY | 6/6 | 0.423 | 0.800 | 0.444 | 0.162 | 0.012 |
| DR | 6/6 | 0.214 | 0.379 | 0.391 | 0.150 | 0.221 |
| FrA | 6/6 | 0.518 | 0.251 | 0.043 | 0.101 | 0.344 |
| LH | 6/6 | 0.071 | 0.592 | 0.084 | 0.201 | 0.751 |
| OFC | 6/6 | 0.607 | 0.419 | 1.119 | 0.848 | 0.541 |
| mPFC | 6/6 | 0.219 | 0.081 | 0.398 | 0.774 | 0.147 |
| VTA | 6/6 | 0.415 | 1.109 | 0.371 | 0.373 | 0.320 |
| V_Hipp | 6/6 | 0.347 | 0.007 | 0.081 | 0.247 | 0.351 |
Because cross-brain area synchrony has been implicated as a neurophysiological correlate of brain circuit function, we also examined whether Tph2KI mice exhibited differences in spectral coherence across the circuit shown in Figure 2A that were powered to research statistical significance using the number of animals outlined for this study (Fig. 4). When we performed power analysis on spectral coherence values observed across select individual frequency bands and brain area pairs, we found that only the AMY–mPFC delta spectral coherence band was powered to reach statistical significance with the number of animals proposed (i.e., high effect size; Table 3). Thus, we implanted five to six additional WT and Tph2KI mice with recording electrodes solely in AMY and mPFC and focused our analysis on investigating AMY–mPFC delta network function in Tph2KI mice. Because our additional animals were implanted in AMY–mPFC, we also investigated AMY–mPFC beta network function in the full group of mice (i.e., 11 WT and 12 mutant mice). Our findings in the full group of mice confirmed that Tph2KI mice exhibited statistically significant increases in AMY–mPFC delta and beta spectral coherence [two-way ANOVA of genotype × frequency band revealed a significant genotype effect on spectral coherence between AMY and mPFC (F(1,109) = 15.84 p = 1.3 × 10⁻⁴); FDR-corrected one-way ANOVA showed significant genotype effects on delta and beta synchrony (F(1,21) = 13.56, p = 1.5 × 10⁻³ and F(1,21) = 4.83, p = 0.039 for delta and beta spectral coherence, respectively); n = 11–12 mice per genotype; Fig. 5A]. Notably, these significant differences were still observed when our analysis was restricted to periods in which WT and Tph2KI mice were not moving [two-way ANOVA of genotype × frequency band revealed a significant genotype effect on delta/beta spectral coherence between AMY and mPFC (F(1,41) = 16.02, p = 3 × 10⁻⁴); FDR-corrected one-way ANOVA showed significant genotype effects on delta and beta synchrony (F(1,20) = 9.19, p = 0.007 and F(1,20) = 6.9, p = 0.017 for delta and beta spectral coherence, respectively); Fig. 5B]. This provides evidence that the enhanced AMY–mPFC synchrony observed in Tp2KI mice did not simply reflect subtle differences in the locomotor profiles of these mice.
Figure 4.
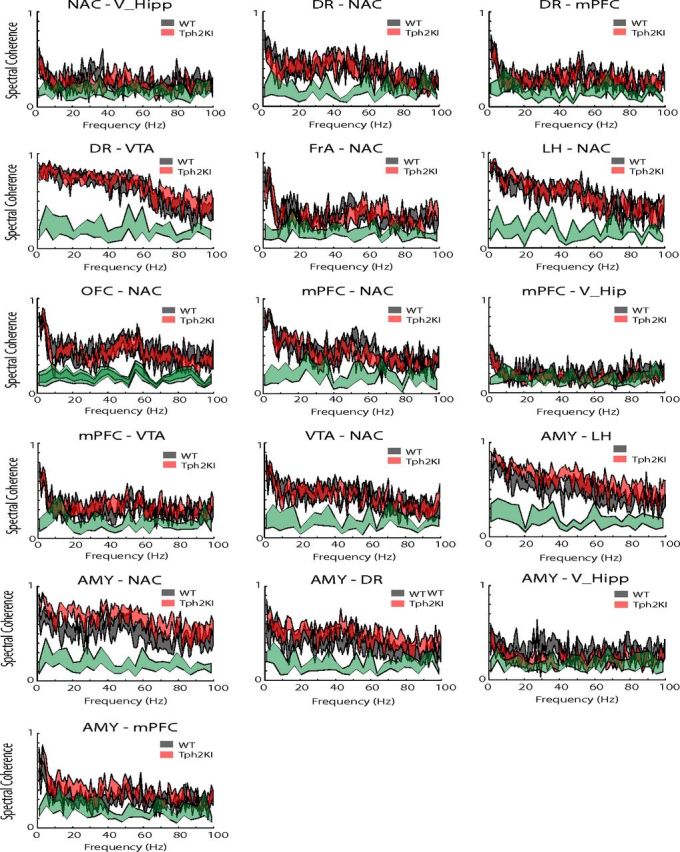
Cross-area spectral coherence across limbic circuits in WT and Tph2KI mice. Data are shown as mean ± SEM. The significance threshold for cross-area synchrony is shown in green for each plot (maximum of 95% confidence interval); n = 5–6 mice per genotype per circuit.
Table 3.
Stats table for LFP spectral coherence power analysis between WT and Tph2KI mice
| Area1 | Area2 | n (WT/Tph2KI) | Cohen's d effect size |
||||
|---|---|---|---|---|---|---|---|
| Delta | Theta | Beta | Low gamma | High gamma | |||
| NAC | V_Hip | 6/6 | 0.240 | 0.004 | 0.520 | 0.047 | 0.581 |
| AMY | NAC | 6/6 | 1.665a | 0.524 | 1.469a | 0.896 | 0.847 |
| AMY | DR | 6/6 | 0.686 | 0.160 | 0.721 | 0.517 | 0.994 |
| AMY | LH | 6/5 | 1.060 | 0.409 | 0.835 | 0.785 | 0.758 |
| AMY | mPFC | 6/6 | 2.869b | 0.834 | 1.551a | 0.800 | 0.642 |
| AMY | V_Hipp | 6/5 | 0.342 | 0.432 | 1.549a | 0.680 | 0.786 |
| DR | NAC | 6/5 | 0.696 | 0.948 | 0.029 | 0.235 | 0.039 |
| DR | mPFC | 6/6 | 0.181 | 0.489 | 0.292 | 0.048 | 0.403 |
| DR | VTA | 6/5 | 0.055 | 0.281 | 0.271 | 0.107 | 0.653 |
| FrA | NAC | 6/5 | 0.250 | 0.083 | 0.047 | 0.519 | 0.393 |
| LH | NAC | 6/5 | 0.866 | 0.350 | 0.508 | 0.161 | 0.352 |
| OFC | NAC | 6/6 | 0.190 | 0.234 | 0.207 | 0.175 | 0.107 |
| mPFC | NAC | 6/6 | 0.675 | 0.178 | 0.405 | 0.515 | 0.170 |
| mPFC | VTA | 6/6 | 0.649 | 0.078 | 0.621 | 0.219 | 0.579 |
| mPFC | V_Hipp | 6/5 | 0.127 | 0.047 | 1.038 | 0.564 | 1.090 |
| VTA | NAC | 6/6 | 0.760 | 0.611 | 0.172 | 0.343 | 0.303 |
aValues that corresponded to comparisons powered to reach statistical significance with <20 mice per group.
bCohen's d values that corresponded with comparisons powered to reach statistical significance with <12 mice per group.
Figure 5.
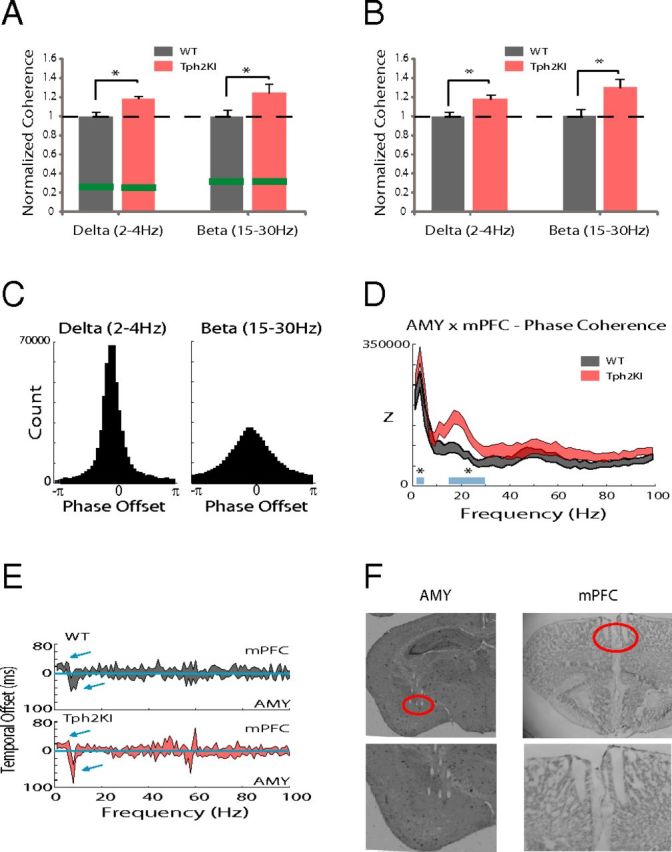
Cortico-amygdala synchrony dysfunction in Tph2KI mice. A, Two-way ANOVA of genotype × frequency followed by one-way ANOVA of within-frequency band spectral coherence revealed significantly increased AMY–mPFC delta and beta spectral coherence in the full group of Tph2KI mice. Data are shown as the mean coherence within the delta and beta frequency bands normalized to the mean values observed in WT mice within the same frequency band (mean ± SEM); *p < 0.05. The threshold for significant coherence is shown in green (maximum of 95% confidence interval). B, AMY–mPFC LFP spectral coherence in WT and Tph2KI mice when mice were not engaged in forward locomotion (i.e., speeds below the detection threshold of 3 cm/s). Data are shown as the mean coherence within the delta and beta frequency bands normalized to the mean values observed in WT mice within the same frequency band (mean ± SEM); *p < 0.05. C, Distribution of oscillatory phase offsets between AMY and mPFC delta (left) and beta (right) oscillations in a WT mouse. D, AMY–mPFC delta and beta phase coherence in WT and Tph2KI mice (Z corresponds to Rayleigh's statistic; *p < 0.05 for comparisons of delta and beta phase coherence across genotype; n = 11–12 mice per genotype). E, Temporal offsets in which the optimal phase coherence between AMY and mPFC LFPs were observed for each frequency. The mean ± 95% confidence interval is shown; n = 11 mice per genotype. F, Histology showing representative microwire lesions tracks in mPFC and AMY. Microwire tips are highlighted by red circle.
Network dynamics of mPFC–AMY circuits
Although the increased AMY–mPFC delta and beta spectral coherence in Tph2KI mice demonstrated that the mutants exhibit increased synchronization between the two areas, our findings did not disambiguate whether the synchrony was attributable to correlated fluctuations in oscillatory amplitude or to a consistent phase relationship between the two signals (which relates to oscillation timing) (Adhikari et al., 2010). Thus, to further investigate the increased AMY–mPFC spectral synchrony observed in Tph2KI mice, we quantified the phase relationship between ongoing AMY and mPFC oscillations within the delta and beta frequency bands. We found that WT mice exhibited a consistent phase relationship between AMY and mPFC oscillations within the delta and beta frequency bands (Fig. 5C). Additionally, AMY–mPFC delta and beta phase synchrony were significantly increased in Tph2KI mice [two-way ANOVA of genotype × frequency revealed a significant genotype effect on phase synchrony between AMY and mPFC (F(1,109) = 18.98, p = 3.2 × 10⁻⁵) and FDR-corrected one-way ANOVA of within-band phase synchrony showed significant genotype effects on delta and beta synchrony (F(1,21) = 6.03, p = 0.023 and F(1,21) = 9.60, p = 0.006 for delta and beta phase synchrony, respectively); n = 11 mice per genotype; Fig. 5D]. Interestingly, when we introduced temporal offsets into AMY and mPFC oscillations and recalculated phase synchrony, we found that AMY delta oscillations optimally phase synchronized with mPFC delta oscillations recorded 20 ± 4 and 16 ± 3 ms in the past in WT mice and Tph2KI mice, respectively (Fig. 5E). Conversely, AMY beta oscillations better phase synchronized with ongoing mPFC beta oscillations in WT mice and Tph2KI mice (optimal beta phase synchrony delay, 4 ± 2 and 3 ± 1 ms in WT and Tph2KI mice, respectively).
After demonstrating that Tph2KI mice exhibit increased delta and beta synchrony, we examined whether delta and beta oscillations were coupled within AMY and mPFC. The phase of lower-frequency oscillations has been shown to modulate the amplitude of higher-frequency oscillations across multiple limbic brain regions, including mPFC, V_Hipp, and NAC in normal mice (Bragin et al., 1995; Sirota et al., 2008; Dzirasa et al., 2009, 2010). When we performed CFPC analysis, we found significant coupling between the phase of delta oscillations and the amplitude of beta oscillations in AMY and mPFC in WT mice (Fig. 6A,B). Furthermore, AMY and mPFC delta–beta CFPC was significantly increased in the mutants (t(20) = 2.42, p = 0.03 and t(20) = 2.44, p = 0.02 for mPFC and AMY, respectively; Fig. 6B). Unit activity was coupled to the phase of local delta oscillatory activity, confirming that AMY and mPFC delta oscillations were locally relevant (n = 7 of 31 AMY single units and 8 of 28 mPFC units that exhibited phase locking to local delta oscillations in WT mice; Z = 6.3 ± 0.7 and 11.3 ± 4.0 for significantly phase-locked AMY and mPFC units, respectively, where Z = −ln(P); Fig. 6C,D). AMY and mPFC delta oscillations were locally relevant in Tph2KI mice as well (n = 3 of 19 AMY single units and 4 of 14 mPFC units that exhibited phase locking to local delta oscillations in Tph2KI mice; Z = 4.5 ± 0.5 and 6.4 ± 1.0 for significantly phase-locked AMY and mPFC units, respectively; Fig. 6C,D).
Figure 6.

Limbic intra-network dysfunction in Tph2KI mice. A, The modulation index (M) was determined for mPFC and AMY. The images depict representative examples of stepwise modulation functions for LFP amplitude (10–40 Hz, 1 Hz step) by LFP phase (1–10 Hz, 0.5 Hz step) in WT and Tph2KI mice. B, Top, The 1.5 s mPFC and AMY delta oscillation traces (gray) overlaid on beta oscillation traces (green) filtered from the same LFP. Blue arrows show bouts of increased beta oscillation amplitudes that were phase coupled to the rising phase of delta oscillations. Bottom, *p < 0.05 Tph2KI mice exhibited significantly increased AMY and mPFC CFPC as quantified using the modulation index (M). The dashed blue line corresponds with the threshold for significant CFPC. C, D, Phase distribution of mPFC (C) and AMY (D) neuron that displayed phase locking to locally recorded delta oscillations. The Rayleigh's statistic is shown for each neuron, where Z = −ln(P); n = 11–12 mice per genotype.
Circuit dysfunction in Tph2KI mice exhibits predictive validity with MDD
When we examined the effect of chronic fluoxetine treatment on the neurophysiological changes observed in Tph2KI mice, we found that such a treatment decreased AMY–mPFC delta coherence [mixed-model ANOVA of genotype × drug treatment revealed a significant genotype × treatment effect on delta coherence between AMY and mPFC (F(1,17) = 4.68, p = 0.045); FDR-corrected two-tailed paired t test showed significant treatment effects on delta synchrony in Tph2KI mice (t(10) = 4.62, p = 9.48 × 10⁻⁴); n = 11 Tph2KI mice; Fig. 7]. Conversely, chronic fluoxetine treatment had no effect on AMY–mPFC delta coherence in WT mice [FDR-corrected two-tailed paired t test failed to show significant treatment effects on delta synchrony (t(7) = 1.13, p = 0.30; n = 8 WT mice); Fig. 7].
Figure 7.

Chronic treatment with fluoxetine selectively reverses neurophysiological deficits in Tph2KI mice. Effects of chronic fluoxetine treatment in Tph2KI mice. Treatment with fluoxetine decreased mPFC–AMY delta spectral coherence in Tph2KI mice. Although beta coherence and mPFC CFPC tended to be lower in Tph2KI mice after chronic fluoxetine treatment, these differences did not reach statistical significance. *p < 0.05. Data are shown as the mean ± SEM. CFPC was quantified using the modulation index (M); n = 8 WT and 11 Tph2KI mice.
Chronic fluoxetine also tended to decrease AMY–mPFC beta coherence and mPFC delta–beta CFPC in Tph2KI mice, although these results did not reach statistical significance [mixed-model ANOVA of genotype × drug treatment failed to reveal a significant treatment effect on beta coherence between AMY and mPFC (F(1,17) = 2.18, p = 0.16); mixed-model ANOVA of genotype × drug treatment failed to reveal a significant treatment effect on mPFC delta–beta CFPC (F(1,17) = 4.04, p = 0.061)]. Treatment with fluoxetine had no effect on AMY delta–beta CFPC [mixed-model ANOVA of genotype × drug treatment failed to reveal a significant treatment effect on beta coherence between AMY and mPFC (F(1,17) = 0.102, p = 0.75); Fig. 7].
Discussion
Cross-structural neural oscillatory synchrony has gained attention as a putative mechanism through which the brain binds the activity of populations of neurons distributed across many cortical and subcortical structures to generate behavior. For example, studies have shown that enhanced synchronization of amygdalar and hippocampal oscillations reflects fear memory retrieval (Seidenbecher et al., 2003) and that hippocampus and PFC oscillations synchronize during anxiety (Adhikari et al., 2010). Together, these studies suggest that the long-range synchronization of neural oscillatory activity may play a role in coordinating activity within and between structures that define broad emotional circuits and raise the hypothesis that alterations in neural oscillatory phase signaling may mediate several neuropsychiatric disorders (Uhlhaas and Singer, 2006; Uhlhaas et al., 2008). Importantly, recent studies have suggested that alterations in neural oscillatory phase timing may mediate the behavioral manifestations observed across other brain disorders, such as Parkinson's disease, schizophrenia, and bipolar disorder (Fuentes et al., 2009; Dzirasa et al., 2010, 2011b Sigurdsson et al., 2010).
Here we describe functional neural network changes in a mouse engineered to express a loss-of-function polymorphism in TPH2 identified in human depressed subjects. Our findings show that Tph2KI mice carrying the Tph2(R439H) allele exhibit an increase in AMY–mPFC delta synchrony. LFP oscillations reflect a mixture of local and regional signals (Kajikawa and Schroeder, 2011). As such, increased delta synchrony observed across a given brain circuit can result from artifacts including volume conduction of delta oscillations from a distinct brain area or increased delta activity at a common ground source. These factors are unlikely to account for the increased AMY–mPFC delta synchrony observed in Tph2KI mice given that all of the brain areas we recorded in Tph2KI mice were referenced to a common ground, and the strongest gene effect sizes were observed across the AMY–mPFC circuit (Table 3). Additionally, local single-unit activity and local beta activity entrains to delta oscillations within AMY and mPFC. Finally, delta synchronize between AMY and mPFC optimally synchronize in the delta frequency range when mPFC oscillations precede AMY oscillations by ∼15–20 ms (timing consistent with the activation of a single monosynaptic efferent from mPFC to AMY) (Kumar et al., 2013). Together, this suggests that the enhanced AMY–mPFC delta synchrony observed in Tph2KI mice likely reflects altered function across a top-down control network (i.e., cortical influence over subcortical activity). Conversely, because AMY and mPFC beta oscillations optimally phase synchrony with no delay, the increased AMY–mPFC beta synchrony observed in the mutants may result from altered activity across a third (and as yet unidentified) brain area. This is consistent with our previous findings that demonstrate that direct optogenetic activation of mPFC projection neurons in the delta frequency range is sufficient to enhance beta synchrony throughout the limbic circuit (Kumar et al., 2013).
Our results also showed that Tph2KI mice exhibit increased coupling between local delta and beta oscillations within mPFC and AMY. Treatment with fluoxetine reduced AMY–mPFC delta coherence and tended to reduce mPFC delta–beta coupling in Tph2KI mice, in addition to normalizing the immobility time of the mutants on the tail-suspension task (for a summary of findings, see Fig. 8). Together, this suggests that these neurophysiological changes may represent state (as opposed to trait) markers of MDD endophenotypes. Notably, these neurophysiological signatures may reflect compensatory changes in cortical driven feedback/feedforward control circuits in response to an upstream amygdalar dysfunction (Savitz and Drevets, 2009a); however, additional studies will be necessary to test this hypothesis.
Figure 8.

Model of genetic and antidepressant effects on PFC and AMY circuits. PFC delta oscillations exhibit a directional influence on AMY delta oscillations (top-down signal). Delta oscillations phase couple with beta oscillations within AMY and PFC. AMY and PFC beta oscillations show instantaneous coupling, suggesting that these oscillations may be synchronized by a third unknown structure. In Tph2KI mice, delta and beta cross-area synchrony and within-area delta–beta coupling are increased. Antidepressants suppress delta coupling between AMY and PFC.
Alterations in PFC and AMY function have been described in human subjects with MDD (for a critical review, see Drevets et al., 2008). Indeed, brain stimulation modalities (i.e., deep-brain stimulation and transcranial magnetic stimulation) that directly modulate PFC activity have been shown to ameliorate symptoms in humans subjects with MDD (Mayberg et al., 2005; George et al., 2010) and rodents models of depression (Covington et al., 2010; Kumar et al., 2013). Furthermore, alterations in AMY functional connectivity with multiple cortical brain regions have been described in human depressed subjects (Anand et al., 2005; Friedel et al., 2009). Although these studies tended to identify decreased functional connectivity between AMY and cortical areas, it is important to note that the neurophysiological signals analyzed in these fMRI studies were sampled at much lower frequencies (i.e., <0.1 Hz) than those described in our study (i.e., 2–100 Hz). Conversely, in a small study using magnetoencephalography (i.e., neurophysiological activity sampled at 0–300 Hz), increases in amygdalo-cortical beta coherence during a working memory task were shown to negatively predict a rapid antidepressant response to ketamine in human depressed subjects (Salvadore et al., 2010). Interestingly, studies also link alterations in AMY–mPFC circuit function with polymorphisms in genes responsible for 5-HT homeostasis in humans and rodents (Friedel et al., 2009; Narayanan et al., 2011).
Here, we showed that Tph2KI mice exhibit increased AMY–mPFC beta synchrony and increased delta–beta coupling in AMY. Moreover, these neurophysiological alterations persisted after treatment with chronic fluoxetine (for a summary of findings, see Fig. 8). Thus, AMY–mPFC beta coherence and AMY delta–beta coupling may represent trait markers of MDD endophenotypes. Alternatively, because the human polymorphism expressed in the Tph2KI mice was originally identified in human subjects with treatment refractory MDD (Zhang et al., 2005), these neurophysiological alterations may reflect brain circuit modifications that are refractory to standard pharmacotherapeutics that target the 5-HT system. Additional studies will be necessary to test these hypotheses. Nevertheless, because AMY–PFC delta coherence corresponds with a top-down directional control circuit, and the altered AMY circuit function observed in the mutant mice persists despite treatment with fluoxetine, our findings raise the hypothesis that 5-HT deficiency yields dysfunctional regulation of AMY function by cortical inputs and ultimately leads to affective deregulation. Notably, our recent findings demonstrate that the direct activation of PFC projection neurons is sufficient to enhance beta synchrony across limbic networks (Kumar et al., 2013). Thus, the enhanced limbic beta synchrony observed in the Tph2KI mice may indeed reflect a 5-HT-dependent dysregulation of cortical-dependent feedback control networks.
Overall, our findings link functional changes in brain 5-HT homeostasis that may confer risk for MDD with neurophysiological deficits in AMY and mPFC microcircuits. Notably, although our findings described changes in AMY–mPFC circuit function in Tph2KI mice, several other putative significant circuit changes (i.e., area interactions with medium effect sizes) were overlooked because of the large number of brain areas investigated in this study and the limited number of mice recorded in our study (i.e., AMY–NAC circuits). Thus, future structurally targeted studies with larger groups of mice are warranted to further characterize several other putative AMY-based circuit deficits that may be present in the Tph2KI animals.
Depression is a heterogeneous neuropsychiatric illness, and all animal models generated to date have failed to recapitulate the full spectrum of endophenotypes observed in the disorder (Nestler and Hyman, 2010). Furthermore, it remains unclear the extent to which the behavioral alterations observed in animal models of depression (i.e., the Tail Suspension Test) actually exhibit face or predictive validity with the behavioral endophenotypes observed in human subjects (Nestler and Hyman, 2010). Here we use multicircuit neurophysiological recordings in a hyposerotonergic mouse that exhibits construct and face validity (as judged by multiple biochemical and behavioral endophenotypes) with MDD risk. Although the genetic mutation expressed in Tph2KI mice has only been identified in a small subset of human subjects with depression (Zhang et al., 2005), Tph2KI mice have been validated as a genetic mouse model of robust 5-HT deficiency (Beaulieu et al., 2008), and other polymorphisms in the Tph2 gene have been described in human patients with MDD (Zill et al., 2004; Tsai et al., 2009). Thus, it is likely that many different genetic factors that confer risk for MDD may converge on the same neurophysiological circuits that were found to be dysfunctional in the Tph2KI mice. Importantly, the altered circuits identified in the Tph2KI mice exhibit predictive and face validity with circuit endophenotypes observed in humans with MDD. Thus, our findings highlight a novel approach that can be used to investigate the role that various genetic risk factors play in mediating brain circuit-based endophenotypes observed across neuropsychiatric illnesses.
Footnotes
This work was supported in part by National Institutes of Health (NIH) Grants P50MH060451-RS1 and R01MH099192 (K.D.), P50MH060451-10 (M.A.L.N.), and R01MH079201 (M.G.C.) and by The Safra Foundation (M.A.L.N.). B.D.S. was the recipient of a Minority Supplement award to the same grant (R01MH079201-03S1) and is currently the recipient of an National Research Service Award postdoctoral fellowship (NIH F32MH093092). A special thanks to Freeman Hrabowski, Robert and Jane Meyerhoff, and the Meyerhoff Scholarship Program. We thank L. Oliveira, T. Jones, and G. Wood for miscellaneous support, S. Halkiotis for proofreading of this manuscript, and G. Lehew for technical support.
References
- Adhikari A, Topiwala MA, Gordon JA. Synchronized activity between the ventral hippocampus and the medial prefrontal cortex during anxiety. Neuron. 2010;65:257–269. doi: 10.1016/j.neuron.2009.12.002. [DOI] [PMC free article] [PubMed] [Google Scholar]
- Akil H, Brenner S, Kandel E, Kendler KS, King MC, Scolnick E, Watson JD, Zoghbi HY. Medicine. The future of psychiatric research: genomes and neural circuits. Science. 2010;327:1580–1581. doi: 10.1126/science.1188654. [DOI] [PMC free article] [PubMed] [Google Scholar]
- Anand A, Li Y, Wang Y, Wu J, Gao S, Bukhari L, Mathews VP, Kalnin A, Lowe MJ. Antidepressant effect on connectivity of the mood-regulating circuit: an FMRI study. Neuropsychopharmacology. 2005;30:1334–1344. doi: 10.1038/sj.npp.1300725. [DOI] [PubMed] [Google Scholar]
- American Psychiatric Association. Diagnostic and statistical manual of mental disorders DSM-IV-TR. Washington, DC: American Psychiatric Association; 2000. [Google Scholar]
- Beaulieu JM, Zhang X, Rodriguiz RM, Sotnikova TD, Cools MJ, Wetsel WC, Gainetdinov RR, Caron MG. Role of GSK3 beta in behavioral abnormalities induced by serotonin deficiency. Proc Natl Acad Sci U S A. 2008;105:1333–1338. doi: 10.1073/pnas.0711496105. [DOI] [PMC free article] [PubMed] [Google Scholar]
- Blazer DG, Kessler RC, McGonagle KA, Swartz MS. The prevalence and distribution of major depression in a national community sample: the National Comorbidity Survey. Am J Psychiatry. 1994;151:979–986. doi: 10.1176/ajp.151.7.979. [DOI] [PubMed] [Google Scholar]
- Bragin A, Jand ó G, Nádasdy Z, Hetke J, Wise K, Buzsáaki G. Gamma (40–100 Hz) oscillation in the hippocampus of the behaving rat. J Neurosci. 1995;15:47–60. doi: 10.1523/JNEUROSCI.15-01-00047.1995. [DOI] [PMC free article] [PubMed] [Google Scholar]
- Canolty RT, Edwards E, Dalal SS, Soltani M, Nagarajan SS, Kirsch HE, Berger MS, Barbaro NM, Knight RT. High gamma power is phase-locked to theta oscillations in human neocortex. Science. 2006;313:1626–1628. doi: 10.1126/science.1128115. [DOI] [PMC free article] [PubMed] [Google Scholar]
- Covington HE, 3rd, Lobo MK, Maze I, Vialou V, Hyman JM, Zaman S, LaPlant Q, Mouzon E, Ghose S, Tamminga CA, Neve RL, Deisseroth K, Nestler EJ. Antidepressant effect of optogenetic stimulation of the medial prefrontal cortex. J Neurosci. 2010;30:16082–16090. doi: 10.1523/JNEUROSCI.1731-10.2010. [DOI] [PMC free article] [PubMed] [Google Scholar]
- Crawley JN. What's Wrong With My Mouse?: behavioral phenotyping of transgenic and knockout mice. Ed 2. Hoboken, NJ: Wiley; 2007. [Google Scholar]
- Drevets WC. Neuroimaging and neuropathological studies of depression: implications for the cognitive-emotional features of mood disorders. Curr Opin Neurobiol. 2001;11:240–249. doi: 10.1016/s0959-4388(00)00203-8. [DOI] [PubMed] [Google Scholar]
- Drevets WC, Price JL, Furey ML. Brain structural and functional abnormalities in mood disorders: implications for neurocircuitry models of depression. Brain Struct Funct. 2008;213:93–118. doi: 10.1007/s00429-008-0189-x. [DOI] [PMC free article] [PubMed] [Google Scholar]
- Dzirasa K, Ramsey AJ, Takahashi DY, Stapleton J, Potes JM, Williams JK, Gainetdinov RR, Sameshima K, Caron MG, Nicolelis MA. Hyperdopaminergia and NMDA receptor hypofunction disrupt neural phase signaling. J Neurosci. 2009;29:8215–8224. doi: 10.1523/JNEUROSCI.1773-09.2009. [DOI] [PMC free article] [PubMed] [Google Scholar]
- Dzirasa K, Coque L, Sidor MM, Kumar S, Dancy EA, Takahashi JS, McClung CA, Nicolelis MA. Lithium ameliorates nucleus accumbens phase signaling dysfunction in a genetic mouse model of mania. J Neurosci. 2010;30:16314–16323. doi: 10.1523/JNEUROSCI.4289-10.2010. [DOI] [PMC free article] [PubMed] [Google Scholar]
- Dzirasa K, Fuentes R, Kumar S, Potes JM, Nicolelis MA. Chronic in vivo multi-circuit neurophysiological recordings in mice. J Neurosci Methods. 2011a;195:36–46. doi: 10.1016/j.jneumeth.2010.11.014. [DOI] [PMC free article] [PubMed] [Google Scholar]
- Dzirasa K, McGarity DL, Bhattacharya A, Kumar S, Takahashi JS, Dunson D, McClung CA, Nicolelis MA. Impaired limbic gamma oscillatory synchrony during anxiety-related behavior in a genetic mouse model of bipolar mania. J Neurosci. 2011b;31:6449–6456. doi: 10.1523/JNEUROSCI.6144-10.2011. [DOI] [PMC free article] [PubMed] [Google Scholar]
- Friedel E, Schlagenhauf F, Sterzer P, Park SQ, Bermpohl F, Strohle A, Stoy M, Puls I, Hagele C, Wrase J, Buchel C, Heinz A. 5-HTT genotype effect on prefrontal-amygdala coupling differs between major depression and controls. Psychopharmacology (Berl) 2009;205:261–271. doi: 10.1007/s00213-009-1536-1. [DOI] [PubMed] [Google Scholar]
- Fuentes R, Petersson P, Siesser WB, Caron MG, Nicolelis MA. Spinal cord stimulation restores locomotion in animal models of Parkinson's disease. Science. 2009;323:1578–1582. doi: 10.1126/science.1164901. [DOI] [PMC free article] [PubMed] [Google Scholar]
- George MS, Lisanby SH, Avery D, McDonald WM, Durkalski V, Pavlicova M, Anderson B, Nahas Z, Bulow P, Zarkowski P, Holtzheimer PE, 3rd, Schwartz T, Sackeim HA. Daily left prefrontal transcranial magnetic stimulation therapy for major depressive disorder: a sham-controlled randomized trial. Arch Gen Psychiatry. 2010;67:507–516. doi: 10.1001/archgenpsychiatry.2010.46. [DOI] [PubMed] [Google Scholar]
- Jacobs J, Kahana MJ, Ekstrom AD, Fried I. Brain oscillations control timing of single-neuron activity in humans. J Neurosci. 2007;27:3839–3844. doi: 10.1523/JNEUROSCI.4636-06.2007. [DOI] [PMC free article] [PubMed] [Google Scholar]
- Jacobsen JP, Siesser WB, Sachs BD, Peterson S, Cools MJ, Setola V, Folgering JH, Flik G, Caron MG. Deficient serotonin neurotransmission and depression-like serotonin biomarker alterations in tryptophan hydroxylase 2 (Tph2) loss-of-function mice. Mol Psychiatry. 2012;17:694–704. doi: 10.1038/mp.2011.50. [DOI] [PMC free article] [PubMed] [Google Scholar]
- Kajikawa Y, Schroeder CE. How local is the local field potential? Neuron. 2011;72:847–858. doi: 10.1016/j.neuron.2011.09.029. [DOI] [PMC free article] [PubMed] [Google Scholar]
- Kessler RC, McGonagle KA, Zhao S, Nelson CB, Hughes M, Eshleman S, Wittchen HU, Kendler KS. Lifetime and 12-month prevalence of DSM-III-R psychiatric disorders in the United States. Results from the National Comorbidity Survey. Arch Gen Psychiatry. 1994;51:8–19. doi: 10.1001/archpsyc.1994.03950010008002. [DOI] [PubMed] [Google Scholar]
- Krishnan V, Nestler EJ. The molecular neurobiology of depression. Nature. 2008;455:894–902. doi: 10.1038/nature07455. [DOI] [PMC free article] [PubMed] [Google Scholar]
- Kumar S, Black SJ, Hultman R, Szabo ST, Demaio KD, Du J, Katz BM, Feng G, Covington HE, 3rd, Dzirasa K. Cortical control of affective networks. J Neurosci. 2013;33:1116–1129. doi: 10.1523/JNEUROSCI.0092-12.2013. [DOI] [PMC free article] [PubMed] [Google Scholar]
- Liotti M, Mayberg HS. The role of functional neuroimaging in the neuropsychology of depression. J Clin Exp Neuropsychol. 2001;23:121–136. doi: 10.1076/jcen.23.1.121.1223. [DOI] [PubMed] [Google Scholar]
- Mayberg HS, Lozano AM, Voon V, McNeely HE, Seminowicz D, Hamani C, Schwalb JM, Kennedy SH. Deep brain stimulation for treatment-resistant depression. Neuron. 2005;45:651–660. doi: 10.1016/j.neuron.2005.02.014. [DOI] [PubMed] [Google Scholar]
- Narayanan V, Heiming RS, Jansen F, Lesting J, Sachser N, Pape HC, Seidenbecher T. Social defeat: impact on fear extinction and amygdala-prefrontal cortical theta synchrony in 5-HTT deficient mice. PLoS One. 2011;6:e22600. doi: 10.1371/journal.pone.0022600. [DOI] [PMC free article] [PubMed] [Google Scholar]
- Nestler EJ, Hyman SE. Animal models of neuropsychiatric disorders. Nat Neurosci. 2010;13:1161–1169. doi: 10.1038/nn.2647. [DOI] [PMC free article] [PubMed] [Google Scholar]
- Salvadore G, Cornwell BR, Sambataro F, Latov D, Colon-Rosario V, Carver F, Holroyd T, DiazGranados N, Machado-Vieira R, Grillon C, Drevets WC, Zarate CA., Jr Anterior cingulate desynchronization and functional connectivity with the amygdala during a working memory task predict rapid antidepressant response to ketamine. Neuropsychopharmacology. 2010;35:1415–1422. doi: 10.1038/npp.2010.24. [DOI] [PMC free article] [PubMed] [Google Scholar]
- Savitz J, Drevets WC. Bipolar and major depressive disorder: neuroimaging the developmental-degenerative divide. Neurosci Biobehav Rev. 2009a;33:699–771. doi: 10.1016/j.neubiorev.2009.01.004. [DOI] [PMC free article] [PubMed] [Google Scholar]
- Savitz JB, Drevets WC. Imaging phenotypes of major depressive disorder: genetic correlates. Neuroscience. 2009b;164:300–330. doi: 10.1016/j.neuroscience.2009.03.082. [DOI] [PMC free article] [PubMed] [Google Scholar]
- Seidenbecher T, Laxmi TR, Stork O, Pape HC. Amygdalar and hippocampal theta rhythm synchronization during fear memory retrieval. Science. 2003;301:846–850. doi: 10.1126/science.1085818. [DOI] [PubMed] [Google Scholar]
- Siapas AG, Lubenov EV, Wilson MA. Prefrontal phase locking to hippocampal theta oscillations. Neuron. 2005;46:141–151. doi: 10.1016/j.neuron.2005.02.028. [DOI] [PubMed] [Google Scholar]
- Sigurdsson T, Stark KL, Karayiorgou M, Gogos JA, Gordon JA. Impaired hippocampal-prefrontal synchrony in a genetic mouse model of schizophrenia. Nature. 2010;464:763–767. doi: 10.1038/nature08855. [DOI] [PMC free article] [PubMed] [Google Scholar]
- Sirota A, Montgomery S, Fujisawa S, Isomura Y, Zugaro M, Buzsáki G. Entrainment of neocortical neurons and gamma oscillations by the hippocampal theta rhythm. Neuron. 2008;60:683–697. doi: 10.1016/j.neuron.2008.09.014. [DOI] [PMC free article] [PubMed] [Google Scholar]
- Tsai SJ, Hong CJ, Liou YJ, Yu YW, Chen TJ, Hou SJ, Yen FC. Tryptophan hydroxylase 2 gene is associated with major depression and antidepressant treatment response. Prog Neuropsychopharmacol Biol Psychiatry. 2009;33:637–641. doi: 10.1016/j.pnpbp.2009.02.020. [DOI] [PubMed] [Google Scholar]
- Uhlhaas PJ, Singer W. Neural synchrony in brain disorders: relevance for cognitive dysfunctions and pathophysiology. Neuron. 2006;52:155–168. doi: 10.1016/j.neuron.2006.09.020. [DOI] [PubMed] [Google Scholar]
- Uhlhaas PJ, Haenschel C, Nikolić D, Singer W. The role of oscillations and synchrony in cortical networks and their putative relevance for the pathophysiology of schizophrenia. Schizophr Bull. 2008;34:927–943. doi: 10.1093/schbul/sbn062. [DOI] [PMC free article] [PubMed] [Google Scholar]
- Zhang X, Gainetdinov RR, Beaulieu JM, Sotnikova TD, Burch LH, Williams RB, Schwartz DA, Krishnan KR, Caron MG. Loss-of-function mutation in tryptophan hydroxylase-2 identified in unipolar major depression. Neuron. 2005;45:11–16. doi: 10.1016/j.neuron.2004.12.014. [DOI] [PubMed] [Google Scholar]
- Zill P, Baghai TC, Zwanzger P, Schüle C, Eser D, Rupprecht R, Möller HJ, Bondy B, Ackenheil M. SNP and haplotype analysis of a novel tryptophan hydroxylase isoform (TPH2) gene provide evidence for association with major depression. Mol Psychiatry. 2004;9:1030–1036. doi: 10.1038/sj.mp.4001525. [DOI] [PubMed] [Google Scholar]