

Abstract
BACKGROUND
Accurate measurement of free thyroid hormones is important for managing thyroid disorders. Ultrafiltration liquid chromatography tandem mass spectrometry (LC-MS/MS) can reliably measure the concentrations of small molecules, including thyroid hormones. Our study was designed to compare free thyroid hormone measurements performed with immunoassay and LC-MS/MS.
METHODS
We studied the performance of LC-MS/MS in 4 different populations comprising pediatric patients, euthyroid adults, and healthy nonpregnant and pregnant women. The samples obtained from each population numbered 38, 200, 28, and 128, respectively. Free thyroxine, free triiodothyronine, and thyroid-stimulating hormone (TSH) concentrations were documented.
RESULTS
LC-MS/MS measurement of free thyroid hormones provided better correlation with log-transformed serum TSH in each population and also the populations combined. The correlations between free thyroxine measured by LC-MS/MS and log TSH in the pediatric outpatients and healthy adults were −0.90 and −0.77, respectively. The correlations for immunoassay were −0.82 and −0.48. The correlations between free triiodothyronine measured by LC-MS/MS and TSH for both pediatric and healthy adult populations were −0.72 and −0.68, respectively.
CONCLUSIONS
Free thyroid hormone concentrations measured by LC-MS/MS correlate to a greater degree with log TSH values compared to concentrations measured by immunoassay. This correlation was maintained across the patient populations we studied and may reflect the accuracy and specificity of LC-MS/MS. The superior ability of LC-MS/MS to enable documentation of the well-known thyroid hormone–TSH relationship supports the use of this measurement technique in a variety of clinical situations.
The difficulty inherent in accurately measuring hormones that circulate in low concentrations is well known. Examples of hormones present in low concentrations include testosterone in women (1), estradiol in certain clinical situations (2), and free triiodothyronine (3). Liquid chromatography–tandem mass spectrometry (LC-MS/MS)5 is a technique that identifies the analyte in a sample by the retention time and the mass-to-charge ratio of parent and fragmentation ions. Quantification of analytes is achieved by determining the ratio of analyte to isotopically labeled (deuterated or carbon-13) internal standard. LC-MS/MS assays are highly accurate and have low limits of detection, and most importantly they are specific for the analyte in question.
LC-MS/MS assays can measure hormones in relatively low concentrations (2, 4, 5). This technique has been shown to be reliable for measuring concentrations of serum testosterone (1, 5), adrenal and gonadal steroids (6, 7), and 25-hydroxyvitamin D (8, 9). LC-MS/MS is more specific than immunoassays for measurement of thyroid hormones, thus making this procedure particularly attractive for thyroid hormone quantification.
We recently described the use of LC-MS/MS to measure thyroid hormones (10–13), specifically free thyroid hormones after the use of an ultrafiltration step to separate the free hormone. Our studies comparing ultrafiltration LC-MS/MS with use of equilibrium dialysis immunoassay for quantifying free thyroid hormones showed the former to provide essentially identical results to the gold standard approach, Nichols equilibrium dialysis (11, 12). Furthermore, the ultrafiltration procedure can be performed in 30 min, whereas equilibrium dialysis takes 17 h. The precision afforded by the ultrafiltration LC-MS/MS approach is also far superior to that of the older equilibrium dialysis immunoassay method. Ultrafiltration performed at 25 °C has excellent correlation with the Nichols equilibrium dialysis immunoassay method (11, 12), whereas at 37 °C results for free thyroxine are 1.5 times higher. Other studies investigating the use of LC-MS/MS, with the alternative use of equilibrium dialysis for separating free and bound thyroid hormone have shown this to be an accurate technique for quantification of free thyroid hormones (14, 15).
The inverse log-linear relationship between thyroid-stimulating hormone (TSH) and free thyroid hormones has been well documented (3, 16). Both thyroxine and triiodothyronine appear to be important for pituitary feedback (3, 17), although opinions differ as to the relative contribution from each of the 2 hormones (18). Triiodothyronine may be the predominant regulator in conditions of autonomous hyperactivity due to nodular thyroid disease (19). The set point of the pituitary–thyroid axis also seems to be individualized (20, 21) and is additionally affected by factors such as nutritional status (22–24), illness (25), and age (26).
TSH assays are generally accurate and reproducible (3). In contrast, the measurement of free thyroid hormones by direct analog immunoassay may be inaccurate (27–37). Historically the direct analog immunoassay for the measurement of free thyroid hormones has been criticized as suboptimal, in part because it does not separate the hormones by ultrafiltration or dialysis before analysis. Another criticism is that the assay has poor performance under conditions such as extremes of protein binding (36). Additionally, the presence of interfering thyroid antibodies or heterophilic nonspecific antibodies, which may occur during pregnancy, may contribute to the inaccuracies of immunoassay (33). It has been suggested that immunoassay performance may be worse at low or high thyroid hormone concentrations (35–37). LC-MS/MS may perform better in such circumstances (10, 12), and in the case of free thyroxine (FT4), seems to agree better with the gold standard equilibrium dialysis assay (11, 12).
We measured free thyroid hormone concentrations using LC-MS/MS and immunoassay and compared the relationship between the free thyroid hormone concentrations obtained with each assay and the corresponding log-transformed serum TSH concentrations. We hypothesized that LC-MS/MS would provide a more exact representation of the inverse relationship between each of the measured hormones and the log-transformed TSH.
Study Participants, Materials, and Methods
STUDY PARTICIPANTS
The study was approved by the Georgetown University Institutional Review Board and conducted in the General Clinical Research Center (GCRC). Written informed consent was obtained at the initial study visit. There were 4 groups of study participants. Thirty-eight pediatric outpatients <18 years old each donated 1 sample. These patients were receiving routine medical care, and were suspected by their pediatrician to have hypothyroidism or hyperthyroidism. The adult population consisted of 50 euthyroid patients (ages 18–65 years) without any chronic medical condition, except for nodular thyroid disease or thyroid cancer, who were scheduled for total or near total thyroidectomy. After their thyroidectomy, study participants were all prescribed a name brand of levothyroxine. Patients with benign thyroid disease (66%) were managed with the goal of achieving TSH concentrations within reference intervals, whereas patients with a diagnosis of thyroid cancer (34%) received therapy to suppress their TSH concentrations. These patients donated 2 blood samples before their thyroidectomy and 2 further samples after thyroidectomy while receiving levothyroxine therapy. Twenty-eight healthy euthyroid women, mean age 37 years, donated a single blood sample each. Ninety-eight healthy euthyroid pregnant women, mean age 33 years, donated blood samples 1–3 times during their pregnancy. The number of samples obtained from pregnant women was 59 during the first trimester, 35 during the second trimester, and 26 during the third trimester. Pregnant women were all taking prenatal multivitamins and had a singleton gestation. Separate analyses based on the nonpediatric populations have already been reported (11, 38, 39).
All samples from pediatric patients were analyzed for FT4 and free triiodothyronine (FT3) by both immunoassay and LC-MS/MS and TSH. The 200 blood samples from the thyroidectomy cohort were all analyzed for FT4 by immunoassay and TSH. However, only 121 samples were analyzed for FT4 by LC-MS/MS, and 52 samples were analyzed for FT3 by LC-MS/MS. The samples from the 2 groups of women were analyzed for FT4 by both immunoassay and LC-MS/MS and TSH only. When the 4 patient groups were combined the total number of samples available for analysis was 394. The inclusion of pediatric patients with abnormal TSH values and healthy adults with iatrogenic hyperthyroidism or hypothyroidism allowed exploration of the log TSH–free thyroid hormone relationship at the 2 extremes of TSH and thyroid hormone concentrations.
THYROID PROFILES
Phlebotomy was performed by the GCRC nursing staff. Samples of 4 mL were collected in plastic red top tubes containing clot activator (Vacutainer®, Becton Dickinson) and allowed to clot for 20 min. After centrifugation the serum was separated and immediately stored at −80 °C before analysis. Levothyroxine administration was delayed until after phlebotomy to obtain trough concentrations of thyroid hormones (40). In addition, patients taking levothyroxine had received a stable dose of levothyroxine for 6–8 weeks before all thyroid profiles were obtained. Most participants had their thyroid function assessed both by a clinical laboratory and by the GCRC core laboratory, but only the GCRC laboratory results were used in this analysis. A full thyroid profile consisted of serum TSH, FT4, and free FT3 concentrations. However, only the pediatric outpatients and a subset of the healthy adults had their blood samples analyzed for FT3.
Each blood sample was analyzed for FT4 and TSH in the GCRC Bioanalytic Core Laboratory. Some samples with sufficient specimen remaining were also analyzed for FT3. Free thyroid hormones were measured both by LC-MS/MS and by direct analog immunoassay. Details of the LC-MS/MS assays have previously been described (10, 12, 13). Briefly, the procedure is based on an online extraction/cleaning of the injected samples with subsequent introduction into the mass-spectrometer using a built-in Valco switching valve. We injected 400 μL of the treated plasma ultrafiltrate onto a Supelco LC-18-DB (3.3 cm × 3.0 mm, 3.0 μm particle size) chromatographic column equipped with a Supelco Discovery C-18 (3.0 mm) guard column, where it underwent cleaning with 20% (volume/volume) methanol in 5 mmol/L ammonium acetate (pH 4.0) at a flow rate of 0.8 mL/min. After 4 min of cleaning the switching valve was activated, the column was flushed with a water/methanol gradient at a flow rate of 0.6 mL/min, and the samples were introduced into the mass spectrometer. The interassay and intra-assay imprecision, assessed at 3 different concentrations, yielded CVs ≤7.0% for FT4 and ≤9.0% for FT3.
The pediatric reference intervals (for children age 1–18 years) for FT4 and FT3 measured with LC-MS/MS are 11.6–20.6 pmol/L (0.9–1.6 ng/dL) and 1.4–6.2 pmol/L (0.9–4.0 pg/mL), respectively (10). Adult reference intervals are the same. The calibration range used for FT4 was 0.5–5.0 ng/dL, the limit of quantification was 0.05 ng/dL, and the limit of detection was 0.025 ng/dL. The calibration range used for FT3 was 1–25 pg/mL, the limit of quantification was 0.8 pg/mL, and the limit of detection was 0.4 pg/mL. The ultrafiltration LC-MS/MS assay used in this analysis had the following correlations with equilibrium dialysis LC-MS/MS: FT4, ultrafiltration LC-MS/MS = 0.652 equilibrium dialysis LC-MS/MS + 0.212, n = 37, Sy|x = 0.134, r = 0.806; FT3, ultrafiltration LC-MS/MS = 0.839 equilibrium dialysis LC-MS/MS −0.673, n = 33, Sy|x = 0.255, r = 0.788.
The Dade Dimension RxL Clinical Chemistry Analyzer (Siemens) was used for the direct analog FT4 immunoassay. This heterogeneous immunoassay has a limit of quantification of 0.2 ng/dL and imprecision <10% at all concentrations tested, and was calibrated for the range 0.2–6.5 ng/dL The manufacturer’s reference range was 11.6–20.6 pmol/L (0.9–1.6 ng/dL). FT3 was assayed with the DPC Immulite 2000 (Siemens). This analog immunoassay has a limit of quantification of 1.0 pg/mL and imprecision <10% at all concentrations tested, and was calibrated for the range 1–40 pg/mL. The manufacturer’s reference range for this assay was 2.8–6.5 pmol/L (1.8–4.2 pg/mL). TSH was also measured with the Dade Dimension RxL Clinical Chemistry Analyzer. This colorimetric immunoassay has a limit of quantification of 0.01 mIU/L and imprecision of <6.2% at all concentrations tested, and was calibrated for the range 0.01–50 mIU/L. The manufacturer’s reference range for this third-generation TSH assay was 0.34–4.82 mIU/L.
STATISTICAL ANALYSIS
The number of study participants in each population group was not identical. In addition, available sample specimens were not sufficient to measure FT3 either by LC-MS/MS or immunoassay for all participants.
The relationships between the log-transformed TSH values and each associated thyroid hormone concentration was tested by multiple regression analysis. The relationship was examined for FT4 and FT3 measured by 2 different assay methods (immunoassay and LC-MS/MS) in each population and all 4 populations combined. A statistically significant difference between the various TSH–thyroid hormone relationships was tested with regression analysis. Results were considered statistically significant if the P-value was <0.05. The relationship between log TSH for each hormone was compared for each population and tested for statistically significant differences in slopes and correlations by assessing the interaction between each population and the hormone concentrations in multiple regression analysis.
To gain insight into whether the feedback of free thyroid hormones on TSH production was driven by FT4 or FT3, we attempted to normalize the free thyroid hormone–log TSH slopes. The FT3 slope was multiplied by 2.4 for LC-MS/MS and 3.4 for immunoassay to reflect the difference in the concentration ranges of the 2 hormones documented during the study. This correction factor was thus an attempt to normalize the range of FT3 (in pg/mL) to the range of FT4 (in ng/dL).
Results
The patient populations studied are shown in Table 1. In each of the 4 populations there was a closer correlation between log TSH and the free thyroid hormones measured by LC-MS/MS than there was between log TSH and the free thyroid hormones measured by immunoassay. These differences were significant for both FT3 and FT4 in the pediatric outpatients (Fig. 1), the healthy adults (Fig. 2), and the combined population (Fig. 3). There was no significant difference between the correlation coefficients for the 2 FT4 assays in the healthy nonpregnant and pregnant populations (Fig. 4). For the pediatric population the correlations between FT4 measured by LC-MS/MS and immunoassay were −0.90 and −0.82, respectively (P = 0.048). For the same pediatric population the correlations between FT3 measured by LC-MS/MS and immunoassay were −0.72 and −0.57, respectively (P = 0.026). For the healthy adults the correlations for FT4 measured by LC-MS/MS and immunoassay were −0.77 and −0.48, respectively (P < 0.001). Finally, for the entire population combined the correlations between FT4 measured by LC-MS/MS and immunoassay were −0.59 and −0.48, respectively (P = 0.045).
Table 1.
Correlations, slopes, and differences exhibited by log-transformed serum TSH-free thyroid hormone relationships.
| Thyroid hormone and assay | Population studied | No. of data points | Correlation coefficient (r) between thyroid hormone and log TSH | Slope for TSH–thyroid hormone relationshipa | P for within-population difference between FT3 and FT4 correlation | P for within-population difference between LC-MS/MS and immunoassay correlation |
|---|---|---|---|---|---|---|
| FT4 LC-MS/MS | Pediatric outpatients | 38 | −0.90 | −0.87 | 0.023 | 0.048 |
| FT4 LC-MS/MS | Healthy adults | 121 | −0.77 | −1.38 | 0.045 | <0.001 |
| FT4 LC-MS/MS | Populations combined | 307 | −0.59 | −0.74 | NAb | 0.045 |
| FT4 LC-MS/MS | Healthy nonpregnant women | 28 | −0.31 | −0.24 | NA | NS |
| FT4 LC-MS/MS | Healthy pregnant women | 120 | 0.11 | 0.10 | NA | NS |
| FT4 immunoassay | Pediatric outpatients | 38 | −0.82 | −0.73 | 0.012 | 0.048 |
| FT4 immunoassay | Populations combined | 394 | −0.48 | −0.71 | NA | 0.045 |
| FT4 immunoassay | Healthy adults | 200 | −0.48 | −1.07 | NA | <0.001 |
| FT4 immunoassay | Healthy nonpregnant women | 28 | −0.24 | −0.19 | NA | NS |
| FT4 immunoassay | Healthy pregnant women | 128 | −0.06 | −0.07 | NA | NS |
| FT3 LC-MS/MS | Pediatric outpatients | 38 | −0.72 | −0.67 | 0.023 | 0.026 |
| FT3 LC-MS/MS | Healthy adults | 52 | −0.68 | −0.74 | 0.045 | NA |
| FT3 immunoassay | Pediatric outpatients | 38 | −0.57 | −0.71 | 0.012 | 0.026 |
Slope for FT3 normalized to FT4.
NA, not applicable; NS, not significant.
Fig. 1. Free thyroid hormone concentrations measured in pediatric patients.

(A), FT4 measured by LC-MS/MS, correlation between FT4 and log TSH, r = −0.90; (B), FT4 measured by immunoassay (IA), correlation between FT4 and log TSH, r = −0.82; (C), FT3 measured by LC-MS/MS, correlation between FT3 and log TSH, r = −0.72; (D), FT3 measured by immunoassay, correlation between FT3 and log TSH, r = −0.57. To convert FT4 from ng/dl to pmol/l multiply by 12.9. To convert FT3 from pg/ml to pmol/L multiply by 1.55.
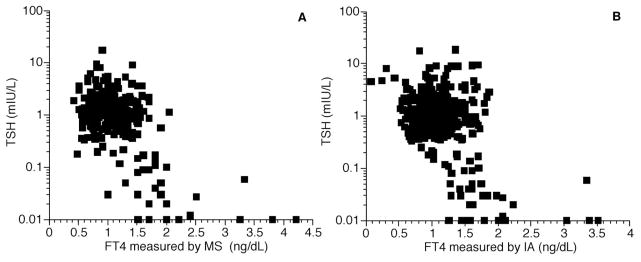
Fig. 2. Free thyroid hormone concentrations measured in healthy adult patients.

(A), FT4 measured by LC-MS/MS, correlation between FT4 and log TSH, r = −0.77; (B), FT4 measured by immunoassay (IA), correlation between FT4 and log TSH, r = −0.48; (C), FT3 measured by LC-MS/MS, correlation between FT3 and log TSH, r = −0.68.
Fig. 3. Free T4 concentrations measured in four patient populations combined.
(A), FT4 measured by LC-MS/MS, correlation between FT4 and log TSH, r = −0.59; (B), FT4 measured by immunoassay (IA), correlation between FT4 and log TSH, r = −0.48.
Fig. 4. Free thyroid hormone concentrations measured in pregnant and nonpregnant women.

(A), FT4 measured by LC-MS/MS in pregnant patients, correlation between FT4 and log TSH, r = 0.11; (B), FT4 measured by immunoassay (IA) in pregnant patients, correlation between FT4 and log TSH, r = −0.06; (C), FT4 measured by LC-MS/MS in nonpregnant women, correlation between FT4 and log TSH, r = −0.31; (D), FT4 measured by immunoassay in nonpregnant women, correlation between FT4 and log TSH; r = −0.24.
In addition, there was a better correlation between TSH and FT4 measured by LC-MS/MS or immunoassay than there was between TSH and FT3 measured by LC-MS/MS or immunoassay. These differences were significant for FT4 vs FT3 in the pediatric outpatients and the healthy adult population. Specifically, for FT4 vs FT3 measured by use of LC-MS/MS in the pediatric population the correlations were −0.90 and −0.72, respectively (P = 0.023). For FT4 vs FT3 measured by immunoassay in the pediatric population the correlations were −0.82 and −0.57, respectively (P = 0.012). Finally, for FT4 vs FT3 measured with LC-MS/MS in the healthy adult population the correlations were −0.77 and −0.68, respectively (P = 0.045).
The relationship between log TSH and FT4 resulted in a steeper slope than the relationship between log TSH and FT3 if the slopes were normalized for the full extent of the FT4 or FT3 range. In other words, the TSH–FT3 relationship was relatively blunted compared with the TSH–FT4 relationship. For LC-MS/MS in the pediatric patients the log TSH–free thyroid hormone slopes were −0.87 and −0.67 for FT4 and FT3, respectively (P = 0.023). For immunoassay in the pediatric population the slopes were −0.73 and −0.71 for FT4 and FT3, respectively (not significant). Lastly, for LC-MS/MS in the healthy adult population the slopes were −1.38 and −0.74 for FT4 and FT3, respectively (P < 0.001).
When the values obtained for FT4 measured by LC-MS/MS were directly compared with the values obtained by immunoassay a correlation coefficient of 0.78 was obtained (Fig. 5). This FT4 correlation compares unfavorably with the correlation coefficient of 0.95 that we previously documented between FT4 measured by ultrafiltration LC-MS/MS and the Nichols Institute equilibrium dialysis followed by immunoassay (12). Because insufficient samples were available for which FT3 was measured by both ultrafiltration LC-MS/MS and immunoassay, we were unable to meaningfully make the same comparison. However, our previously published data show a poor correlation between FT3 measured by ultrafiltration LC-MS/MS and immunoassay (10).
Fig. 5. Comparison between FT4 measured by immunoassay (IA) and tandem mass spectrometry.

Correlation coefficient r = 0.78. (Dashed line represents exact agreement between the 2 assays.)
Discussion
Our results illustrate the classic and well-documented inverse log–linear relationship between TSH and free thyroid hormones (3, 16). This relationship was generally seen for both the free thyroid hormones measured in this particular collection of 394 samples, although the relationship was extremely weak in the group of pregnant patients. The most robust relationships were seen for FT4 measured by LC-MS/MS and immunoassay in the pediatric patients, followed by LC-MS/MS in the healthy adults. However, insufficient specimen samples were available to measure FT3 by LC-MS/MS or immunoassay in several of the groups for comparison purposes. The total number of samples available for analyzing this analyte (n = 90) was substantially less than for FT4 (n = 394 samples). The only group with complete FT3 data available was the small group of pediatric outpatients. In this group FT3 correlated less with TSH than with FT4 measured by either assay. However, FT3 measured by LC-MS/MS had a better correlation with TSH than FT3 measured by immunoassay. It is unclear why there was little relationship between log TSH and FT4 in the group of pregnant patients. However, this pattern persisted for both the assays used. Perhaps additional factors are also modulating the pituitary-thyroid axis during pregnancy, or the assays are less accurate during this physiologic state.
FT3 assays have not been widely used because of the technical difficulties associated with measuring analytes present in low concentrations. In our study an extremely good correlation between FT3 measured by LC-MS/MS and log TSH was documented. We believe that this provides indirect validation of the accuracy of our recently reported FT3 LC-MS/MS assay (10). It is possible that under specific circumstances the relationship between FT3 and TSH is the closest relationship of all.
The close relationship between triiodothyronine and TSH appears to be consistent with a body of evidence, perhaps originating with the study of Fish and colleagues (18), that illustrates the importance of triiodothyronine in regulating serum TSH. Our previous study, in which we used the same healthy adult data discussed here, also showed a close relationship between triiodothyronine and serum TSH (38). Triiodothyronine concentrations appeared to be downregulated when TSH concentrations were lower, suggesting amelioration of the effect of iatrogenic hyperthyroidism by autoregulation of deiodinase activity. After we normalized the log TSH–free thyroid hormone slopes in the LC-MS/MS data for healthy adults, we observed a much less steep slope was seen for the FT3–TSH relationship. This suggests that FT4 plays a more dominant role in feedback inhibition of TSH and that FT3 concentrations were being downregulated to compensate for hyperthyroidism caused by high levothyroxine doses. There was a similar difference between the slopes for FT4 and FT3 LC-MS/MS data for pediatric patients.
When we excluded FT3 because of the less complete dataset, we observed a closer relationship with the log-transformed TSH when the free hormone was measured by LC-MS/MS. Thus, the correlation coefficient is greatest for FT4 measured by LC-MS/MS, followed by FT4 measured by immunoassay. This hierarchy held for all 4 patient populations studied. It is possible that the closer relationship between serum TSH and each of the thyroid hormones measured by LC-MS/MS reflects the greater specificity of LC-MS/MS. It is also possible that LC-MS/MS performs better at low and high thyroid hormone concentrations. The imprecision of the immunoassays employed was <10% for both FT4 and FT3 at all concentrations tested. In contrast the intraassay and interassay CVs were <7% and 9% for FT4 and FT3 measured by LC-MS/MS, respectively.
Our data regarding the use of LC-MS/MS to measure free thyroid hormones more robustly document the known relationship between TSH and thyroid hormones than do measurements obtained with immunoassays. This accurate representation of the functioning of the pituitary thyroid axis lends support to the premise that LC-MS/MS should become the preferred assay for documenting the concentrations of free thyroid hormones.
Acknowledgments
Role of Sponsor: The funding organizations played no role in the design of study, choice of enrolled patients, review and interpretation of data, or preparation or approval of manuscript.
The authors gratefully acknowledge the dedication of the GCRC nursing staff and the generosity of the study participants, without whom this study could not have been completed.
Footnotes
Nonstandard abbreviations: LC-MS/MS, liquid chromatography-tandem mass spectrometry; TSH, thyroid-stimulating hormone; FT4, free thyroxine; GCRC, General Clinical Research Center; FT3, free triiodothyronine.
Author Contributions: All authors confirmed they have contributed to the intellectual content of this paper and have met the following 3 requirements: (a) significant contributions to the conception and design, acquisition of data, or analysis and interpretation of data; (b) drafting or revising the article for intellectual content; and (c) final approval of the published article.
Disclaimer: The contents of this report are solely the responsibility of the authors and do not necessarily represent the official views of the National Center for Research Resources or NIH.
Authors’ Disclosures of Potential Conflicts of Interest: Upon manuscript submission, all authors completed the Disclosures of Potential Conflict of Interest form. Potential conflicts of interest:
Employment or Leadership: S.J. Soldin, NACB, ABCC, and IATDMCT.
Consultant or Advisory Role: S.J. Soldin, National Medical Services and NIH; O.P. Soldin, PregnaTox, Pregnancy Task Force—American Thyroid Association, and Organization of Teratogen Information Specialists (OTIS).
Stock Ownership: None declared.
Honoraria: S.J. Soldin, AACC National Meeting Talk.
Research Funding: J. Jonklaas, National Center for Research Resources grant K23 RR16524; S.J. Soldin, NIH GCRC grant number MO1-RR-023942 and Applied Biosystems/Sciex; O.P. Soldin, grant U10HD047890-S from NIH/NICHD Obstetrics-Fetal Pharmacology Research Unit (OPRU) Network and a grant from the Office of Research on Women’s Health. This project was conducted through the General Clinical Research Center at Georgetown University and supported by Grant M01-RR-023942–01 from the National Center for Research Resources, a component of NIH.
Expert Testimony: None declared.
References
- 1.Rosner W, Auchus RJ, Azziz R, Sluss PM, Raff H. Position statement: utility, limitations, and pitfalls in measuring testosterone: an Endocrine Society position statement. J Clin Endocrinol Metab. 2007;92:405–13. doi: 10.1210/jc.2006-1864. [DOI] [PubMed] [Google Scholar]
- 2.Santen RJ, Demers L, Ohorodnik S, Settlage J, Langecker P, Blanchett D, et al. Superiority of gas chromatography/tandem mass spectrometry assay (GC/MS/MS) for estradiol for monitoring of aromatase inhibitor therapy. Steroids. 2007;72:666–71. doi: 10.1016/j.steroids.2007.05.003. [DOI] [PubMed] [Google Scholar]
- 3.Baloch Z, Carayon P, Conte-Devolx B, Demers LM, Feldt-Rasmussen U, Henry JF, et al. Laboratory medicine practice guidelines: laboratory support for the diagnosis and monitoring of thyroid disease. Thyroid. 2003;13:3–126. doi: 10.1089/105072503321086962. [DOI] [PubMed] [Google Scholar]
- 4.Wang C, Catlin DH, Demers LM, Starcevic B, Swerdloff RS. Measurement of total serum testosterone in adult men: comparison of current laboratory methods versus liquid chromatography-tandem mass spectrometry. J Clin Endocrinol Metab. 2004;89:534–43. doi: 10.1210/jc.2003-031287. [DOI] [PubMed] [Google Scholar]
- 5.Kushnir MM, Rockwood AL, Roberts WL, Pattison EG, Bunker AM, Fitzgerald RL, Meikle AW. Performance characteristics of a novel tandem mass spectrometry assay for serum testosterone. Clin Chem. 2006;52:120–8. doi: 10.1373/clinchem.2005.052167. [DOI] [PubMed] [Google Scholar]
- 6.Albrecht L, Styne D. Laboratory testing of gonadal steroids in children. Pediatr Endocrinol Rev. 2007;5 (Suppl 1):599–607. [PubMed] [Google Scholar]
- 7.Guo T, Taylor RL, Singh RJ, Soldin SJ. Simultaneous determination of 12 steroids by isotope dilution liquid chromatography-photospray ionization tandem mass spectrometry. Clin Chim Acta. 2006;372:76–82. doi: 10.1016/j.cca.2006.03.034. [DOI] [PubMed] [Google Scholar]
- 8.Saenger AK, Laha TJ, Bremner DE, Sadrzadeh SM. Quantification of serum 25-hydroxyvitamin D(2) and D(3) using HPLC-tandem mass spectrometry and examination of reference intervals for diagnosis of vitamin D deficiency. Am J Clin Pathol. 2006;125:914–20. doi: 10.1309/J32U-F7GT-QPWN-25AP. [DOI] [PubMed] [Google Scholar]
- 9.Tsugawa N, Suhara Y, Kamao M, Okano T. Determination of 25-hydroxyvitamin D in human plasma using high-performance liquid chromatography–tandem mass spectrometry. Anal Chem. 2005;77:3001–7. doi: 10.1021/ac048249c. [DOI] [PubMed] [Google Scholar]
- 10.Gu J, Soldin OP, Soldin SJ. Simultaneous quantification of free triiodothyronine and free thyroxine by isotope dilution tandem mass spectrometry. Clin Biochem. 2007;40:1386–91. doi: 10.1016/j.clinbiochem.2007.08.007. [DOI] [PubMed] [Google Scholar]
- 11.Kahric-Janicic N, Soldin SJ, Soldin OP, West T, Gu J, Jonklaas J. Tandem mass spectrometry improves the accuracy of free thyroxine measurements during pregnancy. Thyroid. 2007;17:303–11. doi: 10.1089/thy.2006.0303. [DOI] [PMC free article] [PubMed] [Google Scholar]
- 12.Soldin SJ, Soukhova N, Janicic N, Jonklaas J, Soldin OP. The measurement of free thyroxine by isotope dilution tandem mass spectrometry. Clin Chim Acta. 2005;358:113–8. doi: 10.1016/j.cccn.2005.02.010. [DOI] [PMC free article] [PubMed] [Google Scholar]
- 13.Soukhova N, Soldin OP, Soldin SJ. Isotope dilution tandem mass spectrometric method for T4/T3. Clin Chim Acta. 2004;343:185–90. doi: 10.1016/j.cccn.2004.01.007. [DOI] [PMC free article] [PubMed] [Google Scholar]
- 14.Van Uytfanghe K, Stockl D, Ross HA, Thienpont LM. Use of frozen sera for FT4 standardization: investigation by equilibrium dialysis combined with isotope dilution-mass spectrometry and immunoassay. Clin Chem. 2006;52:1817–21. doi: 10.1373/clinchem.2006.070425. [DOI] [PubMed] [Google Scholar]
- 15.Yue B, Rockwood AL, Sandrock T, La’ulu SL, Kushnir MM, Meikle AW. Free thyroid hormones in serum by direct equilibrium dialysis and online solid-phase extraction–liquid chromatography/tandem mass spectrometry. Clin Chem. 2008;54:642–51. doi: 10.1373/clinchem.2007.098293. [DOI] [PubMed] [Google Scholar]
- 16.Spencer CA, LoPresti JS, Patel A, Guttler RB, Eigen A, Shen D, et al. Applications of a new chemiluminometric thyrotropin assay to subnormal measurement. J Clin Endocrinol Metab. 1990;70:453–60. doi: 10.1210/jcem-70-2-453. [DOI] [PubMed] [Google Scholar]
- 17.Larsen PR. Thyroid-pituitary interaction: feedback regulation of thyrotropin secretion by thyroid hormones. N Engl J Med. 1982;306:23–32. doi: 10.1056/NEJM198201073060107. [DOI] [PubMed] [Google Scholar]
- 18.Fish LH, Schwartz HL, Cavanaugh J, Steffes MW, Bantle JP, Oppenheimer JH. Replacement dose, metabolism, and bioavailability of levothyroxine in the treatment of hypothyroidism: role of triiodothyronine in pituitary feedback in humans. N Engl J Med. 1987;316:764–70. doi: 10.1056/NEJM198703263161302. [DOI] [PubMed] [Google Scholar]
- 19.Bregengard C, Kirkegaard C, Faber J, Poulsen S, Hasselstrom K, Siersbaek-Nielsen K, Friis T. Relationships between serum thyrotropin, serum free thyroxine (T4), and 3,5,33-triiodothyronine (T3) and the daily T4 and T3 production rates in euthyroid patients with multinodular goiter. J Clin Endocrinol Metab. 1987;65:258–61. doi: 10.1210/jcem-65-2-258. [DOI] [PubMed] [Google Scholar]
- 20.Meikle AW, Stringham JD, Woodward MG, Nelson JC. Hereditary and environmental influences on the variation of thyroid hormones in normal male twins. J Clin Endocrinol Metab. 1988;66:588–92. doi: 10.1210/jcem-66-3-588. [DOI] [PubMed] [Google Scholar]
- 21.Meier CA, Maisey MN, Lowry A, Muller J, Smith MA. Interindividual differences in the pituitary-thyroid axis influence the interpretation of thyroid function tests. Clin Endocrinol (Oxf) 1993;39:101–7. doi: 10.1111/j.1365-2265.1993.tb01758.x. [DOI] [PubMed] [Google Scholar]
- 22.Legradi G, Emerson CH, Ahima RS, Flier JS, Lechan RM. Leptin prevents fasting-induced suppression of prothyrotropin-releasing hormone messenger ribonucleic acid in neurons of the hypothalamic paraventricular nucleus. Endocrinology. 1997;138:2569–76. doi: 10.1210/endo.138.6.5209. [DOI] [PubMed] [Google Scholar]
- 23.Boelen A, Wiersinga WM, Fliers E. fasting-induced changes in the hypothalamus-pituitary-thyroid axis. Thyroid. 2008;18:123–9. doi: 10.1089/thy.2007.0253. [DOI] [PubMed] [Google Scholar]
- 24.Burman KD, Smallridge RC, Osburne R, Dimond RC, Whorton NE, Kesler P, Wartofsky L. Nature of suppressed TSH secretion during undernutrition: effect of fasting and refeeding on TSH responses to prolonged TRH infusions. Metabolism. 1980;29:46–52. doi: 10.1016/0026-0495(80)90097-9. [DOI] [PubMed] [Google Scholar]
- 25.Fliers E, Alkemade A, Wiersinga WM, Swaab DF. Hypothalamic thyroid hormone feedback in health and disease. Prog Brain Res. 2006;153:189–207. doi: 10.1016/S0079-6123(06)53011-0. [DOI] [PubMed] [Google Scholar]
- 26.Lewis GF, Alessi CA, Imperial JG, Refetoff S. Low serum free thyroxine index in ambulating elderly is due to a resetting of the threshold of thyrotropin feedback suppression. J Clin Endocrinol Metab. 1991;73:843–9. doi: 10.1210/jcem-73-4-843. [DOI] [PubMed] [Google Scholar]
- 27.Wang R, Nelson JC, Weiss RM, Wilcox RB. Accuracy of free thyroxine measurements across natural ranges of thyroxine binding to serum proteins. Thyroid. 2000;10:31–9. doi: 10.1089/thy.2000.10.31. [DOI] [PubMed] [Google Scholar]
- 28.Martel J, Despres N, Ahnadi CE, Lachance JF, Monticello JE, Fink G, et al. Comparative multi-centre study of a panel of thyroid tests using different automated immunoassay platforms and specimens at high risk of antibody interference. Clin Chem Lab Med. 2000;38:785–93. doi: 10.1515/CCLM.2000.112. [DOI] [PubMed] [Google Scholar]
- 29.d’Herbomez M, Forzy G, Gasser F, Massart C, Beaudonnet A, Sapin R. Clinical evaluation of nine free thyroxine assays: persistent problems in particular populations. Clin Chem Lab Med. 2003;41:942–7. doi: 10.1515/CCLM.2003.143. [DOI] [PubMed] [Google Scholar]
- 30.Steele BW, Wang E, Klee GG, Thienpont LM, Soldin SJ, Sokoll LJ, et al. Analytic bias of thyroid function tests: analysis of a College of American Pathologists fresh frozen serum pool by 3900 clinical laboratories. Arch Pathol Lab Med. 2005;129:310–7. doi: 10.5858/2005-129-310-ABOTFT. [DOI] [PubMed] [Google Scholar]
- 31.Sapin R, d’Herbomez M. Free thyroxine measured by equilibrium dialysis and nine immunoassays in sera with various serum thyroxine-binding capacities. Clin Chem. 2003;49:1531–5. doi: 10.1373/49.9.1531. [DOI] [PubMed] [Google Scholar]
- 32.Nelson JC, Wang R, Asher DT, Wilcox RB. The nature of analogue-based free thyroxine estimates. Thyroid. 2004;14:1030–6. doi: 10.1089/thy.2004.14.1030. [DOI] [PubMed] [Google Scholar]
- 33.Klee GG. Human anti-mouse antibodies. Arch Pathol Lab Med. 2000;124:921–3. doi: 10.5858/2000-124-0921-HAMA. [DOI] [PubMed] [Google Scholar]
- 34.Kricka LJ. Interferences in immunoassay: still a threat. Clin Chem. 2000;46:1037–8. [PubMed] [Google Scholar]
- 35.Ekins R. A shadow over immunoassay. Nature. 1989;340:256–8. doi: 10.1038/340256a0. [DOI] [PubMed] [Google Scholar]
- 36.Ekins R. Effect of thyroid hormone-binding proteins and fatty acids on modified analog assays of FT4 and FT3 in serum. Clin Chem. 1989;35:708–10. [PubMed] [Google Scholar]
- 37.Ekins R. Validity of analog free thyroxin immunoassays. Clin Chem. 1987;33:2137–44. [PubMed] [Google Scholar]
- 38.Jonklaas J, Davidson B, Bhagat S, Soldin SJ. Triiodothyronine levels in athyreotic individuals during levothyroxine therapy. JAMA. 2008;299:769–77. doi: 10.1001/jama.299.7.769. [DOI] [PubMed] [Google Scholar]
- 39.Jonklaas J, Nsouli-Maktabi H, Soldin SJ. Endogenous thyrotropin and triiodothyronine concentrations in individuals with thyroid cancer. Thyroid. 2008;18:943–52. doi: 10.1089/thy.2008.0061. [DOI] [PMC free article] [PubMed] [Google Scholar]
- 40.Ain KB, Pucino F, Shiver TM, Banks SM. Thyroid hormone levels affected by time of blood sampling in thyroxine-treated patients. Thyroid. 1993;3:81–5. doi: 10.1089/thy.1993.3.81. [DOI] [PubMed] [Google Scholar]