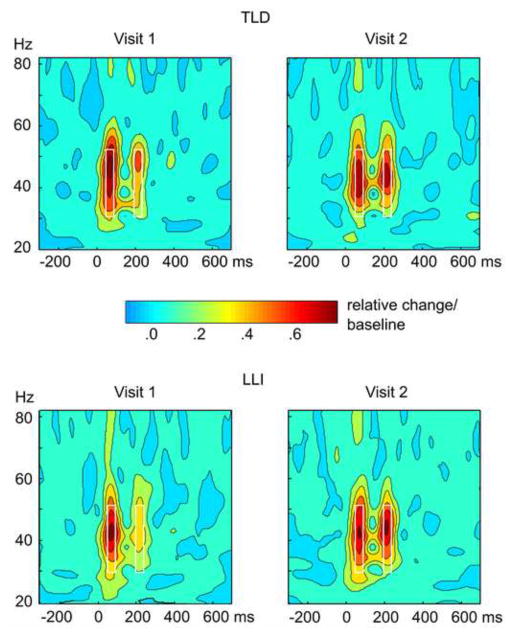
Figure 1.
Grand mean baseline-corrected time by frequency plots at visit 1 (left) and visit 2 (right) for the two groups in the study, 12 children with typical language development (TLD; top), and 21 language-learning impaired children (LLI; bottom). Values are averaged across conditions and hemispheres and were obtained by wavelet analyses of the single-trial source waveforms at two regional sources, one in each temporal lobe. The plots show time running from left to right, frequency from bottom to top. The amount of spectral amplitude change at a given time and frequency is coded by color, with increase over the baseline level coded in increasingly warm (red) colors. A pre-stimulus segment was used as the baseline, and amplitude values indicate relative change after dividing the baseline mean (change/baseline). Note the two oscillatory responses to the tone doublet, each with an onset latency of approximately 45 ms, with respect to the onset of each tone in the pair. The white rectangles in the plots highlight the time-frequency window used to extract the mean of early oscillations (45–75 ms post-tone onset) in the lower gamma-band range (29–52 Hz) for statistical analyses.

