
Figure 7.
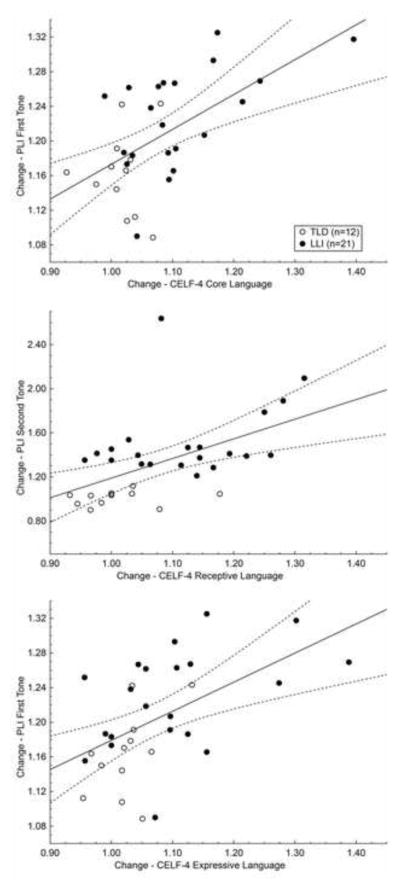
PLI change quotients for the first and second tones are plotted against the change quotients for the standard language scores obtained in the three CELF-4 measures. Change quotients reflect the ratio of visit 2 to visit 1 in each dimension. Although the single regression models are based on the whole study sample (n = 33), values in each graph are depicted according to their group membership: open circles represent 12 children with typical language development (TLD), and filled circles 21 peers with language-learning impairment (LLI). Both improvements in the Core Language composite and the Expressive Language index were predicted by PLI increases for the first sound of the tone pair (top and bottom graph, respectively). In contrast, ameliorations in Receptive Language index were determined by PLI gains for the second tone (center graph).