Abstract
Background:
The article provides the analysis of death rates in road traffic accidents in Kazakhstan from 2004 to 2010 and explores the use of sanitary aviation.
Methods:
Data of fatalities caused by road traffic accidents were collected and analysed. Descriptive and analytical methods of epidemiology and biomedical statistics were applied.
Results:
Totaly 27,003 people died as a result of road traffic accidents in this period. The death rate for the total population due to road traffic accidents was 25.0±2.10/0000. The death rate for men was (38.3±3.20/0000), which was higher (P<0.05) than that for women (12.6±1.10/0000). High death rates in the entire male population were identified among men of 30–39 years old, whereas the highest rates for women were attributed to the groups of 50–59 years old and 70–79 years old. In time dynamics, death rates tended to decrease: the total population (Tdec=−2.4%), men (Tdec=−2.3%) and women (Tdec=−1.4%). When researching territorial relevance, the rates were established as low (to 18.30/0000), average (between 18.3 and 24.00/0000) and high (from 24.00/0000 and above). Thus, the regions with high rates included Akmola region (24.30/0000), Mangistau region (25.90/0000), Zhambyl region (27.30/0000), Almaty region (29.30/0000) and South Kazakhstan region (32.40/0000).
Conclusion:
The identified epidemiological characteristics of the population deaths rates from road traffic accidents should be used in integrated and targeted interventions to enhance prevention of injuries in accidents.
Keywords: Death rate, Traffic, Accident, Kazakhstan
Introduction
According to the global statistics, each year 300,000 people die as a result of road traffic accidents (RTA) and over 8 million people receive injuries. An annual growth rate of fatal injuries is 5% (1). According to a report by WHO, India is a leading county in the number of deaths in RTA in the world ranking. According to data for 2007, 114,590 people died in India as a result of RTA. The second place belongs to China with 89,455 deaths. According to statistics (2), 5 –12% of all deaths are deaths from RTA. 28–47% of the total number of deaths is deaths at an RTA site or during transportation (3). RTA injuries are becoming epidemic. Their negative consequences by far exceed outcomes of both communicable and some non-communicable diseases (4, 5). To date, traffic accidents have become one of the main causes of injury, disability and mortality worldwide (6–8).
Projections show that the global annual number of deaths on roads will increase in the next 20 years by 65% unless effective road safety measures are undertaken to prevent traffic accidents and reduce severity of their outcomes (7).
One mechanism for reducing deaths from RTA is compliance with the rules of a so-called “golden hour” and a so-called “diamond half an hour”, when required medical care is provided to victims in the first hour after an injury is received. This allows the highest chance of survival and significant reduction of risks of complications.
A review of research in Europe (9) showed that about 50% of deaths from RTA occur within a few minutes at a site of an accident or en-route to hospital. Fifteen% of victims die in hospital within four hours after an accident and 35% die after four hours. A comparative study of deaths from RTA in several countries (10) showed that the majority of deaths in low and middle-income countries occur before admission to hospital. World leading countries’ experience shows that the use of air medical / ambulance service (AMS) in cases of RTA reduces mortality by 30–40%.
In Kazakhstan, one, among already existing action plans and mechanisms to reduce fatalities, is revival of the AMS. The use of small aircrafts (helicopters) can reduce time to hospital admission and increase efficiency of actions provided after an RTA (11). Medical assistance through the AMS is defined as providing emergency medical care by means of an air ambulance in cases of lack of medical equipment or professional qualified staff at a medical organisation where a patient is located (12). The purpose of the AMS is to transfer a patient to an appropriate medical facility in life-threatening events due to sudden illness, accident, complications during pregnancy and childbirth, man-made accidents and natural disasters, and RTA (11, 13).
This paper analyses death rates in Kazakhstan associated with RTA in recent years, outlines trends of rates analysed by gender and age, and provides area spatial assessment of RTA death rates in regions of the country. It offers justification for introduction of the AMS to reduce the death rate caused by RTA and the algorithm for the use of the AMS.
Methods
The study is based on the data on deaths from RTA in 2004–2010 obtained from the Agency for Statistics of the Republic of Kazakhstan (14). Data on the population of Kazakhstan has been obtained from the Agency for Statistics of the Republic of Kazakhstan (15–18). The study design is a retrospective analysis of mortality with the use of descriptive and analytical methods to epidemiology.
By the use of conventional methods of biomedical statistics (19, 20) extensive, crude, age-specific and age-adjusted death rates from RTA were calculated. The average value (M) and the mean error (m) were determined. The 95% confidence interval (95% CI) was calculated by the formula:
The dynamics of fatalities during seven years was studied. The least-squares trends were calculated:
where: y - adjusted value; x - conditioned series of numbers, symmetrically located with respect to zero; a - conditioned medium; b - adjusted factor.
To calculate the average annual growth rate and / or increase in the dynamic range we used a geometric mean, equal to an n-root of the product of annual growth rates:
where T – annual growth rates and / or growth, n - number of rates.
In developing area cartograms, we applied a method of Professor S.I. Igissinov proposed by him in 1974 (21). It is based on the definition of standard deviation (σ) from the mean (x). The scale steps cartograms were determined as follows: 1) (x-1.5σ) + σ; 2) (x-1.5σ) +2σ; 3) (x-1.5σ) +3σ, etc. The grouping of rates were produced by the formula x±0.5σ, corresponding to an average level (x-0.5σ, and x +0.5σ).
Along with the above methods, information analysis was employed to determine major trends in medical emergencies based on the study of international experience. A content analysis method was used to examine the regulatory framework for the use of ambulances in the Republic of Kazakhstan. IT Microsoft Office 2007 software (Excel, Word, Access) and BIOSTAT were used to process the data.
Results
Totally, 27,003 deaths from RTA were registered in Kazakhstan in 2004–2010, from which 19,923 (73.8%) of fatalities were males and 7,080 (26.2%) were women. The distribution by gender and age is represented in Table 1. As seen from Table 1, a high proportion of deaths (both genders) were established in the group of 20–29 year olds (25.5%).
Table 1:
Absolute number of deaths in RTA in Kazakhstan by age and gender in 2004–2010
| Age groups, years | Both genders | Male | Female | Proportion M÷F | |||
|---|---|---|---|---|---|---|---|
|
| |||||||
| Abs. | % | Abs. | % | Abs. | % | ||
| до 20 | 3,659 | 13.6 | 2,361 | 11.9 | 1,298 | 18.3 | 1.8÷1 |
| 20–29 | 6,881 | 25.5 | 5,466 | 27.4 | 1,415 | 20.0 | 3.9÷1 |
| 30–39 | 5,852 | 21.7 | 4,715 | 23.7 | 1,137 | 16.1 | 4.1÷1 |
| 40–49 | 4,954 | 18.3 | 3,788 | 19.0 | 1,166 | 16.5 | 3.2÷1 |
| 50–59 | 3,027 | 11.2 | 2,091 | 10.5 | 936 | 13.2 | 2.2÷1 |
| 60–69 | 1,440 | 5.3 | 882 | 4.4 | 558 | 7.9 | 1.6÷1 |
| 70–79 | 822 | 3.0 | 417 | 2.1 | 405 | 5.7 | 1.0÷1 |
| 80+ | 203 | 0.8 | 74 | 0.4 | 129 | 1.8 | 1÷1.7 |
| unidentified | 165 | 0.6 | 129 | 0.6 | 36 | 0.5 | 3.6÷1 |
| Total | 27,003 | 100.0 | 19,923 | 100.0 | 7,080 | 100.0 | 2.8÷1 |
A similar pattern was observed in both men (27.4%) and women (20.0%). In general, the ratio of men to women was 2.8÷1. The largest difference between men and women was established among 30–39 year olds. It was 4.1÷1. In almost all age groups, this ratio was more in favour of men, except the group of 80 year olds and older (1÷1.7).
The average age (both genders) was 35.9 ± 0.3 years (95% CI = 35.4–36.4). In men, the age was 35.2 ± 0.3 years (95% CI = 34.7–35.7) and was significantly (P<0.05) lower than that of women which was 38.0 ± 0.4 years (95% CI = 37.3–38.8). In dynamics, age adjusted rates of the average age tended to increase. An average annual growth rate in both genders together (T =+0.4%) and males (T =+0.5%) were more pronounced more than in female population (T =+0.03%).
The average crude rate was 25.0±2.10/0000 (95% CI = 20.8–29.10/0000). This rate in men was 38.3±3.20/0000 (95% CI = 31.9–44.60/0000) and was three times as high in women − 12.6±1.10/0000 (95% CI = 10.4–14.80/0000). The established difference was statistically significant (P<0.05).
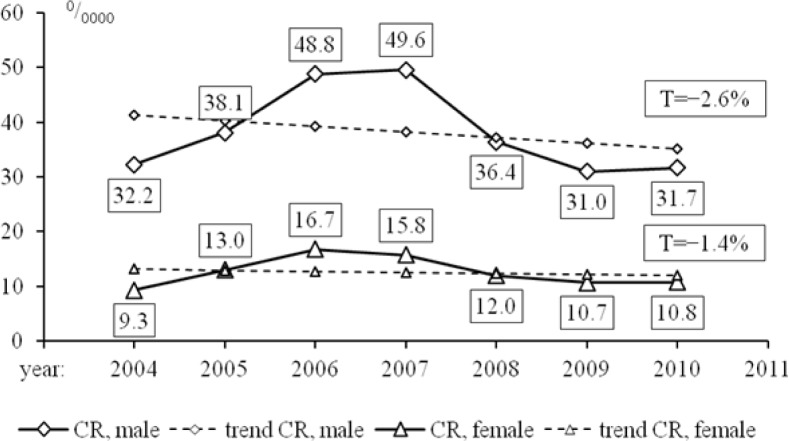
The dynamics of crude rates tended to increase from 20.30/0000(2004) to 20.90/0000 in 2010. Adjusted rates show a reverse trend with an average annual decrease (T= −2.3%) (Fig. 1).
Fig.1:
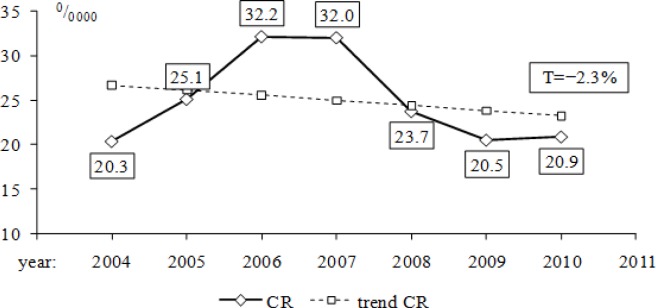
Dynamics of death rates of the population in Kazakhstan RTA in 2004–2010
Crude rates in males decreased from 32.20/0000(2004) to 31,70/0000 in 2010. The trend of adjusted rates also decreased (T = −2.6%).
Adjusted rates in the dynamics of the female population decreased. The average annual rate of decline was T = −1.4% (Fig. 2).
Fig. 2:
Dynamics of male and female death rates in Kazakhstan RTA in 2004–2010
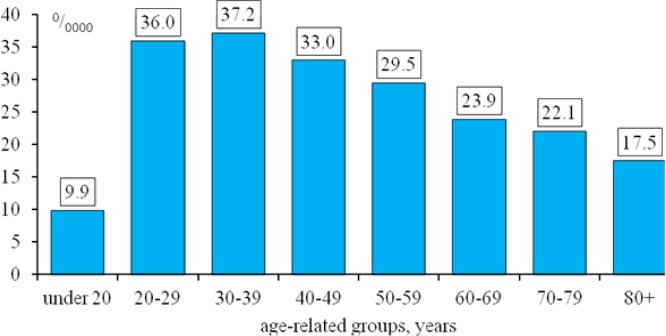
Age specific death rates were the highest among 20–29 year olds (36.0±3.70/0000), 30–39 year olds (37.2±3.20/0000) and 40–49 year olds (33.0±2.80/0000) (Fig. 3).
Fig. 3:
The average annual age-related mortality rates of the total population of Kazakhstan RTA in 2004–2010
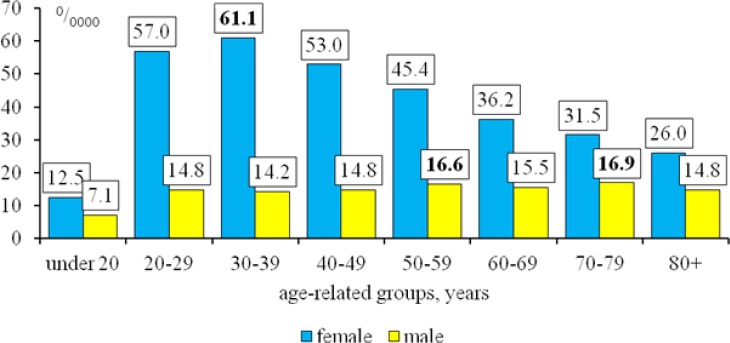
In males, a similar pattern can be observed. High values in the age groups of 20–29, 30–39 and 40–49. Death rates were respectively 57.0±5.6, 61.1±5.9 and 53.0±4.30/0000. Age specific death rates among female population were the highest in 50–59 year olds (16.6±0.9) and 70–79 year olds (16.9±0.6) (Fig. 4).
Fig. 4:
Average annual age specific death rates of male and female population of Kazakhstan RTA in 2004–2010
The analysis of the 95% CI of age specific death rates of male and female population showed a significant difference (P<0.05) because they do not overlap (Table 2).
Table 2:
95% CI of age specific death rates of male and female population of Kazakhstan RTA in 2004–2010
| Age groups, years | 95% CI of mortality,0/0000 | |||
|---|---|---|---|---|
|
| ||||
| Male | Female | |||
|
| ||||
| min | max | min | max | |
| under 20 | 10.3 | 14.6 | 5.9 | 8.4 |
| 20–29 | 46.1 | 67.8 | 11.4 | 18.3 |
| 30–39 | 49.6 | 72.7 | 10.9 | 17.5 |
| 40–49 | 44.6 | 61.4 | 11.9 | 17.7 |
| 50–59 | 39.4 | 51.3 | 14.8 | 18.3 |
| 60–69 | 31.4 | 41.0 | 13.8 | 17.2 |
| 70–79 | 27.3 | 35.8 | 15.6 | 18.1 |
| 80+ | 19.0 | 32.9 | 11.2 | 18.3 |
In dynamics of age adjusted death rates for the total population a decrease in almost all age groups is observed, except for the groups of 60–69 years old (Tgr=+0.1%) and 70–79 years old (Tgr=+0.4%). At the same time these trends were most pronounced among the group of 30–39 years old (Tdec = −3.3%), 20–29 (Tdec = −3.7%) and 80 years old and older (Tdec= −6.4%) (Table 3).
Table 3:
Age adjusted mortality rates of the population of Kazakhstan RTA 2004–2010
| Age groups, years | 2004 | 2005 | 2006 | 2007 | 2008 | 2009 | 2010 | T,% |
|---|---|---|---|---|---|---|---|---|
| Both genders | ||||||||
| under 20 | 10.6 | 10.3 | 10.1 | 9.9 | 9.6 | 9.4 | 9.1 | −2.4 |
| 20–29 | 40.1 | 38.7 | 37.4 | 36.0 | 34.6 | 33.3 | 31.9 | −3.7 |
| 30–39 | 40.9 | 39.7 | 38.5 | 37.2 | 36.0 | 34.8 | 33.6 | −3.3 |
| 40–49 | 34.7 | 34.2 | 33.6 | 33.0 | 32.5 | 31.9 | 31.3 | −1.7 |
| 50–59 | 31.1 | 30.5 | 30.0 | 29.5 | 29.0 | 28.5 | 28.0 | −1.7 |
| 60–69 | 23.8 | 23.8 | 23.9 | 23.9 | 23.9 | 24.0 | 24.0 | +0.1 |
| 70–79 | 21.8 | 21.9 | 22.0 | 22.1 | 22.2 | 22.2 | 22.3 | +0.4 |
| 80+ | 20.9 | 19.8 | 18.6 | 17.5 | 16.4 | 15.2 | 14.1 | −6.4 |
| Male | ||||||||
| under 20 | 13.6 | 13.2 | 12.8 | 12.5 | 12.1 | 11.7 | 11.3 | −3.0 |
| 20–29 | 64.0 | 61.6 | 59.3 | 57.0 | 54.6 | 52.3 | 50.0 | −4.0 |
| 30–39 | 67.9 | 65.6 | 63.4 | 61.1 | 58.9 | 56.7 | 54.4 | −3.6 |
| 40–49 | 56.0 | 55.0 | 54.0 | 53.0 | 52.0 | 51.0 | 50.0 | −1.9 |
| 50–59 | 47.7 | 46.9 | 46.1 | 45.4 | 44.6 | 43.8 | 43.0 | −1.7 |
| 60–69 | 35.3 | 35.6 | 35.9 | 36.2 | 36.5 | 36.8 | 37.2 | +0.9 |
| 70–79 | 32.0 | 31.9 | 31.7 | 31.5 | 31.4 | 31.2 | 31.0 | −0.5 |
| 80+ | 32.4 | 30.3 | 28.1 | 26.0 | 23.8 | 21.7 | 19.5 | −8.1 |
| Female | ||||||||
| under 20 | 7.4 | 7.3 | 7.2 | 7.1 | 7.0 | 7.0 | 6.9 | −1.3 |
| 20–29 | 15.8 | 15.5 | 15.2 | 14.8 | 14.5 | 14.2 | 13.8 | −2.2 |
| 30–39 | 14.9 | 14.7 | 14.4 | 14.2 | 13.9 | 13.7 | 13.5 | −1.7 |
| 40–49 | 15.5 | 15.3 | 15.1 | 14.8 | 14.6 | 14.4 | 14.2 | −1.5 |
| 50–59 | 17.5 | 17.2 | 16.9 | 16.6 | 16.3 | 16.0 | 15.7 | −1.9 |
| 60–69 | 16.1 | 15.9 | 15.7 | 15.5 | 15.4 | 15.2 | 15.0 | −1.2 |
| 70–79 | 16.4 | 16.6 | 16.7 | 16.9 | 17.0 | 17.2 | 17.3 | +0.8 |
| 80+ | 17.4 | 16.5 | 15.6 | 14.8 | 13.9 | 13.0 | 12.1 | −5.9 |
In dynamics of age adjusted death rates for male population, a tendency to grow is observed only among the group of 60–69 year olds. The average annual growth rate amounts to Tgr = + 0.9%. In other age groups, trends in age adjusted death rates decline. An average annual decline ranges from Tdec = −1.7% (50–59 year old) to Tdec = −8.1% (80 tear old) (Table 3).
In women, age adjusted trends in death rates demonstrate growth in the age group of 70–79 Tgr = + 0.8%. In other age groups, trends decline from Tdec = −1.2% among 60–69 year olds to l Tdec = −5.9% among 80 year olds and older (Table 3).
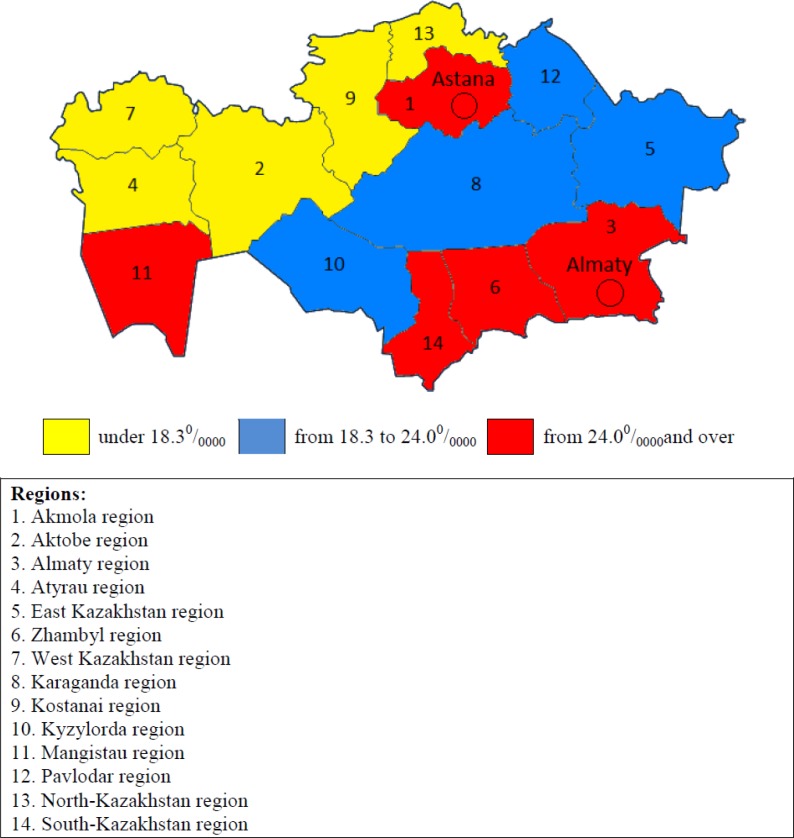
Another type of assessment of fatalities from RTA is the use of area cartograms. The rates were identified as low (to 18.30/0000, average (from 18.3 to 24.00/0000) and high (from 24.00/0000 and above). Based on this scale, an area cartogram by regions of the country was compiled. The following groups of regions were identified (Fig. 5).
Fig. 5:
Area cartogram of mortality in Kazakhstan RTA in 2004–2010
Discussion
Regions with low rates (to 18.30/0000) were Atyrau region (12.80/0000), Kostanai region (13.40/0000), Aktobe region (16.40/0000), North-Kazakhstan region (16.90/0000) and West-Kazakhstan region (17.60/0000) as well as Almaty city (16.00/0000) and Astana city (17.90/0000).
Regions with average rates (from 18.3 to 24.00/0000) were East-Kazakhstan region (20.30/0000), Kyzylorda region (21.60/0000), Pavlodar region (22.60/0000) and Karaganda (23.50/0000).
Region with high rates (from 2.50/0000 and above) were Akmola region (24.30/0000), Mangistau region (25.90/0000), Zhambyl region (27.30/0000), Almaty region (29.30/0000) and South-Kazakhstan (32.40/0000). The identified regional differences in mortality from RTA in Kazakhstan are explained to certain extent by administrative and territorial characteristics of the regions (socio-demographic characteristics, quality of roads and other factors related to roads, etc.).
At the same time other exogenous and endogenous causes should not be excluded. The analysis showed that the ratio of deaths between men and women was higher for men in almost all age groups. The highest difference was established among 30–39 year olds (4.1÷1). The exception is the age group of 80 year olds and older, where more women died than men (1÷1.7). It was established that man died from RTA at an earlier age (35.2 years old) than women (38.0 years old).
The analysis of mortality from RTA in the country shows that death rates in men were significantly higher in all age groups compared with those in women. The highest peak among men is observed in the age group of 30–39 years old. While the death rate among women was the highest among 50–59 years old and 70–79 year olds.
In dynamics, the death rates tended to decrease. This is typical for the total population and both for male and female population. Trends in death rates declined in almost all age groups. Average annual decline for males is more pronounced in its variability and scope. Trends in adjusted age rates grew in men of 60–69 years old and in women of 70–79 years old. This is reflected in the dynamics of rates for the total population, where growth is observed in the group of 70–79 year olds.
For the purposes of spatial assessment of mortality from RTA, rates were indicated as follows: a low rate (to18.30/0000), an average rate (from 18.3 to 24.00/0000), and high rate (from 24.00/0000 and above). The area cartogram shows that high rates are observed in Akmola region (24.30/0000), Mangistau (25.90/0000), Zhambyl region (27.30/0000), Almaty region (29.30/0000) and South Kazakhstan (32.40/0000). The identified epidemiological characteristics of the population death rate from RTA should be used for integrated and targeted interventions to enhance prevention of injuries from RTA, as well as organisational and methodological approaches to monitoring and evaluation of mortality from RTA. To reduce risks in road traffic systems of the world there must be a willingness of governments, industrialists, nongovernment organisations and international organisations to work in this direction and make decisions based on available information (7). Action Plans for road safety should be aimed at protecting the most vulnerable road users. In Kazakhstan, responsibility for road safety is shared between various state departments. An important action point was adoption of the law on strengthening administrative responsibility for non-use of seat belts in vehicles, driving under the influence of alcohol and use of a telephone by a driver when driving (22).
As requested by the Head of State in his Address to the Nation of Kazakhstan “Build the future together!” on 28 January 2011, six health and rescue points were established on accident-prone sections of roads of national importance to allow timely emergency medical care and reduce numbers of those killed in RTA.
On April 15, 2011 the National Air Ambulance Focal Point was established on the basis of JSC “National Scientific Center of Emergency Medical Care”. One of its main objectives is to provide emergency and urgent medical care in traffic accidents on highways. The Ministries of Interior Affairs, Health, Emergency Situations and Transport and Communications adopted a joint order named “On interaction in cases of road accidents – responsibility of medical and rescue points” (officially known as the order of Ministry of Interior Affairs #308 dated 27 June 2011).
As directed by the Ministry of Interior Affairs, 15 helicopter pads were established in Almaty region. Their length is 2,519 kilometers. The coordinator of flights explained that a helicopter could land in any open area when required to transport an injured in an accident. In coordination with the Ministry of Health, Almaty region hosted three teams of health and rescue ambulance in central district hospitals.
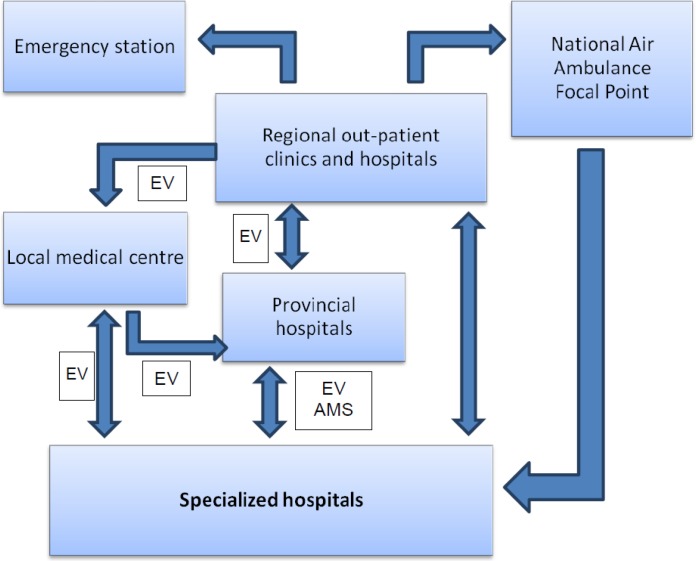
Today two common modes of medical transportation (Fig. 6) are used: ground transportation (special vehicles) and air (specialised aircrafts AN-2 and helicopters MI-8).
Fig. 6:
The scheme of medical evacuation
According to the scheme of medical evacuation (transportation), health organisations can request air ambulance service through the duty dispatch unit of the National Air Ambulance Focal Point of the Ministry of Health (23).
The Dispatching Service Center of the Focal Point regulates and classifies calls based on health conditions of patients and severity of cases. If a case requires urgent action, air ambulance medical transportation is provided to transport a patient from the place where a call was made on condition that there are aircraft landing facilities. If there are no conditions, patients are transferred by ground transport. Also, there are cases when specialised medical teams can be transported by air to the place of a call.
Effective arrangement of medical care at all stages is a priority factor in reducing effects of injuries. According to health workers, every twentieth of the one hundred deceased could be saved. Only 20% of deaths before arrival to hospital are associated with injuries that are not compatible with life. 80% of deaths are due to imperfection of arrangements and technology in aftermath of RTA.
The importance of timely medical care is determined by the fact that 50% of deaths in RTA occur within a few minutes after an accident. During the first hour after an accident 61.1% of victims die. In low and middle income countries, most victims die before admission to hospital. Among those delivered to hospital, 75.8% die later within the first day. Every twentieth person from one hundred deceased can be saved if assistance is provided promptly and correctly at a site. Lack of medical care within one hour after injury increases the number of deaths among seriously injured by 30%. Lack of medical care within three hours increases the number to 60% and within six hours to 90%. This means that numbers of deaths double each three hours.
The data analysis shows that the use of small aircrafts (helicopters) in providing adequate medical care to victims will significantly reduce mortality from RTA by 20–30%.
Conclusion
The identified epidemiological characteristics of the population deaths rates from road traffic accidents should be used in integrated and targeted interventions to enhance prevention of injuries in accidents.
Acknowledgments
We are grateful to all of those who were involved in this study and all those who carried it out. We would like to thank all our reviewers for comments on an earlier version of this paper. The authors declare that there is no conflict of interest.
Abbreviations
- RTA
Road Traffic Accident
- CR
Crude Rate
- 95% CI
95% Confidence Interval
- EV
Evacuation by Vehicle
- AMS
Air Medical Service
References
- 1.Granberg A. Production and use of gross regional product inter-comparison. Russian Econ Journal. 2002;10:42–64. [Google Scholar]
- 2.Ivochkin AM. Specialised resuscitation and a rescue team of a new organisational form of assistance to the affected in accidents. Emergency Medicine. 2002;2:22–23. [Google Scholar]
- 3.Gafarov KZ. Basic principles of child injury prevention. Karpol: Kazan; 1998. [Google Scholar]
- 4.Norman LG. Accidents on the Road Transport. Epidemiology, control and prevention measures. WHO; 1962. [Google Scholar]
- 5.Yakovenko LM. Road traffic accident (conceptual model, classification, epidemiology, prognosis of unrecovered losses and hospitalisation). Monograph, Dr Med. Moscow: 2002. [Google Scholar]
- 6.Zhuravlev SM, Teodoridis KA. Motor vehicle accidents. Clinical and statistical issues and prevention. Annals of Traumatology and Orthopedics. 1996;4:14–20. [Google Scholar]
- 7.Peden M, Scurfield R, Sleet D, Mohan D, Hyder AA, Jarawan E, Mathers C. World report on road traffic injury prevention. WHO; 2004. [Google Scholar]
- 8.http://www.worldlifeexpectancy.com/cause-of-death/road-traffic-accidents/by-country/
- 9.Reducing the severity of road injuries through post impact care. 1999 doi: 10.1097/00063110-199909000-00020. Brussels European Transport Safety Council, Post Impact Care Working Party. [DOI] [PubMed] [Google Scholar]
- 10.Mock CN, Jurkovich GJ. Trauma mortality patterns in three nations at different economic levels: implications for global trauma system development. Journal of Trauma. 1998;44:804–814. doi: 10.1097/00005373-199805000-00011. [DOI] [PubMed] [Google Scholar]
- 11.Teichman PG, Donchin Y, Kot RJ. International Aeromedical Evacuation. N Eng J Med. 2007;356:262–70. doi: 10.1056/NEJMra063651. [DOI] [PubMed] [Google Scholar]
- 12.Davis DP, Peay J, Serrano JA, Buono C, Vilke GM, Sise MJ, Kennedy F, Eastman AB, Velky T, Hoyt DB. The impact of aeromedical response to patients with moderate to severe traumatic brain injury. Ann Emerg Med. 2005;46:115–22. doi: 10.1016/j.annemergmed.2005.01.024. [DOI] [PubMed] [Google Scholar]
- 13.Republic of Kazakhstan, Ministry of Health. Order of the Republic of Kazakhstan numbered 793 “On approval of the rules of provision of first aid and medical assistance in the form of air ambulance”. 2009.
- 14.Republic of Kazakhstan Agency for Statistics. Distribution of deaths by gender, age and cause of death in 2004–2010 (Table C51)
- 15.Demographic Yearbook of Kazakhstan regions. Statistics Yearbook (2006). Almaty [Google Scholar]
- 16.Demographic Yearbook of Kazakhstan regions. Statistics Yearbook (2007). Astana
- 17.Demographic Yearbook of Kazakhstan. Statistics Yearbook (2009). Astana [Google Scholar]
- 18.Kazakhstan in 2010. Statistical Yearbook (in Kazakh and Russian) (2001) Astana
- 19.Merkov AM, Polyakov LE. Sanitary statistics. Medicine. Leningrad; 1974. [Google Scholar]
- 20.Stenton Glance (1999). Biomedical statistics. Moscow
- 21.Igissinov SI. Method of preparation and use of cartograms in oncology practice. Healthcare of the Kazakhstan. 1974;2:69–71. [Google Scholar]
- 22.Republic of Kazakhstan: Law “On introducing amendments and additions to some legislative acts of the Republic Kazakhstan on ensuring safety of road traffic (#55-IV) (2008)
- 23.Ministry of Interior Affairs, Ministry of Health, Ministry of Emergency Situations and Ministry of Transportation and Communications of the Republic of Kazakhstan: Joint Order numbered 308, 421, 274 and 392 respectively “On interaction in cases of road accidents - responsibility of medical and rescue points” (2011)


