

Abstract
Background: Gut secreted incretin hormones and gastric bypass surgery currently provides some of the most successful treatments for diabetes and obesity respectively. However, despite the evident importance of the gut endocrine system no information exists on the total number and distribution of different types of endocrine cells in the gut. Here we have used the established preclinical Zucker Diabetic Fatty (ZDF) rat model which displays elevated levels of GLP-1 to assess L-cell distribution and L-cell dynamics in the full rostro-caudal extension of the rat intestinal tract. Methods: Using mathematically unbiased stereology we provide total and regional estimates of gut volume, gut surface area and the total number of L-cells throughout the intestinal tract in obese ZDF rats and lean controls. Results: The total number of L-cells in the lean and obese ZDF gut is estimated to 4.8 and 10.9 million, respectively, coupled with a corresponding near doubling in total gut volume and total surface area. L-cell numbers were found to be distributed rather evenly throughout the jejunum, ileum and colon. Conclusion: The present study provides the first stereological report of total L-cell number and L-cell distribution throughout the rat intestinal tract. In contrast to the currently held view, the majority of L-cells are actually located proximal to the traditionally defined ileum and colon.
Keywords: L-cell, GLP-1, diabetes, stereology, ZDF
Introduction
Along with the introduction of bariatric surgery as a treatment for obesity an increased scientific focus has been directed towards the endocrinology of the gut. Bariatric surgery results in significant weight loss and improvement in health and quality of life [1-3]. Furthermore, surgical procedures such as Roux-en-Y gastric bypass (RYGB) have proven effective in curing diabetes with reported remission rates of type 2 diabetes (T2D) up to 80% [4]. We know today that surgery leads to complex alterations in the secretion of a number of hormones involved in glucose and weight homeostasis (e.g. GIP, GLP-1, PYY, ghrelin and oxyntomodulin, for reviews see: [5,6]) and that some of these hormones exert powerful effects on both appetite function and glucose homeostasis. A better understanding of the gut endocrine system in the normal and diseased gut is therefore pivotal in order to unlock the key to novel pharmacological treatments of diabetes and other obesity-related syndromes.
The total size and length of the intestinal tract is an obstacle for accurate anatomical and quantitative assessments of specific cell populations in this organ. Hence, the vast majority of the anatomical knowledge about the gut endocrine system stems from studies examining distribution frequencies of specific endocrine cells at specific sites of the gut, rather than to actual total numbers of cells [5,7-12]. The endocrine L-cell has attracted special attention over the past decades partly because of the powerful incretin effects of GLP-1 [13,14]. However, the distribution and total numbers of L-cells throughout the intestinal tract remains unknown. Previous studies indicate that the density of L-cells in the gut epithelium increases from the duodenum to the rectum [8,11,15], which has led to the general view that the majority of L-cells are found in the distal part of the gut [16-18]. This view is, however, challenged by several functional data demonstrating a rapid (within 15 minutes) increment in postprandial plasma GLP-1 levels [19-22] and a sustained GLP-1 release even in distally intestinal resected animals [20].
During the last decades, the introduction of design-based stereology, also known as unbiased stereology, has greatly improved the accuracy and reliability of quantification in biological research [23,24]. The main strength of stereological methods is that it can account for three-dimensional structures in terms of three-dimensional quantities. This is in contrast to the two-dimensional sections which are often used for the observation. Thus, counting of cellular profiles and density measurements will inevitably lead to biased results if subtle changes in the size of cells or the reference organ are not accounted for. A number of stereological papers has been published on intestinal morphometry [25-28], however a detailed stereological analysis revealing the factual number of L-cells along the rostro-caudal extension of the gut has not yet been performed.
Materials and methods
Experimental animals
All animal experiments were conducted in accordance with internationally accepted principles for the care and use of laboratory animals, and in compliance with personal animal licenses (2008/561-1565) issued by the Danish Committee for Animal Research.
A total of ten homozygous (fa/fa) male Zucker diabetic fatty rats (ZDF) and ten lean ZDF (Fa/?) rats were obtained (Charles River, Germany) at the age of 9 weeks. The rats were housed under standard housing conditions (temperature 22 ± 2°C, relative humidity 50 ± 10%, light/dark cycle: 12/12, lights off at 16:00 PM) and with ad libitum access to Purina 5008 (Purina 5008, Charles River Germany) to induce programmed and consistent development of T2D. At 20 weeks of age (11 weeks on housing) rats were euthanized with CO2 before decapitation. A 2 ml trunk blood sample was obtained to which was added 20 μl DPP-V inhibitor (Millipore catalogue no DPP4-010). Active GLP-1 was analyzed using an ELISA kit according to the manufacturer instructions (AKMGP-011, Shibayagi, Japan).
Histology
For each group, five randomly selected animals were processed for morphology. The entire intestinal tract was removed and immersion fixed and stored in 4% phosphate buffered formaldehyde until further processing. The intestinal tract was then subdivided into three anatomically distinct segments based on gross morphological markers: the duodenum from the pyloric sphincter to the duodenojejunal bend, the jejunoileum from the duodenojejunal bend to the caecum, and the colon from the caecum to the rectum. The ileum was not separated from the jejunoileum due to the lack of a clear gross morphological criterion. The length of each segment was measured. Each of the segments was embedded in a 4% agarose (60°C) and sampled systematically, uniform randomly into 4 mm slaps across the whole segment (Figure 1A and 1B). Rendering a total of 24-30 slaps from each animal. Each slap was infiltrated overnight in paraffin, mounted 4 together in blocks of paraffin (Tissue-TEK III, Sakura, Denmark) and eventually cut into 5 μm thick paraffin sections on a Microm (HM340E, ThermoScientific, Denmark) (Figure 1C). Sections were mounted singly on separate object glasses, or pairwise as two consecutive sections (Figure 1D).
Figure 1.
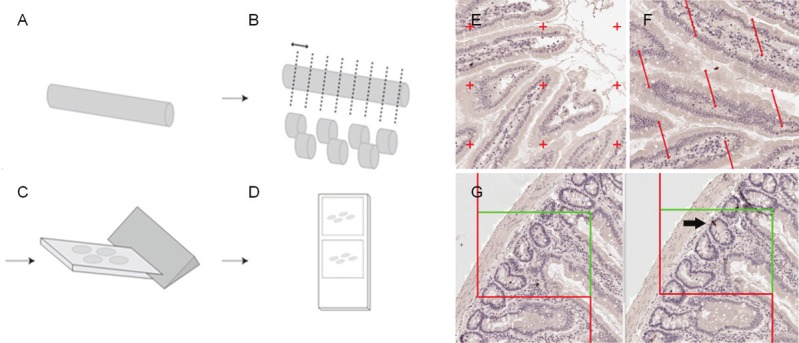
Tissue sampling and stereological probes. The intestinal tract was divided into the duodenum, jejunoileum and colon (A), embedded in agar and divided by systematically uniform random sampling into eight slabs (B). Each slab was embedded on their cut surface in paraffin and cut (C) into single or paired consecutive sections (D). Regional and specific cellular layer volume (i.e. the mucosa, submucosa and muscularis) was estimated by point counting (E). Surface area was estimated by counting intersections between line probes and the mucosal surface (F), and number was estimated using the physical dissector on two paired neighbor sections (G). Arrow indicates the counting event where an immunoreactive cells is evident in one section and not the other.
HE staining
One series of sections were stained with hematoxylin-eosin. Sections were de-paraffinized in toluene (Sigma-Aldrich, Denmark), rehydrated in degrading series of ethanol, stained in a Mayer’s hematoxylin solution (MHS80, Sigma Aldrich, Denmark) and Eosin B solution (HT110280, Sigma-Aldrich), dehydrated and finally coverslipped (Pertex, Sakura, Denmark).
Immunohistochemistry
Series of neighboring sections were stained for GLP-2 immunoreactivity to visualize L-cells. Sections were de-paraffinized in toluene and rehydrated before antigen retrieval in citrate buffer (10 mM, pH 6, at 90°C) and blocking of endogenous peroxidase activity (in 1% H2O2). Sections were incubated with avidin and subsequently biotin (X0590, Dako, Denmark), blocked in swine serum and incubated overnight with the primary GLP-2 antibody diluted 1:32000 (the mouse GLP2-12F21-A7 antibody was kindly provided by Novo Nordisk A/S).
On day 2, sections were rinsed in buffer, incubated for 30 min in biotin-coupled rabbit antimouse secondary antibody (1:2000), rinsed again and incubated in avidin-biotin complex (ABC, X0590, Dako) for 60 min. Following rinses, sections were incubated with biotinylated tyramine, re-incubated in ABC and developed in 0.04% diaminobenzidine. Sections were dehydrated and finally coverslipped (Pertex, Sakura).
Stereology
All stereological estimates were performed on digital slides scanned with a 20x objective on a Hamamatsu Nanozoomer 2.0 HT. Sections were evaluated in a random systematic way by use of the newCAST system (Visiopharm, Denmark).
Estimation of volume
Total gut volume and cellular layer volumes were estimated by point counting using a grid system where all points hitting the mucosa, submucosa and muscularis (including the serosa) cell layers were counted (Figure 1E). The number of points hitting the structure of interest was converted into volume according to:
Volref = ΣP * a(P) * t
Where ΣP is the total number of points hitting the structure of interest, A(p) is the area per point and t is the distance in-between sections [23,24].
Estimation of surface density and total epithelial surface area
Estimations of surface density (Sv) and surface area were performed by counting intersections between linear probes and the luminal side of the gut (Figure 1F) according to:
Sv = (2 ● ΣI) / (IP ● ΣP)
Where ΣI is the number of intersections of the test lines with the epithelium of the tunica mucosa, I(p) is the test line length associated with a point of the grid and ΣP is the number of test points falling on the reference volume [29]. Finally, the absolute surface area was estimated by multiplying the surface density with the reference volume. Estimates of surface density usually require isotropic or vertical sectioning protocols. However, due to the normal isotropic occurrence of villus (no preferred orientation of villus in 3D space) the present study was for all practical purposes performed on transverse sections only. The validity of these assumptions was tested beforehand (data not shown).
Estimation of the total number of L-cells
L-cells were identified using a specific GLP-2 antibody. GLP-1 and GLP-2 are both derived from preproglucagon, and GLP-2 displays a perfect overlap with GLP-1 in L-cells [30]. The current antibody has previously been shown to colocalize 100% with GLP-1 in brainstem preproglucagon expressing neurons [31]. The total number of GLP-1/2 immunoreactive (ir) L-cells was estimated using the principle of the physical disector (Figure 1G) [29,32,33]. The method relies upon the principle that if a particle is seen in one section and not the previous, it is counted. For this purpose tissue sections were sampled as two consecutive levels and evaluated using 2D counting frames. The total number of L-cells in a defined sampling volume was counted and the particle density, Nv, was calculated as:
Nv = ΣQ/a(frame) * h * ΣQ
Where a(frame) is the area per counting frame, h is the distance between the two sections, ΣQ is the total number of counted cells, and ΣP is the total number of points hitting the reference space. The total number of L-cells was finally determined by multiplying Nv with the total reference volume.
Correction for shrinkage
Whereas estimates of cell number are not influenced by tissue processing steps, all estimates of volume and surface area are biased by shrinkage. In order to correct for this and provide estimates of the absolute volume and surface area, we assessed the shrinkage coefficient for the rat gut in frozen and paraffin embedded sections sampled throughout the intestinal tract. The XY shrinkage (or in-section shrinkage) induced by dehydration and paraffin embedding was estimated by comparing point counts performed on frozen unshrunken sections with paraffin embedded sections. The Z shrinkage (or length shrinkage) was estimated by subjecting 2 cm long agarose embedded segments to dehydration before re-measuring the length. The surface shrinkage was estimated according to the procedures described by Karlsen and Pakkenberg [34].
Quantitative ISH
To estimate the total expression of preproglucagon (giving rise to GLP-1, GLP-2 and oxyntomodulin production in the endocrine L-cell) in situ hybridization was performed using a protocol described in detail previously [35,36]. Preproglucagon mRNA was detected using P33-labelled riboprobes directed against rat preproglucagon mRNA (bp 89–250; GenBank accession number: NM_012707). Sense RNA probes were used as negative controls. All sections were processed simultaneously and under the same conditions. Post-hybridization washes were performed at 62 and 67°C in 50% formamide. Following hybridization, the radioactively labeled sections were exposed to autoradiographic film and exposed for 8 hours. Images were acquired using the same camera and light settings in one session. Threshold setting and measurements were performed by an observer blinded to treatment. The same threshold settings were used for all images. Images were analyzed on a computerized image analysis system (NIH-image 1.62b). The total preproglucagon signal was quantified as the area of preproglucagon mRNA expression with a density above threshold by the mean pixel intensity per area multiplied with the sampling interval.
Stereological error and statistics
The precision of the estimator was evaluated in comparison to the biological variability in the sample. Mean regional coefficient of error (CE) was calculated using the approximation formula described by Gundersen and co-workers (1999) [24]. Using this formula, the mean estimated CE was 0.060 for regional volumes and 0.070 for regional numbers based on a mean number of 258 and 228 counting events, respectively, on 9 sections. The shape factor was estimated to 25 according to the nomogram by [23].
Results are presented as mean ± SEM (standard error of the mean) unless otherwise stated. For all data statistical significance was tested using 2-way ANOVA with Bonferroni’s post-test, except data on L-cell density in lean animals (2L) being tested using one-way ANOVA with Tukey’s post-hoc test. P<0.05 was considered statistically significant P>0.05 is marked with *, P>0.01 is marked with ** and P>0.001 is marked ***. All statistics were performed using GraphPad Prism.
Results
In vivo results
At study start, the normoglycemic ZDF rats was approximately 25% heavier than the lean control group (ZDF 260 ± 9.2; lean 211 ± 3.5 g; P<0.0001, n=10). However, at the time of termination the body weight was no longer significantly different (ZDF 404 ± 7.84; Lean 386 ± 6.0, n=10) despite the food intake in obese ZDF rats being 2.7 fold higher than the lean control group (ZFD 37.6 ± 0.8; lean 14.0 ± 0.3 g; P<0.0001). The reduced weight difference is a consequence of the onset and progression of diabetes as reflected in their terminal glucose values (ZDF 26.4 ± 0.41; lean 5.5 ± 0.11 mmol/ml; P<0.0001, n=10). Similarly, terminal plasma levels of active GLP-1 were markedly increased in the ZDF group (ZDF: 19.7 ± 2.35; lean 10.6 ± 1.69 pg/mol; P<0.01, n=10).
L-cell number
The distribution and stereological estimation of L-cells in the rat gut is shown in Figure 2. GLP-2 immunoreactive cells were easily identified by their classical bottle-like shape, minimal luminal contact and distribution intercalated between the epithelial cells in both crypts and villi (Figure 2A-H). The total number of L-cells was significantly higher in the diabetic ZDF rat (10.9 million, P<0.001) and more than twice the level as compared to the lean ZDF rat (4.8 million) (Figure 2I). Interestingly, L-cells were predominantly confined to the jejunoileum accounting for more than 80% of the total L-cell pool (4.0 million and 9.6 million cells in the lean and obese ZDF respectively). In comparison, the number of L-cells in the colon was 0.63 million and 0.97 million in lean and ZDF rats, respectively. There was a tendency towards increased L-cell number in all gut segments, however, attaining statistical significance in the jejunoileum only (Figure 2I). By contrast, the mean density of L-cells was nearly identical in the jejunoileum (approximately 2800 cells/mm3) and colon (2200 cells/mm3), being markedly lower in the duodenum only (app. 500 cells/mm3) (Figure 2J). Distinguishing between proximal and distal gut is of course a matter of definition. An analysis of L-cell number and density throughout the gut of lean ZDF rats revealed that nearly 60% of the total L-cell pool is confined proximal to the traditionally defined ileum (Figure 2K). The L-cell density, increases moderately throughout the extension of the jejunoileum being statistical significantly higher in the most caudal part of the small intestine, as compared to the proximal part (P<0.05, Figure 2L).
Figure 2.
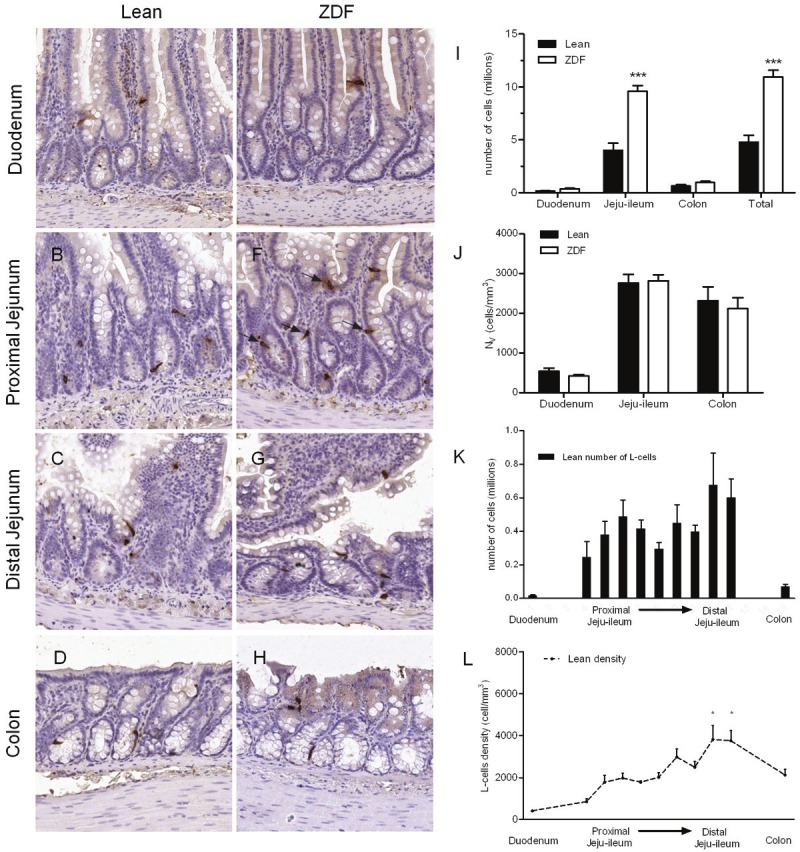
L-cell density and numbers. Representative images from duodenum (A, E) proximal (B, F) and distal (C-G) jejunoileum and colon (D-H) in lean and diabetic ZDF rats. L-cells are stained for GLP-2 immunoreactivity (arrows). Regional and total L-cell number (I) and density (J). L-cell number in throughout the gut of the jejunoileum based on estimates on individual slabs, compared to the total number of cells in the duodenum and colon (K). L-cell density, displayed as line graph (L) with distal ileum tested significantly higher density than all other regions.
Volume and surface area
All stereological sampling and staining procedures allowed for a clear differentiation of the specific cell layers and cell types (Figure 3A-F). In general, the duodenum was characterized nby long, thin and straight villi, with an increased appearance of unattached mucosal structures in the jejunum (representing long villi cut in the transverse plane). The colon was characterized by short luminal villi and several goblet cells dispersed in the epithelium. The stereological analyses of gut volumes in the ZDF rat demonstrated marked changes in both regional and cellular layer volumes when compared to the lean phenotype (Figure 3G-I). The most pronounced expansion in the ZDF rat was seen in the mucosa cell layers in the duodenum (Figure 3G), jejunoileum (Figure 3H) and colon (Figure 3I). The expansion of cellular volume was also evident in the muscularis layers, being statistically significant in all regions except for the duodenum (Figure 3G-I). Although terminal body weight was similar in lean and diabetic ZDF rats, total gut length was 50% longer in diabetic ZDF rats (Figure 3J). Total regional volume was also markedly increased in ZDF rats (Figure 3K). The increased mucosal volume was accompanied by a similar increase in mucosal surface area, the only exception being the colon (Figure 3L). All estimates are provided as absolute values corrected for shrinkage with a mean volume correction factor of 47% and a linear surface shrinkage of 34%.
Figure 3.
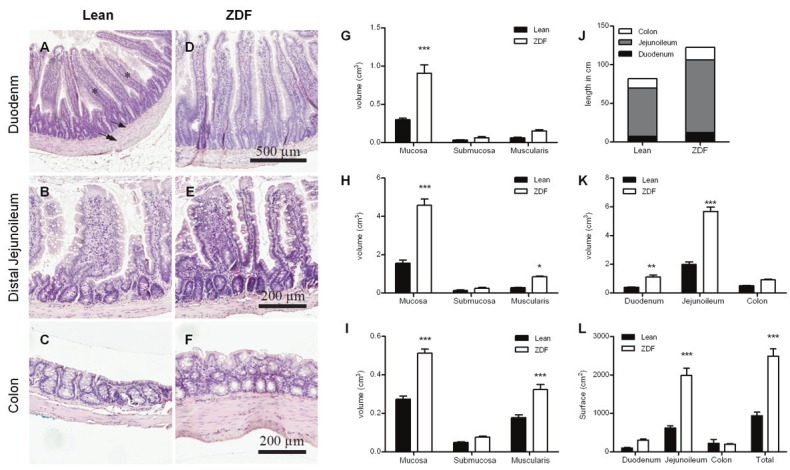
Volume of each of the cellular layers was quantified using stereological counting. Mucosa layer is marked with asterisk, submucosa by single arrow, and muscularis by double arrow. Representative images from duodenum (A, D), distal jejunoileum (B, E) and colon (C, F) in lean and diabetic ZDF rats counterstained with hematoxylin. Estimates of mucosa, submucosa and muscularis volumes in the duodenum (G), jejunoileum (H) and colon (I). Regional and total lengths of the intestinal segments (J) and stereological estimates of total regional volume (K). The total and regional intraluminal surface areas (L).
Preproglucagon expression
The majority of preproglucagon mRNA-expression was confined to jejunoileum with an apparent similar expression density between both groups (Figure 4A and 4C). Individual L-cells was identified on emulsion dipped sections, in a pattern similar to the immunohistochemical stainings. (Figure 4B and 4D). In accordance with the immunohistochemical data on L-cell number, quantification of preproglucagon mRNA was found predominantly in the jejunoileum (approximately 85% of total mRNA) and colon (approximately 15%), with almost no expression in the duodenum (Figure 4E). The semi-quantitative in situ hybridization revealed a significant and almost 100% increase in total preproglucagon expression in the ZDF group compared to the lean controls (Figure 4F). However, when taking the number of L-cells into consideration the relative preproglucagon mRNA expression per cell (total preproglucagon expression divided by total L-cell number) was similar between phenotypes (Figure 4F).
Figure 4.
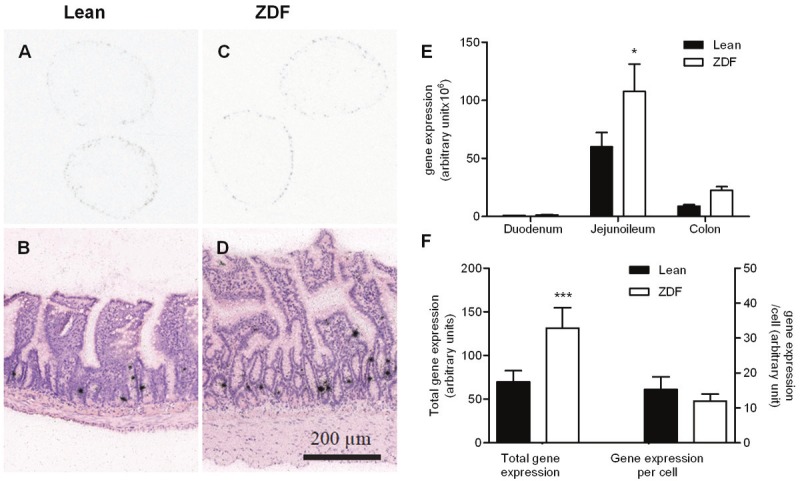
Gene expression analyses. Representative images of preproglucagon expression in the jejunoileum on autoradiographic film (A, C) and emulsion dipped sections (B, D). Regional total preproglucagon expression (E) and total gene expression (left axis) as well as expression per cell (right axis) (F).
Discussion
The present study provides the first stereological report of total L-cell number and L-cell distribution throughout the rat intestinal tract. We demonstrate that in the normal rat gut the total number of L-cells is approximately 4.8 million. In comparison, the normal rat pancreas contains an estimated total of 3.2 million insulin producing beta-cells highlighting the enormous size of the gut endocrine system relative to other endocrine organs [37]. Furthermore, our data underscores the plasticity of the gut by the observation that diabetic ZDF rats exhibited more than doubling of total gut volume and L-cell number compared to lean controls. L-cell density, however, is unchanged between the two phenotypes indicating that signals triggering increased epithelial proliferation will lead to quantitatively similar relative increases in the number of endocrine cells. L-cell density in the different regions of the intestinal tract appears to be genetically determined.
Traditionally, the ileum and terminal colon have been identified as the primary localization for the L-cell population, being that in animal [7,11,38,39] or man [18,40]. This general assumption has led several L-cell studies to specifically focus on the distal ileum and colon [7,9,11,12,41]. Consequently, only few studies have included samples throughout the different gut segments [10,15,42]. These studies examine L-cell densities, and found that the distal part of the intestine holds the greatest cell density. However, counts of cellular profiles and reports of cell densities [11,12,43] do not take into consideration the potential massive contribution from gut hypertrophy leading to potential incorrect conclusions regarding L-cell distribution and number. In contrast to the general view, our quantitative data demonstrate that L-cell numbers are distributed along the full rostrocaudal extent of the jejunoileum with an increase in L-cell density in the distal part of this segment only. The rostral part of the jejunoileum contains almost as many GLP-2 immunoreactive cells as the distal gut. Along with the increase in L-cell number we observed a significant increase in total preproglucagon mRNA expression and plasma GLP-1 concentrations, whereas preproglucagon expression per cell was unaffected. Thus, even though mRNA expression does not necessarily reflect corresponding peptide levels our data indicate that the marked increase in plasma GLP-1 level as seen in the ZDF animals is related to the increased number of L-cells, rather than an increase transcriptional activity per cell.
Increased preproglucagon mRNA expression, as well as increased GLP-1 immunoreactive tissue content has previously been reported in the ZDF rat [43]. Irrespective of diabetic status, preproglucagon expression was shown to be confined mainly to the large intestine, and highly elevated in obese, hyperglycemic animals [43]. A potential influence of disrupted leptin receptor signaling on L-cell dynamics has also been indicated in the large intestine of db/db mice, including increases in length, mucosa thickness and number of L-cells compared to non-diabetic controls [15]. There are several indications of functional leptin receptor activity in the gut, including leptin receptor expression on intestinal L-cells, in both rodent and man [44]. Peripheral administrations of leptin stimulate GLP-1 secretion in rats and ob/ob mice [44,45] and enhance anorexia and weight loss induced by native GLP-1 or GLP-1 agonist. It is possible that the absence of functional leptin receptors may be associated with increased L-cell mRNA expression possibly as a compensatory homeostatic mechanism. However, the marked changes in total L-cell number may also be related to the differences in food intake and/or high levels of circulating glucose. Oral nutrients such as glucose and fat are known to stimulate GLP-1 secretion from the endoluminal side [46,47]. High constant levels of circulating glucose in the diabetic ZDF rat could also potentially affect GLP-1 secretion and cell turnover. Interestingly, non-digestible carbohydrates have also been shown to promote L-cell differentiation in the colon (39) indicating that the hyperphagia in the ZDF rat may potentially be triggering gut hypertrophy per se. The increased total surface area in the duodenum and jejunoileum leads to an increased nutrient-absorbing area and nutrient-stimulated area. The possibility that food changes can drive gut hypertrophy is supported by reports on increased villus length and increased cell number in mice fed a high-fat diet for 8 weeks [48]. Moreover, previously published data in rodent models of gastric surgery [49,50] also demonstrate a marked mucosal hypertrophy and increased number of L-cell in the regions of the gut exposed to partly undigested food components further substantiates this hypothesis. In this respect, it should be noted that both gastric bypass models were normoglycemic preand post-surgery, indicating that glycemic changes are likely not the main contributor, although a role of glucose in the control of L-cell number cannot be excluded. Finally, it should be noted that GLP-2, which is synthesized and secreted from the L-cells in a 1:1 stoichiometric ratio with GLP-1 [30], is a potent intestinal growth factor and inhibitor of apoptosis [51-53]. The increase in L-cell number and total preproglucagon expression leading to enhanced GLP-2 secretion could tentatively provide a positive feedback mechanism to further stimulate gut hypertrophy.
Most available data on gut hypertrophy is based on qualitative criteria [54] or by measuring indirect parameters such as villus height and crypt depth [55,56]. Even though villus height and crypt depth may be used to identify major morphological changes in the intestinal tract [57,58], this procedure can be hampered by the diverse ramification of intestinal villus and the concurrent changes in gut length which is often not corrected for. So far, there have only been a limited number of studies describing this very complicated organ in a systematic quantitative manner [25-28]. In this respect, it is worth emphasizing that the mean epithelial volume in the small intestine (duodenum and jejunoileum) of the rat previously has been shown to be in the range of 2500 mm3 with a surface area of 500-700 cm2 [59]. These data corresponds well to the quantitative estimates presented herein, underscoring the validity of the stereological methods. Moreover, it should be recognized that the quantitative gene expression levels presented herein are estimated as total mRNA expression in series of sections throughout the gut hereby taking into account the marked increase in gut volume and L-cell number. This is in contrast to standard quantitative PCR data being normalized and presented as levels per mg tissue hereby obscuring potential changes related to differences in total volume.
Despite the obvious benefits and validity of the stereological sampling and the data presented herein, one should take into considered potential limitations. First of all, L-cells were identified by GLP-2 immunohistochemistry. Even though GLP-1 immunoreactive cells have been shown to overlap with GLP-2 [30] we cannot conclude that GLP-2 immunohistochemistry labels all L-cells in the gut. Immunohistochemical labeling procedures may vary from laboratory to laboratory based on antigenicity and labeling techniques. Moreover, recent data indicates that enteroendocrine cells may have a much broader potential for expression of multiple peptide precursors than is generally believed [60,61]. Thus, the classical view on specific endocrine lineages (i.e. distinct L, K, I cell lineages) may be changing [62].
In a translational point of view, our data may provide an explanation for the rapid increment in plasma GLP-1 levels observed after ingesting glucose or mixed meals, and before nutrients have entered the presumed L-cell rich distal intestinal regions [19-22]. Resection of the distal small intestine or colectomy do not lead to changes in GLP-1 release after an oral glucose load in man [20]. This suggests that the GLP-1 immediately secreted following glucose ingestion mainly stems from upper gut L-cells and not from distal cells in the ileum, colon and rectum. The present findings may also be central for understanding the mechanisms involved in the dramatic changes in glucose homeostasis following gastric bypass surgery. Surgical procedures such as Roux-en-Y gastric bypass (RYGB) leads to a rapid (usually within days) resolution of diabetes in more than 80% of obese patients with T2D [1,4,63] which is temporally associated with massive increases in plasma GLP-1 and PYY levels [64-66]. The rapid elevation in plasma GLP-1 and PYY levels may be related to the rapid delivery of undigested nutrients to the upper small intestine stimulating the large rostral L-cell population.
In conclusion, using stereological methods we demonstrate that L-cells in the rat intestine are distributed rather evenly throughout the jejunoileum to the distal colon. This is in contrast to the general belief that L-cells are confined to the distal ileum and colon, but in good agreement with a number of functional data. Moreover, increased plasma GLP-1 levels in the obese ZDF rat are associated with an increased number of L-cells in the intestinal tract and greatly increased gut volume, as well as increased total preproglucagon mRNA levels. The L-cell density, however, is unaffected which provides support for the hypothesis that the endocrine cell pool is genetically encoded in the various gut segments and that signals leading to increased epithelial proliferation will cause similar adaptive quantitative effects on L-cell numbers.
Acknowledgements
Funding: This research was supported by the Danish Agency for Science, Technology and Innovation by a personal stipend to CFH.
Declaration of interest
FH, NV and JJ are currently employed by Gubra. PTS has nothing to declare.
References
- 1.Sjostrom L. Bariatric surgery and reduction in morbidity and mortality: experiences from the SOS study. Int J Obes (Lond) 2008;32(Suppl 7):S93–97. doi: 10.1038/ijo.2008.244. [DOI] [PubMed] [Google Scholar]
- 2.Pories WJ, Swanson MS, MacDonald KG, Long SB, Morris PG, Brown BM, Barakat HA, deRamon RA, Israel G, Dolezal JM, et al. Who would have thought it? An operation proves to be the most effective therapy for adult-onset diabetes mellitus. Ann Surg. 1995;222:339–350. doi: 10.1097/00000658-199509000-00011. discussion 350-352. [DOI] [PMC free article] [PubMed] [Google Scholar]
- 3.Kim S, Richards WO. Long-term follow-up of the metabolic profiles in obese patients with type 2 diabetes mellitus after Roux-en-Y gastric bypass. Ann Surg. 2010;251:1049–1055. doi: 10.1097/SLA.0b013e3181d9769b. [DOI] [PubMed] [Google Scholar]
- 4.Buchwald H, Estok R, Fahrbach K, Banel D, Jensen MD, Pories WJ, Bantle JP, Sledge I. Weight and type 2 diabetes after bariatric surgery: systematic review and meta-analysis. Am J Med. 2009;122:248–256. 245. doi: 10.1016/j.amjmed.2008.09.041. [DOI] [PubMed] [Google Scholar]
- 5.Tharakan G, Tan T, Bloom S. Emerging therapies in the treatment of ‘diabesity’: beyond GLP-1. Trends Pharmacol Sci. 2011;32:8–15. doi: 10.1016/j.tips.2010.10.003. [DOI] [PubMed] [Google Scholar]
- 6.Rhee NA, Vilsboll T, Knop FK. Current evidence for a role of GLP-1 in Roux-en-Y gastric bypass-induced remission of type 2 diabetes. Diabetes Obes Metab. 2012;14:291–298. doi: 10.1111/j.1463-1326.2011.01505.x. [DOI] [PubMed] [Google Scholar]
- 7.Bryant MG, Bloom SR. Distribution of the gut hormones in the primate intestinal tract. Gut. 1979;20:653–659. doi: 10.1136/gut.20.8.653. [DOI] [PMC free article] [PubMed] [Google Scholar]
- 8.Evans GS, Potten CS. The distribution of endocrine cells along the mouse intestine: a quantitative immunocytochemical study. Virchows Arch B Cell Pathol Incl Mol Pathol. 1988;56:191–199. doi: 10.1007/BF02890017. [DOI] [PubMed] [Google Scholar]
- 9.Barbosa AJ, Nogueira JC, Penna FJ, Polak JM. Distribution of enteroglucagon- and polypeptide YY-immunoreactive cells in the gastrointestinal tract of the white-belly opossum (Didelphis albiventris) Histochemistry. 1987;88:37–40. doi: 10.1007/BF00490164. [DOI] [PubMed] [Google Scholar]
- 10.Mortensen K, Christensen LL, Holst JJ, Orskov C. GLP-1 and GIP are colocalized in a subset of endocrine cells in the small intestine. Regul Pept. 2003;114:189–196. doi: 10.1016/s0167-0115(03)00125-3. [DOI] [PubMed] [Google Scholar]
- 11.Eissele R, Goke R, Willemer S, Harthus HP, Vermeer H, Arnold R, Goke B. Glucagon-like peptide-1 cells in the gastrointestinal tract and pancreas of rat, pig and man. Eur J Clin Invest. 1992;22:283–291. doi: 10.1111/j.1365-2362.1992.tb01464.x. [DOI] [PubMed] [Google Scholar]
- 12.Grigoryan M, Kedees MH, Charron MJ, Guz Y, Teitelman G. Regulation of Mouse Intestinal L Cell Progenitors Proliferation by the Glucagon Family of Peptides. Endocrinology. 2012 Jul;153:3076–88. doi: 10.1210/en.2012-1120. [DOI] [PMC free article] [PubMed] [Google Scholar]
- 13.Holst JJ. The physiology of glucagon-like peptide 1. Physiol Rev. 2007;87:1409–1439. doi: 10.1152/physrev.00034.2006. [DOI] [PubMed] [Google Scholar]
- 14.Drucker DJ. The biology of incretin hormones. Cell Metab. 2006;3:153–165. doi: 10.1016/j.cmet.2006.01.004. [DOI] [PubMed] [Google Scholar]
- 15.Pinto HC, Portela-Gomes GM, Grimelius L, Kohnert KD, de Sousa JC, Albuquerque MA. The distribution of endocrine cell types of the gastrointestinal mucosa in genetically diabetic (db/db) mice. Gastroenterology. 1995;108:967–974. doi: 10.1016/0016-5085(95)90191-4. [DOI] [PubMed] [Google Scholar]
- 16.Rocca AS, Brubaker PL. Role of the vagus nerve in mediating proximal nutrient-induced glucagon-like peptide-1 secretion. Endocrinology. 1999;140:1687–1694. doi: 10.1210/endo.140.4.6643. [DOI] [PubMed] [Google Scholar]
- 17.Nauck MA, Vardarli I, Deacon CF, Holst JJ, Meier JJ. Secretion of glucagon-like peptide-1 (GLP-1) in type 2 diabetes: what is up, what is down? Diabetologia. 2011;54:10–18. doi: 10.1007/s00125-010-1896-4. [DOI] [PubMed] [Google Scholar]
- 18.Varndell IM, Bishop AE, Sikri KL, Uttenthal LO, Bloom SR, Polak JM. Localization of glucagon-like peptide (GLP) immunoreactants in human gut and pancreas using light and electron microscopic immunocytochemistry. J Histochem Cytochem. 1985;33:1080–1086. doi: 10.1177/33.10.3900195. [DOI] [PubMed] [Google Scholar]
- 19.Balks HJ, Holst JJ, von zur Muhlen A, Brabant G. Rapid oscillations in plasma glucagon-like peptide-1 (GLP-1) in humans: cholinergic control of GLP-1 secretion via muscarinic receptors. J Clin Endocrinol Metab. 1997;82:786–790. doi: 10.1210/jcem.82.3.3816. [DOI] [PubMed] [Google Scholar]
- 20.Nauck MA, Siemsgluss J, Orskov C, Holst JJ. Release of glucagon-like peptide 1 (GLP-1 [7-36 amide] ), gastric inhibitory polypeptide (GIP) and insulin in response to oral glucose after upper and lower intestinal resections. Z Gastroenterol. 1996;34:159–166. [PubMed] [Google Scholar]
- 21.Herrmann C, Goke R, Richter G, Fehmann HC, Arnold R, Goke B. Glucagon-like peptide-1 and glucose-dependent insulin-releasing polypeptide plasma levels in response to nutrients. Digestion. 1995;56:117–126. doi: 10.1159/000201231. [DOI] [PubMed] [Google Scholar]
- 22.Ghatei MA, Uttenthal LO, Christofides ND, Bryant MG, Bloom SR. Molecular forms of human enteroglucagon in tissue and plasma: plasma responses to nutrient stimuli in health and in disorders of the upper gastrointestinal tract. J Clin Endocrinol Metab. 1983;57:488–495. doi: 10.1210/jcem-57-3-488. [DOI] [PubMed] [Google Scholar]
- 23.Gundersen HJ, Jensen EB. The efficiency of systematic sampling in stereology and its prediction. J Microsc. 1987;147:229–263. doi: 10.1111/j.1365-2818.1987.tb02837.x. [DOI] [PubMed] [Google Scholar]
- 24.Gundersen HJ, Jensen EB, Kieu K, Nielsen J. The efficiency of systematic sampling in stereology--reconsidered. J Microsc. 1999;193:199–211. doi: 10.1046/j.1365-2818.1999.00457.x. [DOI] [PubMed] [Google Scholar]
- 25.Van Ginneken C, Van Meir F, Weyns A. Stereologic characteristics of pig small intestine during normal development. Dig Dis Sci. 2002;47:868–878. doi: 10.1023/a:1014768806773. [DOI] [PubMed] [Google Scholar]
- 26.Mayhew TM, Elbrond VS, Dantzer V, Skadhauge E, Moller O. Structural and enzymatic studies on the plasma membrane domains and sodium pump enzymes of absorptive epithelial cells in the avian lower intestine. Cell Tissue Res. 1992;270:577–585. doi: 10.1007/BF00645061. [DOI] [PubMed] [Google Scholar]
- 27.Mayhew TM. Geometric model of the rat intestinal mucosa for stereological evaluation of villus amplification factors. J Microsc. 1984;135:337–346. doi: 10.1111/j.1365-2818.1984.tb02538.x. [DOI] [PubMed] [Google Scholar]
- 28.Mikkelsen HB, Larsen JO, Froh P, Nguyen TH. Quantitative Assessment of Macrophages in the Muscularis Externa of Mouse Intestines. Anat Rec (Hoboken) 2011 doi: 10.1002/ar.21444. Epub ahead of print. [DOI] [PubMed] [Google Scholar]
- 29.Pakkenberg B, Gundersen HJ. Total number of neurons and glial cells in human brain nuclei estimated by the disector and the fractionator. J Microsc. 1988;150:1–20. doi: 10.1111/j.1365-2818.1988.tb04582.x. [DOI] [PubMed] [Google Scholar]
- 30.Orskov C, Holst JJ, Knuhtsen S, Baldissera FG, Poulsen SS, Nielsen OV. Glucagon-like peptides GLP-1 and GLP-2, predicted products of the glucagon gene, are secreted separately from pig small intestine but not pancreas. Endocrinology. 1986;119:1467–1475. doi: 10.1210/endo-119-4-1467. [DOI] [PubMed] [Google Scholar]
- 31.Vrang N, Hansen M, Larsen PJ, Tang-Christensen M. Characterization of brainstem preproglucagon projections to the paraventricular and dorsomedial hypothalamic nuclei. Brain Res. 2007;1149:118–126. doi: 10.1016/j.brainres.2007.02.043. [DOI] [PubMed] [Google Scholar]
- 32.Sterio DC. The unbiased estimation of number and sizes of arbitrary particles using the disector. J Microsc. 1984;134:127–136. doi: 10.1111/j.1365-2818.1984.tb02501.x. [DOI] [PubMed] [Google Scholar]
- 33.Gundersen HJ, Bagger P, Bendtsen TF, Evans SM, Korbo L, Marcussen N, Moller A, Nielsen K, Nyengaard JR, Pakkenberg B, et al. The new stereological tools: disector, fractionator, nucleator and point sampled intercepts and their use in pathological research and diagnosis. APMIS. 1988;96:857–881. doi: 10.1111/j.1699-0463.1988.tb00954.x. [DOI] [PubMed] [Google Scholar]
- 34.Karlsen AS, Pakkenberg B. Total numbers of neurons and glial cells in cortex and basal ganglia of aged brains with Down syndrome--a stereological study. Cereb Cortex. 2011;21:2519–2524. doi: 10.1093/cercor/bhr033. [DOI] [PubMed] [Google Scholar]
- 35.Kristensen P, Eriksen J, Dano K. Localization of urokinase-type plasminogen activator messenger RNA in the normal mouse by in situ hybridization. J Histochem Cytochem. 1991;39:341–349. doi: 10.1177/39.3.1899685. [DOI] [PubMed] [Google Scholar]
- 36.Vrang N, Larsen PJ, Jensen PB, Lykkegaard K, Artmann A, Larsen LK, Tang-Christensen M. Upregulation of the brainstem preproglucagon system in the obese Zucker rat. Brain Res. 2008;1187:116–124. doi: 10.1016/j.brainres.2007.10.026. [DOI] [PubMed] [Google Scholar]
- 37.Bock T, Svenstrup K, Pakkenberg B, Buschard K. Unbiased estimation of total beta-cell number and mean beta-cell volume in rodent pancreas. APMIS. 1999;107:791–799. doi: 10.1111/j.1699-0463.1999.tb01474.x. [DOI] [PubMed] [Google Scholar]
- 38.Polak JM, Bloom S, Coulling I, Pearse AG. Immunofluorescent localization of enteroglucagon cells in the gastrointestinal tract of the dog. Gut. 1971;12:311–318. doi: 10.1136/gut.12.4.311. [DOI] [PMC free article] [PubMed] [Google Scholar]
- 39.Yamada J, Tauchi M, Rerkamnuaychoke W, Endo H, Chungsamarnyart N, Kimura J, Kurohmaru M, Hondo E, Kitamura N, Nishida T, Hayashi Y. Immunohistochemical survey of the gut endocrine cells in the common tree shrew (Tupaia belangeri) J Vet Med Sci. 1999;61:761–767. doi: 10.1292/jvms.61.761. [DOI] [PubMed] [Google Scholar]
- 40.O’Brien RM, Granner DK. Regulation of gene expression by insulin. Physiol Rev. 1996;76:1109–1161. doi: 10.1152/physrev.1996.76.4.1109. [DOI] [PubMed] [Google Scholar]
- 41.Cani PD, Hoste S, Guiot Y, Delzenne NM. Dietary non-digestible carbohydrates promote L-cell differentiation in the proximal colon of rats. Br J Nutr. 2007;98:32–37. doi: 10.1017/S0007114507691648. [DOI] [PubMed] [Google Scholar]
- 42.Van Ginneken C, Verlinden K, Van Meir F, Sys S, Weyns A. A stereologic evaluation of glucagon-like peptide-1 (GLP-1) mucosal cells in the small intestine of the developing pig. Anat Embryol (Berl) 2002;205:153–157. doi: 10.1007/s00429-002-0235-z. [DOI] [PubMed] [Google Scholar]
- 43.Berghofer P, Peterson RG, Schneider K, Fehmann HC, Goke B. Incretin hormone expression in the gut of diabetic mice and rats. Metabolism. 1997;46:261–267. doi: 10.1016/s0026-0495(97)90251-1. [DOI] [PubMed] [Google Scholar]
- 44.Anini Y, Brubaker PL. Role of leptin in the regulation of glucagon-like peptide-1 secretion. Diabetes. 2003;52:252–259. doi: 10.2337/diabetes.52.2.252. [DOI] [PubMed] [Google Scholar]
- 45.Williams DL, Baskin DG, Schwartz MW. Leptin regulation of the anorexic response to glucagon-like peptide-1 receptor stimulation. Diabetes. 2006;55:3387–3393. doi: 10.2337/db06-0558. [DOI] [PubMed] [Google Scholar]
- 46.Elliott RM, Morgan LM, Tredger JA, Deacon S, Wright J, Marks V. Glucagon-like peptide-1 (7-36)amide and glucose-dependent insulinotropic polypeptide secretion in response to nutrient ingestion in man: acute post-prandial and 24-h secretion patterns. J Endocrinol. 1993;138:159–166. doi: 10.1677/joe.0.1380159. [DOI] [PubMed] [Google Scholar]
- 47.Roberge JN, Brubaker PL. Regulation of intestinal proglucagon-derived peptide secretion by glucose-dependent insulinotropic peptide in a novel enteroendocrine loop. Endocrinology. 1993;133:233–240. doi: 10.1210/endo.133.1.8319572. [DOI] [PubMed] [Google Scholar]
- 48.de Wit NJ, Bosch-Vermeulen H, de Groot PJ, Hooiveld GJ, Bromhaar MM, Jansen J, Muller M, van der Meer R. The role of the small intestine in the development of dietary fat-induced obesity and insulin resistance in C57BL/6J mice. BMC Med Genomics. 2008;1:14. doi: 10.1186/1755-8794-1-14. [DOI] [PMC free article] [PubMed] [Google Scholar]
- 49.Cummings BP, Strader AD, Stanhope KL, Graham JL, Lee J, Raybould HE, Baskin DG, Havel PJ. Ileal interposition surgery improves glucose and lipid metabolism and delays diabetes onset in the UCD-T2DM rat. Gastroenterology. 2010;138:2437–2446. e2431. doi: 10.1053/j.gastro.2010.03.005. [DOI] [PMC free article] [PubMed] [Google Scholar]
- 50.Bueter M, Lowenstein C, Olbers T, Wang M, Cluny NL, Bloom SR, Sharkey KA, Lutz TA, le Roux CW. Gastric bypass increases energy expenditure in rats. Gastroenterology. 2010;138:1845–1853. doi: 10.1053/j.gastro.2009.11.012. [DOI] [PubMed] [Google Scholar]
- 51.Brubaker PL, Izzo A, Hill M, Drucker DJ. Intestinal function in mice with small bowel growth induced by glucagon-like peptide-2. Am J Physiol. 1997;272:E1050–1058. doi: 10.1152/ajpendo.1997.272.6.E1050. [DOI] [PubMed] [Google Scholar]
- 52.Drucker DJ, Erlich P, Asa SL, Brubaker PL. Induction of intestinal epithelial proliferation by glucagon-like peptide 2. Proc Natl Acad Sci U S A. 1996;93:7911–7916. doi: 10.1073/pnas.93.15.7911. [DOI] [PMC free article] [PubMed] [Google Scholar]
- 53.Litvak DA, Hellmich MR, Evers BM, Banker NA, Townsend CM Jr. Glucagon-like peptide 2 is a potent growth factor for small intestine and colon. J Gastrointest Surg. 1998;2:146–150. doi: 10.1016/s1091-255x(98)80005-x. [DOI] [PubMed] [Google Scholar]
- 54.Jin X, Zimmers TA, Zhang Z, Pierce RH, Koniaris LG. Interleukin-6 is an important in vivo inhibitor of intestinal epithelial cell death in mice. Gut. 2010;59:186–196. doi: 10.1136/gut.2008.151175. [DOI] [PubMed] [Google Scholar]
- 55.Viguera RM, Rojas-Castaneda J, Hernandez R, Reyes G, Alvarez C. Histological characteristics of the intestinal mucosa of the rat during the first year of life. Lab Anim. 1999;33:393–400. doi: 10.1258/002367799780487814. [DOI] [PubMed] [Google Scholar]
- 56.Bertoni S, Gabella G. Hypertrophy of mucosa and serosa in the obstructed intestine of rats. J Anat. 2001;199:725–734. doi: 10.1046/j.1469-7580.2001.19960725.x. [DOI] [PMC free article] [PubMed] [Google Scholar]
- 57.Stearns AT, Balakrishnan A, Tavakkolizadeh A. Impact of Roux-en-Y gastric bypass surgery on rat intestinal glucose transport. Am J Physiol Gastrointest Liver Physiol. 2009;297:G950–957. doi: 10.1152/ajpgi.00253.2009. [DOI] [PMC free article] [PubMed] [Google Scholar]
- 58.Sukhotnik I, Shamir R, Bashenko Y, Mogilner JG, Chemodanov E, Shaoul R, Coran AG, Shehadeh N. Effect of oral insulin on diabetes-induced intestinal mucosal growth in rats. Dig Dis Sci. 2011;56:2566–2574. doi: 10.1007/s10620-011-1654-6. [DOI] [PubMed] [Google Scholar]
- 59.Mayhew TM, Middleton C. Crypts, villi and microvilli in the small intestine of the rat. A stereological study of their variability within and between animals. J Anat. 1985;141:1–17. [PMC free article] [PubMed] [Google Scholar]
- 60.Habib AM, Richards P, Cairns LS, Rogers GJ, Bannon CA, Parker HE, Morley TC, Yeo GS, Reimann F, Gribble FM. Overlap of endocrine hormone expression in the mouse intestine revealed by transcriptional profiling and flow cytometry. Endocrinology. 2012;153:3054–3065. doi: 10.1210/en.2011-2170. [DOI] [PMC free article] [PubMed] [Google Scholar]
- 61.Egerod KL, Engelstoft MS, Grunddal KV, Nohr MK, Secher A, Sakata I, Pedersen J, Windelov JA, Fuchtbauer EM, Olsen J, Sundler F, Christensen JP, Wierup N, Olsen JV, Holst JJ, Zigman JM, Poulsen SS, Schwartz TW. A major lineage of enteroendocrine cells coexpress CCK, secretin, GIP, GLP-1, PYY, and neurotensin but not somatostatin. Endocrinology. 2012;153:5782–5795. doi: 10.1210/en.2012-1595. [DOI] [PMC free article] [PubMed] [Google Scholar]
- 62.Gribble FM. The gut endocrine system as a coordinator of postprandial nutrient homoeostasis. Proc Nutr Soc. 2012;71:456–462. doi: 10.1017/S0029665112000705. [DOI] [PubMed] [Google Scholar]
- 63.Schauer PR, Burguera B, Ikramuddin S, Cottam D, Gourash W, Hamad G, Eid GM, Mattar S, Ramanathan R, Barinas-Mitchel E, Rao RH, Kuller L, Kelley D. Effect of laparoscopic Roux-en Y gastric bypass on type 2 diabetes mellitus. Ann Surg. 2003;238:467–484. doi: 10.1097/01.sla.0000089851.41115.1b. discussion 484-485. [DOI] [PMC free article] [PubMed] [Google Scholar]
- 64.le Roux CW, Aylwin SJ, Batterham RL, Borg CM, Coyle F, Prasad V, Shurey S, Ghatei MA, Patel AG, Bloom SR. Gut hormone profiles following bariatric surgery favor an anorectic state, facilitate weight loss, and improve metabolic parameters. Ann Surg. 2006;243:108–114. doi: 10.1097/01.sla.0000183349.16877.84. [DOI] [PMC free article] [PubMed] [Google Scholar]
- 65.Korner J, Bessler M, Cirilo LJ, Conwell IM, Daud A, Restuccia NL, Wardlaw SL. Effects of Roux-en-Y gastric bypass surgery on fasting and postprandial concentrations of plasma ghrelin, peptide YY, and insulin. J Clin Endocrinol Metab. 2005;90:359–365. doi: 10.1210/jc.2004-1076. [DOI] [PubMed] [Google Scholar]
- 66.Vincent RP, le Roux CW. Changes in gut hormones after bariatric surgery. Clin Endocrinol (Oxf) 2008;69:173–179. doi: 10.1111/j.1365-2265.2007.03164.x. [DOI] [PubMed] [Google Scholar]