

Abstract
Structural and diffusion imaging studies demonstrate effects of age, sex, and asymmetry in many brain structures. However, few studies have addressed how individual differences might influence the structural integrity of the superficial white matter (SWM), comprised of short-range association (U-fibers), and intracortical axons. This study thus applied a sophisticated computational analysis approach to structural and diffusion imaging data obtained from healthy individuals selected from the International Consortium for Brain Mapping (ICBM) database across a wide adult age range (n=65, age: 18–74 years, all Caucasian). Fractional anisotropy (FA), radial diffusivity (RD), and axial diffusivity (AD) were sampled and compared at thousands of spatially matched SWM locations and within regions-of-interest to examine global and local variations in SWM integrity across age, sex, and hemisphere. Results showed age-related reductions in FA that were more pronounced in the frontal SWM than in the posterior and ventral brain regions, whereas increases in RD and AD were observed across large areas of the SWM. FA was significantly greater in left temporoparietal regions in men and in the posterior callosum in women. Prominent leftward FA and rightward AD and RD asymmetries were observed in the temporal, parietal, and frontal regions. Results extend previous findings restricted to the deep white matter pathways to demonstrate regional changes in the SWM microstructure relating to processes of demyelination and/or to the number, coherence, or integrity of axons with increasing age. SWM fiber organization/coherence appears greater in the left hemisphere regions spanning language and other networks, while more localized sex effects could possibly reflect sex-specific advantages in information strategies.
Key words: aging, diffusion tensor imaging (DTI), fractional anisotropy (FA), magnetic resonance imaging (MRI), structural connectivity, U-fibers
Introduction
Alarge body of structural magnetic resonance imaging (sMRI) and diffusion tensor imaging (DTI) research has focused on examining individual differences associated with brain aging, for example (Hedman et al., 2011; Lebel et al., 2008; Sowell et al., 2003), sex (Gong et al., 2011; Kang et al., 2011; Luders and Toga, 2010), and hemispheric lateralization (Galaburda et al., 1978; Good et al., 2001; Toga and Thompson, 2003). However, with only a few exceptions (Kang et al., 2011, 2012; Oishi et al., 2009), little MRI research has been directed toward examining the microstructural properties of the superficial white matter (SWM) outside of some early studies in clinical and neurological samples, such as Alzheimer's (Fornari et al., 2010), schizophrenia (Phillips et al., 2011b), and autism (Sundaram et al., 2008). Consequently, less is known about variations in the integrity of the SWM across the normal adult age range as related to sex, age, and cerebral asymmetry.
The SWM or the white matter (WM) directly beneath the cortex contains a mixture of short association fibers that include intracortical axons, which extend directly from the gray matter, subcortical fibers (U-fibers) that arch through the cortical sulci to connect adjacent gyri, and some termination fibers from the deep fiber pathways (Parent and Carpenter, 1996; Oishi et al., 2008). Postmortem and in vivo research show that U-fibers constitute the terminal zone of myelination and remain incompletely myelinated until the third or fourth decade of life (Parazzini et al., 2002). This aspect of the cerebral WM is highly developed in humans, and it occupies a much larger volume than in other mammals. Other unique features of SWM composition include a larger proportion of interstitial neurons with respect to the deep WM (Suarez-Sola et al., 2009). Further, the morphological profile of the SWM differs across brain regions where, for example, the concentration of interstitial neurons is higher in the frontal SWM and lower in the occipital SWM (Defelipe et al., 2010).
Numerous DTI studies in humans and animals support that in regions where the tensor model is valid (Basser and Pierpaoli, 1996), fractional anisotropy (FA) and scalar metrics, including axial diffusivity (AD) and radial diffusivity (RD), associate with the extent of myelination, fiber coherence, overall number of axons, and/or differences in the mean axonal diameter (Dong et al., 2004; Song et al., 2003; Takahashi et al., 2002). These parameters may thus reflect normal aging or sexual dimorphic processes that occur in tandem with global and regional changes in other brain tissue characteristics such as volume and cortical thickness (Hedman et al., 2011; Lebel et al., 2012; Sowell et al., 2003; Westlye et al., 2010). Although not focused on the SWM per se, prior DTI studies demonstrate increasing FA during brain development that then plateau and decrease during normal aging, though age-related changes are also shown to vary across WM regions (Barnea-Goraly et al., 2005; Kochunov et al., 2011; Lebel et al., 2012; Michielse et al., 2010; Tamnes et al., 2010). Investigations simultaneously examining AD and RD also show effects of age that differ regionally. However, while some deep WM pathways show increases in both AD and RD along with reductions in FA with advancing age, others show increased RD with no change or decreased AD (Bennett et al., 2010; Burzynska et al., 2010; Davis et al., 2009; Inano et al., 2011).
Prior findings further suggest that biological sex may influence the regional WM microstructure, though results are more subtle than those observed with regard to aging. While some studies fail to show significant differences in DTI metrics between men and women (Kennedy and Raz, 2009), a recent study has suggested that women have higher FA in the corpus callosum (Kanaan et al., 2012), whereas men have higher FA in the right temporal (Hsu et al., 2008), the cingulum, and other deep WM regions (Inano et al., 2011; Menzler et al., 2011), including the superior longitudinal fasciculus, a tract implicated in language processing (Kanaan et al., 2012). However, sex effects may also vary with developmental stage. For example, higher FA has been reported in adolescent females in the right superior corona radiata and bilateral corticospinal tracts (Bava et al., 2011). Another study has shown larger FA in the vicinity of the temporal/parietal/occipital junction and supplementary motor regions in men within the pericortical WM in a young adult sample (age range: 21–37 years) (Kang et al., 2011), implicating sex differences within the SWM in particular.
Cerebral lateralization is also influenced by sex, developmental, hereditary, and pathological factors (Toga and Thompson, 2003). Consequently, previous research has similarly focused on addressing how WM characteristics measured from DTI may vary across hemispheres. Higher left-hemisphere FA has been relatively consistently reported (Kang et al., 2011; Oishi et al., 2008; Takao et al., 2010), though some discrete WM regions exhibit a greater right hemisphere FA (Jahanshad et al., 2010). Although this leftward bias may indicate greater myelination and fiber integrity in tracts linked with language function such as the arcuate fasciculus (Takao et al., 2011), several other deep WM pathways also exhibit left-lateralized effects (Hasan et al., 2009; Thiebaut de Schotten et al., 2011).
As indicated above, the structural connectivity of the deep WM is shown to vary with respect to sex, age, and hemisphere, although the regional specificity of findings remains less consistent. Further, how these variables impact the integrity of the SWM specifically has not been the focus of prior investigation. This may in part reflect the difficulties in measuring diffusion characteristics in the WM directly beneath the cortical mantle, which is highly variable across subjects (Smith et al., 2006; Thompson et al., 2001), less-densely myelinated, and includes more complex fiber trajectories than the major deep WM pathways (Oishi et al., 2008). Widely used voxel-based mapping, tract-based atlasing, and standard tractography approaches may thus be less sensitive for extracting and comparing DTI metrics within the SWM at the juncture of the neuropil. To circumvent some of these limitations and expand the current literature concerning the influences of individual differences on SWM integrity, this study applied an advanced computational analysis approach that combines information from both DTI and sMRI data to allow local sampling of SWM integrity measures. Specifically, cortical pattern-matching algorithms, which have been validated and used for integrating data across imaging modalities (Lu et al., 2009; Phillips et al., 2011a, 2011b, Rasser et al., 2009), were applied to estimate and compare the effects of sex, age, and hemisphere, and their interactions for FA, AD, and RD values at thousands of spatially matched locations within the SWM in a demographically homogenous sample of healthy subjects assessed cross-sectionally (n=65, age range: 18–74 years). DTI metrics were also examined within lobar regions to describe more global changes. Based on the findings for deep WM pathways, we predicted that measures of SWM fiber integrity would decrease with age, and indicate a predominant left hemisphere bias and some regional differences between sexes.
Methods
Subjects
Subjects were recruited at the University of California, Los Angeles (UCLA), as part of the International Consortium for Brain Mapping (ICBM) project (Mazziotta et al., 2009). Subjects were extensively screened by medical and neurological examination to exclude any major medical, neurological, neurosurgical, or psychiatric conditions, high blood pressure, use of prescriptions, and over-the-counter or illicit drugs with the exception of occasional use for disease prevention [for details, see (Mazziotta et al., 2009)]. For this study, only individuals with high-quality DTI data collected from the same research site and of the same racial/ethnic group were included for examination. Subjects included 65 Caucasian (31 men, mean age: 36.45±13.6 years; 34 women, mean age: 45.15±17.28 years). Handedness was determined using a modified version of the Edinburgh Inventory (Oldfield, 1971). All subjects provided UCLA Institutional Review Board-approved informed consent. Table 1 provides demographic details of the study participants.
Table 1.
Subject Demographics and Volumetric Measures
| All subjects | Females | Males | |
|---|---|---|---|
| n | 34/31 | 34 | 31 |
| Age (mean±SD) | 41±16.1 | 45.15±17.28 | 36.45±13.6 |
| Age range (min/max) | 18/74 | 19/74 | 18/69 |
| Handedness (dextral/nondextral) | 56/9 | 29/5 | 27/4 |
| Total brain volume in cc (mean±SD) | 1705.19±167.7 | 1602.3±116.5 | 1818.0±141.2 |
| White-matter volume in cc (mean±SD) | 568.9±75.1 | 532.1±59.0 | 609.5±70.5 |
Image acquisition and preprocessing
The ICBM image acquisition protocol can be found online at www.loni.ucla.edu/ICBM/About/About_Scanning.shtml. Structural T1-weighed and diffusion-weighed data were acquired on a 1.5T Siemens Sonata scanner using an 8-channel head coil (acceleration factor of 2, GRAPPA reconstruction). Five MPRAGEs were acquired sagittally with a voxel resolution of 1 mm3 (TI/TR/TE/FA=1100 msec/1900 msec/4.38 msec/15°). The DTI data were acquired using a twice-refocused, spin-echo, echo-planar, pulse sequence (Reese et al., 2003). Five nondiffusion-weighed images (b=0 sec/mm2) and 30 directionally sensitized diffusion-weighed images (b=1000 sec/mm2) were acquired with a voxel resolution of 2.5 mm3 (interpolated in-plane for a final voxel resolution of 1.25×1.25×2.5 mm). sMRI and DTI processing streams followed those detailed previously (Phillips et al., 2011b). In brief, sMRI preprocessing included (1) correction of field inhomogeneities (Sled and Pike, 1998); (2) removal of extracortical tissue using FSL's Brain Extraction Tool (BET; www.fmrib.ox.ac.uk/fsl/bet2/index.html) with manual correction of errors; (3) correction for head tilt and alignment using a 6-parameter rigid-body transformation (Woods et al., 1998a, 1998b); and (4) extraction of the cortical gray and WM boundaries using Freesurfer (http://surfer.nmr.mgh.harvard.edu) with manual correction of topographical errors. The Freesurfer-generated cortical white/gray matter surfaces were then resampled into triangular meshes, each with 65,536 vertices, and sulcal landmarks were delineated manually in both the hemispheres in each subject. After inspecting landmarks for reliability and anatomical accuracy, a recently refined cortical pattern matching-procedure that enables cortical surface mapping (Joshi et al., 2010b, 2012) via diffeomorphic alignments between landmarks was applied to spatially align the white/gray matter cortical surfaces across subjects. This method constructs a shape-based sulcal atlas for the entire population (Joshi et al., 2010a, 2012) that is (1) inverse-consistent, (2) dependent exclusively upon the geometry of the sulci devoid of nuisance variables such as pose and size, and (3) based on empirical observations to incorporate anatomically homologous mappings between sulci. The reconstructed sulcal shape atlas was then used to drive the cortical white/gray matter surfaces into spatial correspondence such that homologous regions have the same coordinate mappings without overall rescaling.
For DTI processing, the diffusion gradient table was corrected for slice prescription, and images were corrected for any residual eddy current distortions and motion artifacts using a combined nonlinear 2D registration (Jezzard et al., 1998) and a 3D rigid-body registration (Woods et al., 1998a, 1998b) to minimize interpolation. FSL's DTIFIT (www.fmrib.ox.ac.uk/fsl/fdt/fdt_dtifit.html) was used to obtain the FA/AD/RD images that were then registered to each subject's T1 data using 12-parameter and rigid-body transformations, employing the averaged b0 image for intermediate registration (Woods et al., 1998a, 1998b). The DTI images were then masked using the tissue-classified T1 data (Shattuck et al., 2001) where measurements of FA, AD, and RD were restricted to the brain WM only.
As detailed by Phillips et al. (2011b) and illustrated in the associated supplementary materials of this prior article, to allow cross-subject sampling of anatomically comparable SWM FA, AD, and RD measures, FA/AD/RD was averaged voxel-wise using a 10-mm smoothing kernel, determined to best estimate the SWM, centered at each of the 65,536 spatially matched white/gray matter cortical surface vertices while referencing the corresponding FA/AD/RD image. Since the FA/AD/RD images were masked using the tissue-classified T1 images thresholded to include WM, only values from the pericortical WM were sampled. Measures of SWM FA/AD/RD were, therefore, obtained at thousands of spatially matched points across the cortical WM/gray matter surface. SWM FA/AD/RD values were also averaged across the entire hemisphere and within lobar regions of interest (ROIs), and the corpus callosum as generated from the LPBA40 atlas (www.loni.ucla.edu/Atlases/LPBA40) (Shattuck et al., 2008). Thus, to examine the effects of age, sex, and asymmetry on the integrity of fibers within the SWM, FA/AD/RD was compared at both the vertex level to capture highly localized changes in structural connectivity as well as within the callosal, frontal, temporal, parietal, and occipital lobar regions to determine more pervasive SWM differences. Finally, to supplement the spatial interpretation of the vertex-based results, for descriptive purposes, SWM measures were averaged and plotted in smaller LPBA40 ROIs as described in the results below.
Statistical analysis
SWM FA/AD/RD values were averaged across each hemisphere and within the lobar ROIs to determine the main effects of sex and hemisphere and establish whether linear or nonlinear (quadratic and cubic) models better described age effects. DTI metrics were analyzed at a high spatial resolution across the WM/gray matter cortical boundary, where the General Linear Model implemented in R (www.r-project.org) was used to test for effects of age and sex at each cortical WM surface location, including both covariates and both linear and nonlinear terms in the statistical model. Paired t-tests were used to examine within-subject SWM asymmetries in all subjects (n=65) as well as within dextral subjects only (Laterality score >6, n=56) in post hoc analyses. Finally, two-way sex-by-hemisphere, age-by-hemisphere, and sex-by-age interactions were examined in follow-up analyses. Since the cortical pattern-matching algorithms spatially relate the surface WM/gray matter points across hemisphere within subjects as well as across subjects, to examine interactions with hemisphere, an asymmetry index (L−R)/0.5(L+R) was computed for FA, AD, and RD values at spatially corresponding hemispheric locations within the SWM as similar to the analysis strategies used previously to examine the cortical thickness asymmetries (Hamilton et al., 2007).
For the vertex-based analyses, permutation testing (Anderson and Legendre, 1999; Anderson and Ter Braak, 2003) was used to confirm the significance of effects made at thousands of spatially correlated SWM locations. This permutation method is an omnibus test that determines the total number of vertices exceeding a specified statistical threshold for a specific metric (e.g., FA) compared to the number of vertices exceeding this threshold by chance in random permutations. Thus, for permutation testing, the number of SWM points within the entire hemisphere and within each lobar ROI showing significant associations with age, sex, or hemisphere or their two-way interactions using the reduced model (i.e., permuting for the residuals by controlling for sex and age for the appropriate contrast) and a threshold of p<0.05 were compared to the number of significant surface points across each hemisphere or lobar ROI that occurred by chance when the residuals were randomly permuted in 10,000 new analyses. Covariates were not included for permutation testing of main effects of hemisphere, since these were within-subject analyses.
Results
SWM FA/AD/RD measures averaged across each hemisphere and within lobar ROIs did not deviate from normality (Kolmogorov–Smirnov tests all p>0.05). The mean SWM FA/AD/RD values measured at a high spatial density across the brain are shown in Figure 1 across all subjects. The mean values for each DTI metric averaged within each hemisphere and within lobar and callosal ROIs are provided in Table 2.
FIG. 1.
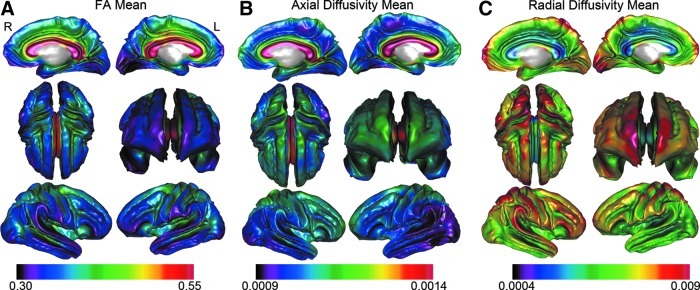
Mean (A) fractional anisotropy (FA), (B) axial diffusivity (AD), and (C) radial diffusivity (RD) measured at thousands of points within the superficial white matter (SWM) (Axia and RD=mm2/s).
Table 2.
Age, Sex, and Asymmetry Results for Fractional Anisotropy, Axial Diffusivity, and Radial Diffusivity for Hemispheres and Lobar Regions of Interest
| |
|
Age effects |
|
|
|
|
|||||
|---|---|---|---|---|---|---|---|---|---|---|---|
| |
DTI metric |
Linear |
Quadratic |
Cubic |
Sex effects |
Asymmetry effects |
|||||
| Region | FA mean | F | p | F | p | F | p | F | p | t | p |
| L Hemis | 0.371±0.010 | 25.60 | 0.001 | 13.15 | 0.001 | 9.34 | 0.001 | 0.57 | ns | 20.53 | 0.001 |
| R Hemis | 0.356±0.009 | 26.19 | 0.001 | 14.61 | 0.001 | 9.61 | 0.001 | 0.13 | ns | — | — |
| L Frontal | 0.381±0.012 | 29.23 | 0.001 | 14.74 | 0.001 | 10.17 | 0.001 | 0.27 | ns | 14.63 | 0.001 |
| R Frontal | 0.366±0.010 | 18.05 | 0.001 | 9.15 | 0.001 | 6.03 | 0.001 | 0.16 | ns | — | — |
| L Temporal | 0.363±0.012 | 17.87 | 0.001 | 9.09 | 0.001 | 6.98 | 0.001 | 4.71 | 0.03 | 15.85 | 0.001 |
| R Temporal | 0.343±0.012 | 15.11 | 0.001 | 9.47 | 0.001 | 6.27 | 0.001 | 0.12 | ns | — | — |
| L Parietal | 0.357±0.011 | 9.51 | 0.003 | 5.10 | 0.009 | 4.51 | 0.006 | 0.54 | ns | 14.87 | 0.001 |
| R Parietal | 0.339±0.009 | 9.90 | 0.003 | 7.78 | 0.001 | 5.31 | 0.003 | 0.55 | ns | — | — |
| L Occipital | 0.336±0.013 | 8.24 | 0.006 | 4.06 | 0.022 | 2.73 | 0.05 | 0.02 | ns | 4.44 | 0.001 |
| R Occipital | 0.328±0.012 | 22.28 | 0.001 | 12.49 | 0.001 | 8.19 | 0.001 | 0.00 | ns | — | — |
| L Callosum | 0.585±0.029 | 14.22 | 0.001 | 7.01 | 0.001 | 4.60 | 0.001 | 4.22 | ns | — | — |
| R Callosum | 0.568±0.027 | 8.69 | 0.001 | 4.28 | 0.001 | 2.81 | 0.001 | 2.45 | ns | — | — |
| Axial mean | F | p | F | p | F | p | F | p | t | p | |
|---|---|---|---|---|---|---|---|---|---|---|---|
| L Hemis | 1.08±0.04 | 41.41 | 0.001 | 29.20 | 0.001 | 19.17 | 0.001 | 1.00 | ns | −6.37 | 0.001 |
| R Hemis | 1.09±0.03 | 45.78 | 0.001 | 24.36 | 0.001 | 16.74 | 0.001 | 0.58 | ns | — | — |
| L Frontal | 1.08±0.04 | 35.53 | 0.001 | 24.51 | 0.001 | 16.46 | 0.001 | 0.01 | ns | −5.31 | 0.001 |
| R Frontal | 1.10±0.04 | 32.54 | 0.001 | 17.21 | 0.001 | 12.25 | 0.001 | 0.61 | ns | — | — |
| L Temporal | 1.05±0.03 | 17.16 | 0.001 | 24.88 | 0.001 | 16.43 | 0.001 | 0.19 | ns | −6.97 | 0.001 |
| R Temporal | 1.07±0.03 | 18.15 | 0.001 | 12.19 | 0.001 | 8.03 | 0.001 | 0.00 | ns | — | — |
| L Parietal | 1.04±0.06 | 38.70 | 0.001 | 20.07 | 0.001 | 13.49 | 0.001 | 0.16 | ns | −6.81 | 0.001 |
| R Parietal | 1.06±0.06 | 44.13 | 0.001 | 21.73 | 0.001 | 15.35 | 0.001 | 0.55 | ns | — | — |
| L Occipital | 1.03±0.05 | 21.46 | 0.001 | 17.36 | 0.001 | 11.88 | 0.001 | 0.66 | ns | −2.08 | 0.042 |
| R Occipital | 1.04±0.04 | 33.12 | 0.001 | 18.08 | 0.001 | 11.87 | 0.001 | 0.54 | ns | — | — |
| L Callosum | 1.50±0.07 | 3.79 | 0.001 | 8.36 | 0.001 | 5.49 | 0.001 | 0.01 | ns | — | — |
| R Callosum | 1.43±0.06 | 0.80 | 0.001 | 1.89 | 0.001 | 1.58 | 0.001 | 0.44 | ns | — | — |
| Radial mean | F | p | F | p | F | p | F | p | t | p | |
|---|---|---|---|---|---|---|---|---|---|---|---|
| L Hemis | 0.70±0.04 | 58.18 | 0.001 | 35.06 | 0.001 | 23.09 | 0.001 | 0.22 | ns | −10.90 | 0.001 |
| R Hemis | 0.73±0.03 | 59.83 | 0.001 | 31.65 | 0.001 | 21.35 | 0.001 | 0.13 | ns | — | — |
| L Frontal | 0.69±0.04 | 54.39 | 0.001 | 32.42 | 0.001 | 21.34 | 0.001 | 0.01 | ns | −11.42 | 0.001 |
| R Frontal | 0.73±0.04 | 37.93 | 0.001 | 19.78 | 0.001 | 13.36 | 0.001 | 0.02 | ns | — | — |
| L Temporal | 0.66±0.03 | 30.38 | 0.001 | 26.04 | 0.001 | 18.04 | 0.001 | 3.03 | ns | −12.92 | 0.001 |
| R Temporal | 0.71±0.03 | 35.70 | 0.001 | 21.97 | 0.001 | 14.47 | 0.001 | 0.00 | ns | — | — |
| L Parietal | 0.73±0.05 | 45.96 | 0.001 | 23.11 | 0.001 | 15.17 | 0.001 | 0.02 | ns | −9.09 | 0.001 |
| R Parietal | 0.77±0.05 | 47.22 | 0.001 | 23.33 | 0.001 | 16.62 | 0.001 | 0.22 | ns | — | — |
| L Occipital | 0.73±0.05 | 27.20 | 0.001 | 16.25 | 0.001 | 11.40 | 0.001 | 0.60 | ns | −3.76 | 0.001 |
| R Occipital | 0.74±0.04 | 45.83 | 0.001 | 26.06 | 0.001 | 17.10 | 0.001 | 0.15 | ns | — | — |
| L Callosum | 0.59±0.07 | 13.65 | 0.001 | 10.77 | 0.001 | 7.08 | 0.001 | 0.95 | ns | — | — |
| R Callosum | 0.59±0.06 | 10.17 | 0.002 | 6.25 | 0.003 | 4.11 | 0.01 | 2.48 | ns | — | — |
L, left; R, right; Hemis, hemisphere (AD/RD Mean units: 10−3 mm2/s); FA, fractional anisotropy; RD, radial diffusivity; AD, axial diffusivity; DTI, diffusion tensor imaging.
Age effects
Table 2 shows statistical results indicating highly significant effects of age for FA, RD, and AD for each hemisphere, all lobar ROIs, and the corpus callosum. Figure 2 shows FA, RD, and AD plotted by age for each region. The effects of age showed more-pronounced linear effects, although nonlinear effects were also significant in most regions. To allow further visualization of age trajectories, SWM FA was additionally averaged within 22 separate hemispheric LPBA40 ROIs and plotted by age as shown in Figure 3, where these plots are superimposed on the WM surface from a single subject. The list of atlas ROIs is provided in the figure legend.
FIG. 2.

Scatter plots showing changes in FA, RD, and AD averaged within the lobar regions of interest (ROIs) and the corpus callosum. Age is plotted on the x-axis (range: 18–74 years). Data points for the left and right hemisphere are mapped in red and blue. The curves in each graph represent quadratic line fits for the left (solid line) and right hemisphere (dotted line), respectively.
FIG. 3.

Scatter plots showing changes in SWM FA with age averaged within the LPBA40 ROIs. Age is plotted on the x-axis (range: 18–74 years), and FA is plotted on the y-axis. The y-axis is scaled to range of 0.25–0.50 for all ROIs with the exception of the corpus callosum, which is scaled to range 0.25–0.65. Anatomical locations for each graph represent (A) superior frontal, (B) middle frontal, (C) inferior frontal, (D) insular cortex, (E) precentral, (F) inferior temporal, (G) middle temporal, (H) superior temporal, (I) supramarginal, (J) postcentral, (K) angular, (L) superior parietal, (M) superior occipital, (N) middle occipital, (O) inferior occipital, (P) cuneus, (Q) lingual, (R) precuneus, (S) cingulate, (T) parahippocampal and (U) gyrus rectus atlas ROIs, and the (V) corpus callosum. Graphs are shown on a representative subject's white matter/gray matter cortical surface. Data points for the left and right hemisphere are mapped in red and blue. The curves in each graph represent quadratic line fits for the left (solid line) and right hemisphere (dotted line) respectively.
Statistical maps in Figure 4 show age effects for SWM FA, AD, and RD at a high spatial density where uncorrected probability values are indexed by the color bar. Although significant age-related reductions in SWM FA were observed in all four lobes when comparing averaged FA across lobar ROIs (Table 2), statistical maps indicate that age effects vary more regionally at the vertex level. Specifically, the effects of age were particularly prominent in the medial and dorsolateral frontal and prefrontal regions and the corpus callosum (p<0.05, uncorrected, indicated in blue; Fig. 4A) with respect to the posterior and more ventral pericortical WM regions. This pattern is also evident in the plots provided in Figure 3, where SWM FA has been averaged within 22 atlas ROIs to illustrate how age trajectories vary by region for FA. In these graphs, age-related reductions of FA are again seen as more prominent in prefrontal regions with respect to the temporal, posterior parietal, and occipital SWM regions. In the statistical maps, only a few isolated surface points showed greater FA in association with age (p<0.05, uncorrected, indicated in red/pink; Fig. 4A). Permutation-corrected p values shown in Table 3 confirm the effects of age within the left and right hemisphere and within each of the four lobes and the corpus callosum.
FIG. 4.

Probability maps showing the effects of age for SWM (A) FA, (B) AD, and (C) RD, controlling for sex mapped at a high-spatial resolution at thousands of homologous locations within the SWM. The direction of effects is indicated by the color bar. For (A), blue indicates decreased FA with age, and red indicates higher FA with age. For (B, C), blue indicates lower AD and RD with age, and red indicates higher AD and RD with age.
Table 3.
Permutation-Corrected Probability Values Within Hemispheres and Lobar Regions of Interest
| |
Age effects |
Sex effects |
Asymmetry effects |
||||||
|---|---|---|---|---|---|---|---|---|---|
| FA | AD | RD | FA | AD | RD | FA | AD | RD | |
| L Hemis | 0.001 | 0.00 | 0.001 | 0.22 | 0.26 | 0.06 | 0.001 | 0.001 | 0.001 |
| R Hemis | 0.001 | 0.00 | 0.001 | 0.71 | 0.96 | 0.90 | — | — | — |
| L Frontal | 0.001 | 0.00 | 0.001 | 0.34 | 0.53 | 0.16 | 0.001 | 0.001 | 0.001 |
| R Frontal | 0.001 | 0.00 | 0.001 | 0.96 | 0.98 | 0.97 | — | — | — |
| L Temporal | 0.03 | 0.00 | 0.001 | 0.68 | 0.22 | 0.20 | 0.001 | 0.001 | 0.001 |
| R Temporal | 0.01 | 0.00 | 0.001 | 0.61 | 0.90 | 0.96 | — | — | — |
| L Parietal | 0.02 | 0.00 | 0.001 | 0.05 | 0.22 | 0.01 | 0.001 | 0.001 | 0.001 |
| R Parietal | 0.001 | 0.00 | 0.001 | 0.26 | 0.43 | 0.22 | — | — | — |
| L Occipital | 0.05 | 0.001 | 0.001 | 0.65 | 0.20 | 0.46 | 0.001 | 0.001 | 0.001 |
| R Occipital | 0.001 | 0.001 | 0.001 | 0.44 | 0.30 | 0.17 | — | — | — |
| L Callosum | 0.001 | 0.04 | 0.001 | 0.04 | 1 | 0.19 | — | — | — |
| R Callosum | 0.001 | 0.13 | 0.001 | 0.12 | 0.63 | 0.41 | — | — | — |
Both SWM AD and RD (Fig. 4B, C) were shown to increase with age. The spatial patterns of effects were complementary to those observed for FA in the lateral and medial frontal and prefrontal regions. Further, for all DTI metrics, age effects were largely absent in the inferior temporal SWM regions. Despite these similarities, regional results observed for both AD and RD were more pronounced with respect to FA and inclusive of parietal association regions, perisylvian language/auditory regions, and primary and secondary visual regions (p<0.05, uncorrected, indicated in red/pink). Although the effects for AD and RD revealed similar patterns over much of the SWM, some regional differences were also observed. Specifically, only RD showed significant increases in the cingulate gyrus as well as the anterior and posterior callosum. AD effects, though not encompassing these regions, included a larger number of vertices overall. Only a few isolated surface points within the left temporal pole showed decreased SWM AD in association with age, whereas no region showed decreased RD with age (p<0.05, indicated in blue). Permutation-corrected p values shown in Table 3 confirm age effects within each hemisphere, the lobar ROIs, and the callosum.
Sex effects
Comparisons of FA, RD, and AD between men and women for each of the lobar regions and the corpus callosum are also provided in Table 2. Sex effects were absent for most regions with the exception of the left temporal ROI (p<0.04).
Statistical results showing sex effects for SWM FA, RD, and AD at a high spatial density are shown in Figure 5 where uncorrected probability values are indexed by the color bar. Significant focal increases of SWM FA in men occurred in regions, including the left superior temporal gyrus and in ventral and dorsal parietal pericortical WM (p<0.05 indicated in blue; Fig. 5A). Focal increases of FA in women were observed in a few spatially localized clusters, including in the posterior corpus callosum (p<0.05, indicated in red; Fig. 5A). Permutation-corrected p values shown in Table 3 confirm sex differences within the left parietal SWM (men>women) and posterior callosal regions (women>men).
FIG. 5.

Probability maps showing sex effects for SWM (A) FA, (B) AD, and (C) RD, after controlling for age mapped at a high spatial resolution at thousands of homologous locations within the SWM. The direction of effects are indicated by the color bar, where blue indicates higher FA, AD, or RD in men, and red indicates greater FA, AD, or RD in women.
Effects of sex for SWM AD, though present in some regionally distinct clusters (Fig. 5B), did not survive permutation testing (Table 3). However, comparisons between sexes for RD, which showed a relatively similar spatial pattern, were confirmed by permutation testing (Table 3) within the left parietal regions as compatible with uncorrected effects observed in distributed clusters within the left temporal and left perisylvian parietal regions in women (p<0.05, indicated in red; Fig. 5C).
Asymmetry effects
Significant leftward asymmetry effects were observed for SWM FA, AD, and RD averaged within hemispheres and within all lobar regions (Table 2). FA values for lobar and LPBA40 atlas ROIs are plotted for each hemisphere separately in Figures 2 and 3.
Statistical results showing SWM asymmetry effects mapped at a high spatial density within dextral subjects only (laterality index >6) are shown in Figure 6 where uncorrected probability values are indexed by the color bar. The same analysis run, including only nondextral subjects, revealed similar spatial effects (results not shown). Focal increases of left hemisphere SWM FA were seen over widely distributed regions, including temporal and parietal (encompassing perisylvian language regions) and frontal regions, incorporating the cingulate and medial orbital frontal SWM (p<0.05, indicated in red; Fig. 6A). Greater right hemisphere SWM FA was observed in the medial occipital SWM only (p<0.05, indicated in blue; Fig. 6A). Permutation-corrected p values shown in Table 3 confirmed regional asymmetry effects with lobar and hemisphere ROIs.
FIG. 6.

Probability maps showing asymmetry effects for SWM (A) FA, (B) AD, and (C) RD after controlling for age mapped at a high spatial resolution at thousands of homologous locations within the SWM. The direction of effects is indicated by the color bar. For (A), blue indicates higher FA in the right hemisphere, and red indicates higher FA in the left hemisphere. For (B, C), blue indicates higher AD and RD in the right hemisphere, and red indicates higher AD and RD in the left hemisphere.
Lateralization effects for AD and RD were observed in complementary spatial patterns. Significant focal increases in the right hemisphere AD and RD were seen over distributed regions, including the temporal lobe, parietal lobe, middle and superior frontal gyrus, as well as the lateral occipital lobe (p<0.05, indicated in blue; Fig. 6B, C) with only a few isolated surface points showing greater left hemisphere SWM AD (medial occipital pole, medial orbital frontal region) and RD (medial occipital pole and precuneus gyrus; p<0.05 indicated in red; Fig. 6B, C). Permutation-corrected p values shown in Table 3 confirm AD laterality for the hemispheres as a whole (right>left), within the frontal, temporal, parietal, and occipital lobes. Further, permutation p values confirmed RD laterality (right>left) within the frontal, temporal, parietal, and occipital lobes.
Interaction effects
Interactions between sex by hemisphere and age by hemisphere did not survive permutation testing at any SWM location for FA, RD, or AD (statistical maps not shown). These interactions also failed to produce significant findings for values averaged within lobar ROIs (all p>0.05). Similarly, sex-by-age interactions did not survive permutation correction when examined at each spatially matched SWM location for FA, RD, and AD. However, a significant sex-by-age interaction was observed for right hemisphere parietal SWM AD, F(1,64)=6.36, p=0.014, where men showed significantly larger increases in AD with age than women.
Discussion
This study sought to identify variations in the structural integrity of short-range association fibers sampled within the SWM at the juncture of the neuropil in association with age, sex, and hemispheric asymmetry. Several major findings emerged from study results: (1) Healthy adults show global reductions in SWM FA spanning all lobar regions. However, age effects vary at a more regional level and appear pronounced in the bilateral frontal and prefrontal SWM with respect to more posterior and ventral brain regions; (2) Age-related reductions in FA are accompanied by pervasive increases in both AD and RD, though callosal and cingulate SWM show greater RD without significant changes in AD; (3) Indices of SWM integrity vary between men and women in some discrete SWM regions; men exhibit higher FA in the left temporoparietal perisylvian regions, whereas women show greater FA in the posterior corpus callosum, which appear driven by local increases in RD; and (4) SWM FA shows a strong leftward bias across all lobar regions, though rightward asymmetries are present in the medial occipital SWM. Lateralized effects of AD and RD occur in similar spatial patterns across the SWM, though some regional FA asymmetries appear driven by RD changes exclusively.
Age effects
The SWM is comprised of short association fibers (or U-fibers) and neighborhood association fibers that connect proximal and more distal cortical gyri, respectively, and include some merging fibers from long fiber tracts (Parent and Carpenter, 1996; Oishi et al., 2008). In deep WM pathways, FA is shown to increase as the brain matures into young to mid-adulthood, indicating greater myelination and/or fiber coherence. In later life, FA is typically shown to decrease (Inano et al., 2011; Kochunov et al., 2009; Lebel et al., 2008, 2012, Malykhin et al., 2011; Michielse et al., 2010; Sullivan and Pfefferbaum, 2006; Tamnes et al., 2010). In line with previous studies examining deep WM pathways, results from this investigation showed decreases in FA in association with age across all lobar regions. However, age effects were also seen to vary at a more regional level. While frontal regions appeared more vulnerable to aging processes, occipital regions appeared comparatively less influenced by age (Fig. 4). These observations are compatible with prior reports suggesting that aging trajectories trend along an anterior–posterior gradient (Ardekani et al., 2007; Bhagat and Beaulieu, 2004; Head et al., 2004; Wu et al., 2011) with FA decreasing more prematurely in the frontal regions that mature later in life (Sullivan and Pfefferbaum, 2006).
Age-related reductions in SWM FA occurred in tandem with greater RD and AD. However, age-related variations in AD and RD appeared more pronounced than those observed for FA. Differences in the spatial pattern of findings also suggested regional differences in the rates or processes affecting SWM tissue properties. In particular, the callosal and cingulate SWM showed age-related increases in RD, without changes in AD. Lateral prefrontal regions showed reduced FA together with both increases in both AD and RD. Although the biological determinants of these diffusion parameters are not yet fully understood, since RD increases have been linked to demyelination (Concha et al., 2006; Ou et al., 2009; Schmierer et al., 2008), age-related reductions in myelination and/or in remyelination, rather than axonal loss, may account for corpus callosum and cingulum findings. Mechanisms additionally influencing the number and coherence of WM fibers may account for the effects of AD across overlapping brain regions and in lateral frontal and prefrontal association regions exclusively (Konrad and Winterer, 2008) and/or be explained by changes in axonal packing as previously suggested (Suarez-Sola et al., 2009; Sullivan et al., 2010).
These observations may also be supported by evidence suggesting that thinner axons, like the ones found in the SWM, may be more susceptible to degeneration with age compared to relatively larger axons (Marner et al., 2003; Tang et al., 1997) as are found deep WM pathways. Greater AD with age may be thus lead to greater fiber organization (Hasan et al., 2007) with a reduction of unnecessary/unused pathways accounting for more-prominent regional AD effects. At the same time, this refined structural organization may occur at the expense of reduced brain plasticity (Hasan et al., 2007). However, greater AD may also reflect axonal degeneration or a decreased number of neurofilaments and microtubules within the myelinated axons (Kinoshita et al., 1999). Since short-association and neighborhood fibers make extensive connections beneath the cortex to integrate functionally connected cortical regions, the pattern of SWM changes may reflect the widely documented and time-varying changes in selective cognitive and sensory and motor functions during normal aging (Bendlin et al., 2010; Birren et al., 2006; Craik and Salthouse, 2007; Sullivan et al., 2010).
Although SWM effects of age for FA, RD, and AD showed a more-prominent linear than nonlinear pattern, these results likely reflect the age range of the adult sample investigated. That is, since developmental increases in FA and decreases in RD are shown to plateau or level out during mid-adulthood before declining and increasing, respectively, during normal aging (Lebel et al., 2008; Marner et al., 2003; Tamnes et al., 2010; Westlye et al., 2010), it is perhaps not surprising that age-related changes in SWM FA and RD were better described by linear effects in the current study, though nonlinear effects were also significant in many regions (Fig. 3). Thus, in spite of regional variations, aging effects in the SWM appear to largely mirror those observed in the deep WM. Although age effects for AD are less consistently reported, our findings are in line with the findings showing that decreases in AD occur during normal brain development into early adulthood and are followed by subsequent increases during normal aging (Faria et al., 2010; Lebel et al., 2012), though AD effects appear more pronounced in the SWM.
Sex effects
Although significant sex differences were not apparent across much of the brain, microstructural characteristics of the SWM were shown to vary between men and women in the posterior callosum and in left temporoparietal regions. Women showed significantly higher FA in the posterior corpus callosum (splenium), noting that the callosum is comprised of commissural fibers rather than short-range fibers. This effect appeared attributable to changes in RD (Fig. 5C) and might suggest that myelination is greater in women in the callosal regions largely involved in the interhemispheric transfer of visual information (Zaidel and Iacoboni, 2003). At least one study has reported greater FA in the splenium in females (Oh et al., 2007), though others have observed higher splenial FA in males (Inano et al., 2011) or shown greater FA for males in the genu of the callosum (Liu et al., 2010; Westerhausen et al., 2011). Within the SWM, males showed significantly higher FA in the left superior temoporoparietal regions (Fig. 5A) that may relate to advantages, in particular cognitive processes (Menzler et al., 2011; Schmidt et al., 2000).
Asymmetry
All study participants, including the 9 non-dextrals, showed higher mean FA within the left compared to the right hemisphere (mean difference=0.014±0.005). The regional scatter plots in Figures 2 and 3 and statistical maps in Figure 6 revealed left-hemisphere FA effects to encompass large areas of the SWM, which were particularly prominent in the superior temporal and inferior parietal regions, including Brodmann's area 22 and Wernicke's area, known to be involved in language processing (Geschwind, 1970). Statistical maps for AD and RD showed complementary rightward effects across much of the SWM (Fig. 6) possibly suggesting higher left hemisphere axonal density and greater myelination as implicated in animal studies (Dong et al., 2004; Song et al., 2003; Takahashi et al., 2002), respectively. In pericortical WM, results similar to ours were found where right-handed subjects showed higher FA, particularly in left temporal regions (Kang et al., 2011). Postmortem studies offer supporting evidence of left hemisphere dominance with regard to WM structural integrity, as axons were shown to be larger and more myelinated in the left temporal lobes (Anderson et al., 1999). However, our study also showed some right lateralized effects. Specifically, FA was higher in the right medial occipital lobe (parieto-occipital and calcarine regions). Although leftward asymmetries are typically reported, a few previous studies have found evidence of right lateralization in the deep WM, including within the frontal (Jahanshad et al., 2010), parietal, and occipital lobes (Iwabuchi et al., 2011). Further, two previous functional studies have suggested a rightward laterality in the occipital lobe (Large et al., 2007; Liu et al., 2009). These asymmetries like other hemisphere-specific differences in the brain's functional layout, cytoarchitecture, and neurochemistry may relate to lateralized behavioral traits, including language, auditory perception, motor preferences, sensory acuity, and handedness (Toga and Thompson, 2003). For example, DTI studies of deep WM tracts connecting cortical regions involved in language (arcuate fasciculus and superior longitudinal fasciculus) (Catani et al., 2007; Glasser and Rilling, 2008; Lebel and Beaulieu, 2009; Phillips et al., 2011a) are shown to relate to verbal recall in adults (Catani et al., 2007) and to some cognitive abilities in children (Lebel and Beaulieu, 2009).
Although behavioral and brain activation studies as well as a recent connectivity analysis, including both functional imaging and DTI data, have shown a hemispheric asymmetry reduction in older adults, a phenomenon termed AROLD (Cabeza, 2002; Li et al., 2009), significant age-by-asymmetry effects were not observed for SWM integrity measures in the current study. However, others have shown that asymmetries in gray matter structure do not differ in association with normal aging (Smeets et al., 2010), which appears may also be the case for tissue properties of the SWM.
Limitations and future directions
Some potential study limitations are worth noting. First, the age range of study participants (18–74 years) prohibited the examination of developmental changes in SWM integrity, which may be addressed in future studies, particularly those benefiting from more-powerful longitudinal designs. Further, although age was included as a covariate for analyses of sex effects, differences in the age distributions in the male and female groups may have impacted the observed findings. Some caution with regard to the interpretation of diffusion findings is also advised, particularly for AD and RD, which may also vary as a consequence of crossing fibers, partial volume effects, or pathology rather than on the basis of the underlying tissue structure (Wheeler-Kingshott and Cercignani, 2009). Moreover, findings observed with respect to adult aging may be more susceptible to methodological confounds associated with separating the microstructural from volumetric change in the gray matter and CSF during brain aging. To reduce the influence of this potential confound, in particular those associated with partial volume effects associated with age (Bhagat and Beaulieu, 2004; Metzler-Baddeley et al., 2012; Pasternak et al., 2009), the current study only sampled FA, RD, and AD within brain tissue defined as WM in the sMRI data (Shattuck et al., 2001). However, tissue segmentation itself, which relies on the thresholding signal intensity values for the purpose of classifying brain tissue types, may also be impacted by microstructural changes in the cortical neuropil occurring with age, which could influence the interpretation of the results. Future studies, including more specialized acquisition methods and higher angular and spatial resolution DTI data, may help reduce these potential confounds to better define the fiber trajectories within the SWM. Finally, future studies are required to clarify the regional specificity of SWM changes with respect to other brain structural characteristics such as cortical thickness as well as associations with specific behavioral functions in the context of age, sex, and cerebral asymmetry.
Conclusion
This study provides new evidence to demonstrate that global and regional variations in the SWM microstructure associate with individual differences in age and sex during adulthood as well as differ across hemisphere. Results support that the SWM may be vulnerable to age-related processes of demyelination. It is also possible that the SWM may become more organized with age, though increases in AD with age may instead reflect microstructural changes reflecting axonal degeneration (Kinoshita et al., 1999). Further, our findings, though cross-sectional, suggest that aging effects impact frontal regions more substantially than posterior and ventral brain regions. SWM structural connectivity shows a leftward bias across most of the brain, including within the frontal, temporal, and parietal lobes. Sex differences appear more spatially distinct, implicating differences in posterior callosal and temporoparietal regions.
Acknowledgments
Funding for this work was provided by the Human Brain Project (Grants P20-MHDA52176 and 5P01-EB001955), the National Institutes of Health (NIH)/National Center for Research Resources (NCRR; Grants P41 RR013642, RR12169 and RR00865), as well as by Award Number R01 MH092301 from the National Institute of Mental Health (NIMH; to K.L.N.) and Award Number K99HD065832 from the Eunice Kennedy Shriver National Institute of Child Health & Human Development (NICHD; to K.A.C.). The content is solely the responsibility of the authors and does not necessarily represent the official views of the NCRR, NICHD, NIHM, or NIH. For generous support, the authors also wish to thank the Brain Mapping Medical Research Organization, Brain Mapping Support Foundation, Pierson-Lovelace Foundation, Ahmanson Foundation, William M. and Linda R. Dietel Philanthropic Fund at the Northern Piedmont Community Foundation, Tamkin Foundation, Jennifer Jones-Simon Foundation, Capital Group Companies Charitable Foundation, and Robson Family and Northstar Fund.
Author Disclosure Statement
No competing financial interests exist.
References
- Anderson B. Southern BD. Powers RE. Anatomic asymmetries of the posterior superior temporal lobes: a postmortem study. Neuropsychiatry Neuropsychol Behav Neurol. 1999;12:247–254. [PubMed] [Google Scholar]
- Anderson MJ. Legendre P. An empirical comparison of permutation methods for tests of partial regression coefficients in a linear model. J Stat Comput Sim. 1999;62:271–303. [Google Scholar]
- Anderson MJ. Ter Braak CJF. Permutation tests for multi-factorial analysis of variance. J Stat Comput Sim. 2003;73:85–113. [Google Scholar]
- Ardekani S. Kumar A. Bartzokis G. Sinha U. Exploratory voxel-based analysis of diffusion indices and hemispheric asymmetry in normal aging. Magn Reson Imaging. 2007;25:154–167. doi: 10.1016/j.mri.2006.09.045. [DOI] [PubMed] [Google Scholar]
- Barnea-Goraly N. Menon V. Eckert M. Tamm L. Bammer R. Karchemskiy A, et al. White matter development during childhood and adolescence: a cross-sectional diffusion tensor imaging study. Cereb Cortex. 2005;15:1848–1854. doi: 10.1093/cercor/bhi062. [DOI] [PubMed] [Google Scholar]
- Basser PJ. Pierpaoli C. Microstructural and physiological features of tissues elucidated by quantitative-diffusion-tensor MRI. J Magn Reson B. 1996;111:209–219. doi: 10.1006/jmrb.1996.0086. [DOI] [PubMed] [Google Scholar]
- Bava S. Boucquey V. Goldenberg D. Thayer RE. Ward M. Jacobus J, et al. Sex differences in adolescent white matter architecture. Brain Res. 2011;1375:41–48. doi: 10.1016/j.brainres.2010.12.051. [DOI] [PMC free article] [PubMed] [Google Scholar]
- Bendlin BB. Fitzgerald ME. Ries ML. Xu G. Kastman EK. Thiel BW, et al. White matter in aging and cognition: a cross-sectional study of microstructure in adults aged eighteen to eighty-three. Dev Neuropsychol. 2010;35:257–277. doi: 10.1080/87565641003696775. [DOI] [PMC free article] [PubMed] [Google Scholar]
- Bennett IJ. Madden DJ. Vaidya CJ. Howard DV. Howard JH., Jr. Age-related differences in multiple measures of white matter integrity: a diffusion tensor imaging study of healthy aging. Hum Brain Mapp. 2010;31:378–390. doi: 10.1002/hbm.20872. [DOI] [PMC free article] [PubMed] [Google Scholar]
- Bhagat YA. Beaulieu C. Diffusion anisotropy in subcortical white matter and cortical gray matter: changes with aging and the role of CSF-suppression. J Magn Reson Imaging. 2004;20:216–227. doi: 10.1002/jmri.20102. [DOI] [PubMed] [Google Scholar]
- Birren JE. Schaie KW. Abeles RP. Gatz M. Salthouse TA. Handbook of the Psychology of Aging. 6th. Amsterdam; Boston: Elsevier Academic Press; 2006. [Google Scholar]
- Burzynska AZ. Preuschhof C. Backman L. Nyberg L. Li SC. Lindenberger U, et al. Age-related differences in white matter microstructure: region-specific patterns of diffusivity. Neuroimage. 2010;49:2104–2112. doi: 10.1016/j.neuroimage.2009.09.041. [DOI] [PubMed] [Google Scholar]
- Cabeza R. Hemispheric asymmetry reduction in older adults: the HAROLD model. Psychol Aging. 2002;17:85–100. doi: 10.1037//0882-7974.17.1.85. [DOI] [PubMed] [Google Scholar]
- Catani M. Allin MP. Husain M. Pugliese L. Mesulam MM. Murray RM, et al. Symmetries in human brain language pathways correlate with verbal recall. Proc Natl Acad Sci U S A. 2007;104:17163–17168. doi: 10.1073/pnas.0702116104. [DOI] [PMC free article] [PubMed] [Google Scholar]
- Concha L. Gross DW. Wheatley BM. Beaulieu C. Diffusion tensor imaging of time-dependent axonal and myelin degradation after corpus callosotomy in epilepsy patients. Neuroimage. 2006;32:1090–1099. doi: 10.1016/j.neuroimage.2006.04.187. [DOI] [PubMed] [Google Scholar]
- Craik FIM. Salthouse TA. The Handbook of Aging and Cognition. 3rd. New York: Psychology Press; 2007. [Google Scholar]
- Davis SW. Dennis NA. Buchler NG. White LE. Madden DJ. Cabeza R. Assessing the effects of age on long white matter tracts using diffusion tensor tractography. Neuroimage. 2009;46:530–541. doi: 10.1016/j.neuroimage.2009.01.068. [DOI] [PMC free article] [PubMed] [Google Scholar]
- Defelipe J. Fields RD. Hof PR. Hoistad M. Kostovic I. Meyer G, et al. Cortical white matter: beyond the pale remarks, main conclusions and discussion. Front Neuroanat. 2010;4:4. doi: 10.3389/neuro.05.004.2010. [DOI] [PMC free article] [PubMed] [Google Scholar]
- Dong Q. Welsh RC. Chenevert TL. Carlos RC. Maly-Sundgren P. Gomez-Hassan DM, et al. Clinical applications of diffusion tensor imaging. J Magn Reson Imaging. 2004;19:6–18. doi: 10.1002/jmri.10424. [DOI] [PubMed] [Google Scholar]
- Faria AV. Zhang J. Oishi K. Li X. Jiang H. Akhter K, et al. Atlas-based analysis of neurodevelopment from infancy to adulthood using diffusion tensor imaging and applications for automated abnormality detection. Neuroimage. 2010;52:415–428. doi: 10.1016/j.neuroimage.2010.04.238. [DOI] [PMC free article] [PubMed] [Google Scholar]
- Fornari E. Maeder P. Meuli R. Ghika J. Knyazeva MG. Demyelination of superficial white matter in early Alzheimer's disease: a magnetization transfer imaging study. Neurobiol Aging. 2010;33:428.e7–428.e19. doi: 10.1016/j.neurobiolaging.2010.11.014. [DOI] [PubMed] [Google Scholar]
- Galaburda AM. LeMay M. Kemper TL. Geschwind N. Right-left asymmetrics in the brain. Science. 1978;199:852–856. doi: 10.1126/science.341314. [DOI] [PubMed] [Google Scholar]
- Geschwind N. The organization of language and the brain. Science. 1970;170:940–944. doi: 10.1126/science.170.3961.940. [DOI] [PubMed] [Google Scholar]
- Glasser MF. Rilling JK. DTI tractography of the human brain's language pathways. Cereb Cortex. 2008;18:2471–2482. doi: 10.1093/cercor/bhn011. [DOI] [PubMed] [Google Scholar]
- Gong G. He Y. Evans AC. Brain connectivity: gender makes a difference. Neuroscientist. 2011;17:575–591. doi: 10.1177/1073858410386492. [DOI] [PubMed] [Google Scholar]
- Good CD. Johnsrude I. Ashburner J. Henson RN. Friston KJ. Frackowiak RS. Cerebral asymmetry and the effects of sex and handedness on brain structure: a voxel-based morphometric analysis of 465 normal adult human brains. Neuroimage. 2001;14:685–700. doi: 10.1006/nimg.2001.0857. [DOI] [PubMed] [Google Scholar]
- Hamilton LS. Narr KL. Luders E. Szeszko PR. Thompson PM. Bilder RM, et al. Asymmetries of cortical thickness: effects of handedness, sex, and schizophrenia. Neuroreport. 2007;18:1427–1431. doi: 10.1097/WNR.0b013e3282e9a5a2. [DOI] [PMC free article] [PubMed] [Google Scholar]
- Hasan KM. Halphen C. Sankar A. Eluvathingal TJ. Kramer L. Stuebing KK, et al. Diffusion tensor imaging-based tissue segmentation: validation and application to the developing child and adolescent brain. Neuroimage. 2007;34:1497–1505. doi: 10.1016/j.neuroimage.2006.10.029. [DOI] [PMC free article] [PubMed] [Google Scholar]
- Hasan KM. Iftikhar A. Kamali A. Kramer LA. Ashtari M. Cirino PT, et al. Development and aging of the healthy human brain uncinate fasciculus across the lifespan using diffusion tensor tractography. Brain Res. 2009;1276:67–76. doi: 10.1016/j.brainres.2009.04.025. [DOI] [PMC free article] [PubMed] [Google Scholar]
- Head D. Buckner RL. Shimony JS. Williams LE. Akbudak E. Conturo TE, et al. Differential vulnerability of anterior white matter in nondemented aging with minimal acceleration in dementia of the Alzheimer type: evidence from diffusion tensor imaging. Cereb Cortex. 2004;14:410–423. doi: 10.1093/cercor/bhh003. [DOI] [PubMed] [Google Scholar]
- Hedman AM. van Haren NE. Schnack HG. Kahn RS. Hulshoff Pol HE. Human brain changes across the life span: a review of 56 longitudinal magnetic resonance imaging studies. Hum Brain Mapp. 2011;33:1987–2002. doi: 10.1002/hbm.21334. [DOI] [PMC free article] [PubMed] [Google Scholar]
- Hsu JL. Leemans A. Bai CH. Lee CH. Tsai YF. Chiu HC, et al. Gender differences and age-related white matter changes of the human brain: a diffusion tensor imaging study. Neuroimage. 2008;39:566–577. doi: 10.1016/j.neuroimage.2007.09.017. [DOI] [PubMed] [Google Scholar]
- Inano S. Takao H. Hayashi N. Abe O. Ohtomo K. Effects of age and gender on white matter integrity. AJNR. Am J Neuroradiol. 2011;32:2103–2109. doi: 10.3174/ajnr.A2785. [DOI] [PMC free article] [PubMed] [Google Scholar]
- Iwabuchi SJ. Haberling IS. Badzakova-Trajkov G. Patston LL. Waldie KE. Tippett LJ, et al. Regional differences in cerebral asymmetries of human cortical white matter. Neuropsychologia. 2011;49:3599–3604. doi: 10.1016/j.neuropsychologia.2011.09.011. [DOI] [PubMed] [Google Scholar]
- Jahanshad N. Lee AD. Barysheva M. McMahon KL. de Zubicaray GI. Martin NG, et al. Genetic influences on brain asymmetry: a DTI study of 374 twins and siblings. Neuroimage. 2010;52:455–469. doi: 10.1016/j.neuroimage.2010.04.236. [DOI] [PMC free article] [PubMed] [Google Scholar]
- Jezzard P. Barnett AS. Pierpaoli C. Characterization of and correction for eddy current artifacts in echo planar diffusion imaging. Magn Reson Med. 1998;39:801–812. doi: 10.1002/mrm.1910390518. [DOI] [PubMed] [Google Scholar]
- Joshi SH. Cabeen RP. Joshi AA. Sun B. Dinov I. Narr KL, et al. Diffeomorphic sulcal shape analysis on the cortex. IEEE Transact Med Imaging. 2012;31:1195–1212. doi: 10.1109/TMI.2012.2186975. [DOI] [PMC free article] [PubMed] [Google Scholar]
- Joshi SH. Cabeen RP. Joshi AA. Woods RP. Narr KL. Toga AW. Diffeomorphic sulcal shape analysis for cortical surface registration. Proc IEEE Comput Soc Conf Comput Vis Pattern Recognit; Jun 13–18; 2010a. pp. 475–482. [DOI] [PMC free article] [PubMed] [Google Scholar]
- Joshi SH. Cabeen RP. Sun B. Joshi AA. Gutman B. Zamanyan A, et al. Cortical sulcal atlas construction using a diffeomorphic mapping approach. Med Image Comput Comput Assist Interv. 2010b;13:357–366. doi: 10.1007/978-3-642-15705-9_44. [DOI] [PMC free article] [PubMed] [Google Scholar]
- Kanaan RA. Allin M. Picchioni M. Barker GJ. Daly E. Shergill SS, et al. Gender differences in white matter microstructure. PloS One. 2012;7:e38272. doi: 10.1371/journal.pone.0038272. [DOI] [PMC free article] [PubMed] [Google Scholar]
- Kang X. Herron TJ. Turken AU. Woods DL. Diffusion properties of cortical and pericortical tissue: regional variations, reliability and methodological issues. Magn Reson Imaging. 2012;30:1111–1122. doi: 10.1016/j.mri.2012.04.004. [DOI] [PubMed] [Google Scholar]
- Kang X. Herron TJ. Woods DL. Regional variation, hemispheric asymmetries and gender differences in pericortical white matter. Neuroimage. 2011;56:2011–2023. doi: 10.1016/j.neuroimage.2011.03.016. [DOI] [PubMed] [Google Scholar]
- Kennedy KM. Raz N. Aging white matter and cognition: differential effects of regional variations in diffusion properties on memory, executive functions, and speed. Neuropsychologia. 2009;47:916–927. doi: 10.1016/j.neuropsychologia.2009.01.001. [DOI] [PMC free article] [PubMed] [Google Scholar]
- Kinoshita Y. Ohnishi A. Kohshi K. Yokota A. Apparent diffusion coefficient on rat brain and nerves intoxicated with methylmercury. Environ Res. 1999;80:348–354. doi: 10.1006/enrs.1998.3935. [DOI] [PubMed] [Google Scholar]
- Kochunov P. Glahn DC. Lancaster J. Thompson PM. Kochunov V. Rogers B, et al. Fractional anisotropy of cerebral white matter and thickness of cortical gray matter across the lifespan. Neuroimage. 2011;58:41–49. doi: 10.1016/j.neuroimage.2011.05.050. [DOI] [PMC free article] [PubMed] [Google Scholar]
- Kochunov P. Ramage AE. Lancaster JL. Robin DA. Narayana S. Coyle T, et al. Loss of cerebral white matter structural integrity tracks the gray matter metabolic decline in normal aging. Neuroimage. 2009;45:17–28. doi: 10.1016/j.neuroimage.2008.11.010. [DOI] [PMC free article] [PubMed] [Google Scholar]
- Konrad A. Winterer G. Disturbed structural connectivity in schizophrenia primary factor in pathology or epiphenomenon? Schizophr Bull. 2008;34:72–92. doi: 10.1093/schbul/sbm034. [DOI] [PMC free article] [PubMed] [Google Scholar]
- Large ME. Aldcroft A. Vilis T. Task-related laterality effects in the lateral occipital complex. Brain Res. 2007;1128:130–138. doi: 10.1016/j.brainres.2006.10.023. [DOI] [PubMed] [Google Scholar]
- Lebel C. Beaulieu C. Lateralization of the arcuate fasciculus from childhood to adulthood and its relation to cognitive abilities in children. Hum Brain Mapp. 2009;30:3563–3573. doi: 10.1002/hbm.20779. [DOI] [PMC free article] [PubMed] [Google Scholar]
- Lebel C. Gee M. Camicioli R. Wieler M. Martin W. Beaulieu C. Diffusion tensor imaging of white matter tract evolution over the lifespan. Neuroimage. 2012;60:340–352. doi: 10.1016/j.neuroimage.2011.11.094. [DOI] [PubMed] [Google Scholar]
- Lebel C. Walker L. Leemans A. Phillips L. Beaulieu C. Microstructural maturation of the human brain from childhood to adulthood. Neuroimage. 2008;40:1044–1055. doi: 10.1016/j.neuroimage.2007.12.053. [DOI] [PubMed] [Google Scholar]
- Li Z. Moore AB. Tyner C. Hu X. Asymmetric connectivity reduction and its relationship to “HAROLD” in aging brain. Brain Res. 2009;1295:149–158. doi: 10.1016/j.brainres.2009.08.004. [DOI] [PMC free article] [PubMed] [Google Scholar]
- Liu F. Vidarsson L. Winter JD. Tran H. Kassner A. Sex differences in the human corpus callosum microstructure: a combined T2 myelin-water and diffusion tensor magnetic resonance imaging study. Brain Res. 2010;1343:37–45. doi: 10.1016/j.brainres.2010.04.064. [DOI] [PubMed] [Google Scholar]
- Liu H. Stufflebeam SM. Sepulcre J. Hedden T. Buckner RL. Evidence from intrinsic activity that asymmetry of the human brain is controlled by multiple factors. Proc Natl Acad Sci U S A. 2009;106:20499–20503. doi: 10.1073/pnas.0908073106. [DOI] [PMC free article] [PubMed] [Google Scholar]
- Lu LH. Dapretto M. O'Hare ED. Kan E. McCourt ST. Thompson PM, et al. Relationships between brain activation and brain structure in normally developing children. Cereb Cortex. 2009;19:2595–2604. doi: 10.1093/cercor/bhp011. [DOI] [PMC free article] [PubMed] [Google Scholar]
- Luders E. Toga AW. Sex differences in brain anatomy. Prog Brain Res. 2010;186:3–12. doi: 10.1016/B978-0-444-53630-3.00001-4. [DOI] [PubMed] [Google Scholar]
- Malykhin N. Vahidy S. Michielse S. Coupland N. Camicioli R. Seres P, et al. Structural organization of the prefrontal white matter pathways in the adult and aging brain measured by diffusion tensor imaging. Brain Struct Funct. 2011;216:417–431. doi: 10.1007/s00429-011-0321-1. [DOI] [PubMed] [Google Scholar]
- Marner L. Nyengaard JR. Tang Y. Pakkenberg B. Marked loss of myelinated nerve fibers in the human brain with age. J Comp Neurol. 2003;462:144–152. doi: 10.1002/cne.10714. [DOI] [PubMed] [Google Scholar]
- Mazziotta JC. Woods R. Iacoboni M. Sicotte N. Yaden K. Tran M, et al. The myth of the normal, average human brain—the ICBM experience: (1) subject screening and eligibility. Neuroimage. 2009;44:914–922. doi: 10.1016/j.neuroimage.2008.07.062. [DOI] [PMC free article] [PubMed] [Google Scholar]
- Menzler K. Belke M. Wehrmann E. Krakow K. Lengler U. Jansen A, et al. Men and women are different: diffusion tensor imaging reveals sexual dimorphism in the microstructure of the thalamus, corpus callosum and cingulum. Neuroimage. 2011;54:2557–2562. doi: 10.1016/j.neuroimage.2010.11.029. [DOI] [PubMed] [Google Scholar]
- Metzler-Baddeley C. O'Sullivan MJ. Bells S. Pasternak O. Jones DK. How and how not to correct for CSF-contamination in diffusion MRI. Neuroimage. 2012;59:1394–1403. doi: 10.1016/j.neuroimage.2011.08.043. [DOI] [PubMed] [Google Scholar]
- Michielse S. Coupland N. Camicioli R. Carter R. Seres P. Sabino J, et al. Selective effects of aging on brain white matter microstructure: a diffusion tensor imaging tractography study. Neuroimage. 2010;52:1190–1201. doi: 10.1016/j.neuroimage.2010.05.019. [DOI] [PubMed] [Google Scholar]
- Oh JS. Song IC. Lee JS. Kang H. Park KS. Kang E, et al. Tractography-guided statistics (TGIS) in diffusion tensor imaging for the detection of gender difference of fiber integrity in the midsagittal and parasagittal corpora callosa. Neuroimage. 2007;36:606–616. doi: 10.1016/j.neuroimage.2007.03.020. [DOI] [PubMed] [Google Scholar]
- Oishi K. Faria A. Jiang H. Li X. Akhter K. Zhang J, et al. Atlas-based whole brain white matter analysis using large deformation diffeomorphic metric mapping: application to normal elderly and Alzheimer's disease participants. Neuroimage. 2009;46:486–499. doi: 10.1016/j.neuroimage.2009.01.002. [DOI] [PMC free article] [PubMed] [Google Scholar]
- Oishi K. Zilles K. Amunts K. Faria A. Jiang H. Li X, et al. Human brain white matter atlas: identification and assignment of common anatomical structures in superficial white matter. Neuroimage. 2008;43:447–457. doi: 10.1016/j.neuroimage.2008.07.009. [DOI] [PMC free article] [PubMed] [Google Scholar]
- Oldfield RC. The assessment and analysis of handedness: the Edinburgh inventory. Neuropsychologia. 1971;9:97–113. doi: 10.1016/0028-3932(71)90067-4. [DOI] [PubMed] [Google Scholar]
- Ou X. Sun SW. Liang HF. Song SK. Gochberg DF. The MT pool size ratio and the DTI radial diffusivity may reflect the myelination in shiverer and control mice. NMR Biomed. 2009;22:480–487. doi: 10.1002/nbm.1358. [DOI] [PMC free article] [PubMed] [Google Scholar]
- Parazzini C. Baldoli C. Scotti G. Triulzi F. Terminal zones of myelination: MR evaluation of children aged 20–40 months. Am J Neuroradiol. 2002;23:1669–1673. [PMC free article] [PubMed] [Google Scholar]
- Parent A. Carpenter MB. Carpenter's human neuroanatomy. 9th. Baltimore: Williams & Wilkins; 1996. [Google Scholar]
- Pasternak O. Sochen N. Gur Y. Intrator N. Assaf Y. Free water elimination and mapping from diffusion MRI. Magn Reson Med. 2009;62:717–730. doi: 10.1002/mrm.22055. [DOI] [PubMed] [Google Scholar]
- Phillips OR. Clark KA. Woods RP. Subotnik KL. Asarnow RF. Nuechterlein KH, et al. Topographical relationships between arcuate fasciculus connectivity and cortical thickness. Hum Brain Mapp. 2011a;32:1788–1801. doi: 10.1002/hbm.21147. [DOI] [PMC free article] [PubMed] [Google Scholar]
- Phillips OR. Nuechterlein KH. Asarnow RF. Clark KA. Cabeen R. Yang Y, et al. Mapping corticocortical structural integrity in schizophrenia and effects of genetic liability. Biol Psychiatry. 2011b;70:680–689. doi: 10.1016/j.biopsych.2011.03.039. [DOI] [PMC free article] [PubMed] [Google Scholar]
- Rasser PE. Schall U. Todd J. Michie PT. Ward PB. Johnston P, et al. Gray matter deficits, mismatch negativity, and outcomes in schizophrenia. Schizophr Bull. 2009;37:131–140. doi: 10.1093/schbul/sbp060. [DOI] [PMC free article] [PubMed] [Google Scholar]
- Reese TG. Heid O. Weisskoff RM. Wedeen VJ. Reduction of eddy-current-induced distortion in diffusion MRI using a twice-refocused spin echo. Magn Reson Med. 2003;49:177–182. doi: 10.1002/mrm.10308. [DOI] [PubMed] [Google Scholar]
- Schmidt SL. Oliveira RM. Krahe TE. Filgueiras CC. The effects of hand preference and gender on finger tapping performance asymmetry by the use of an infra-red light measurement device. Neuropsychologia. 2000;38:529–534. doi: 10.1016/s0028-3932(99)00120-7. [DOI] [PubMed] [Google Scholar]
- Schmierer K. Wheeler-Kingshott CA. Tozer DJ. Boulby PA. Parkes HG. Yousry TA, et al. Quantitative magnetic resonance of postmortem multiple sclerosis brain before and after fixation. Magn Reson Med. 2008;59:268–277. doi: 10.1002/mrm.21487. [DOI] [PMC free article] [PubMed] [Google Scholar]
- Shattuck DW. Mirza M. Adisetiyo V. Hojatkashani C. Salamon G. Narr KL, et al. Construction of a 3D probabilistic atlas of human cortical structures. Neuroimage. 2008;39:1064–1080. doi: 10.1016/j.neuroimage.2007.09.031. [DOI] [PMC free article] [PubMed] [Google Scholar]
- Shattuck DW. Sandor-Leahy SR. Schaper KA. Rottenberg DA. Leahy RM. Magnetic resonance image tissue classification using a partial volume model. Neuroimage. 2001;13:856–876. doi: 10.1006/nimg.2000.0730. [DOI] [PubMed] [Google Scholar]
- Sled JG. Pike GB. Standing-wave and RF penetration artifacts caused by elliptic geometry: an electrodynamic analysis of MRI. IEEE Transact Med Imaging. 1998;17:653–662. doi: 10.1109/42.730409. [DOI] [PubMed] [Google Scholar]
- Smeets F. Vuurman EF. van Boxtel MP. Burgmans S. Gronenschild EH. Uylings HB, et al. Aging does not affect gray matter asymmetry. Psychol Aging. 2010;25:587–594. doi: 10.1037/a0017849. [DOI] [PubMed] [Google Scholar]
- Smith SM. Jenkinson M. Johansen-Berg H. Rueckert D. Nichols TE. Mackay CE, et al. Tract-based spatial statistics: voxelwise analysis of multi-subject diffusion data. Neuroimage. 2006;31:1487–1505. doi: 10.1016/j.neuroimage.2006.02.024. [DOI] [PubMed] [Google Scholar]
- Song SK. Sun SW. Ju WK. Lin SJ. Cross AH. Neufeld AH. Diffusion tensor imaging detects and differentiates axon and myelin degeneration in mouse optic nerve after retinal ischemia. Neuroimage. 2003;20:1714–1722. doi: 10.1016/j.neuroimage.2003.07.005. [DOI] [PubMed] [Google Scholar]
- Sowell ER. Peterson BS. Thompson PM. Welcome SE. Henkenius AL. Toga AW. Mapping cortical change across the human life span. Nat Neurosci. 2003;6:309–315. doi: 10.1038/nn1008. [DOI] [PubMed] [Google Scholar]
- Suarez-Sola ML. Gonzalez-Delgado FJ. Pueyo-Morlans M. Medina-Bolivar OC. Hernandez-Acosta NC. Gonzalez-Gomez M, et al. Neurons in the white matter of the adult human neocortex. Front Neuroanat. 2009;3:7. doi: 10.3389/neuro.05.007.2009. [DOI] [PMC free article] [PubMed] [Google Scholar]
- Sullivan EV. Pfefferbaum A. Diffusion tensor imaging and aging. Neurosci Biobehav Rev. 2006;30:749–761. doi: 10.1016/j.neubiorev.2006.06.002. [DOI] [PubMed] [Google Scholar]
- Sullivan EV. Rohlfing T. Pfefferbaum A. Quantitative fiber tracking of lateral and interhemispheric white matter systems in normal aging: relations to timed performance. Neurobiol Aging. 2010;31:464–481. doi: 10.1016/j.neurobiolaging.2008.04.007. [DOI] [PMC free article] [PubMed] [Google Scholar]
- Sundaram SK. Kumar A. Makki MI. Behen ME. Chugani HT. Chugani DC. Diffusion tensor imaging of frontal lobe in autism spectrum disorder. Cereb Cortex. 2008;18:2659–2665. doi: 10.1093/cercor/bhn031. [DOI] [PMC free article] [PubMed] [Google Scholar]
- Takahashi M. Hackney DB. Zhang G. Wehrli SL. Wright AC. O'Brien WT, et al. Magnetic resonance microimaging of intraaxonal water diffusion in live excised lamprey spinal cord. Proc Natl Acad Sci U S A. 2002;99:16192–16196. doi: 10.1073/pnas.252249999. [DOI] [PMC free article] [PubMed] [Google Scholar]
- Takao H. Abe O. Yamasue H. Aoki S. Kasai K. Sasaki H, et al. Aging effects on cerebral asymmetry: a voxel-based morphometry and diffusion tensor imaging study. Magn Reson Imaging. 2010;28:65–69. doi: 10.1016/j.mri.2009.05.020. [DOI] [PubMed] [Google Scholar]
- Takao H. Hayashi N. Ohtomo K. White matter asymmetry in healthy individuals: a diffusion tensor imaging study using tract-based spatial statistics. Neuroscience. 2011;193:291–299. doi: 10.1016/j.neuroscience.2011.07.041. [DOI] [PubMed] [Google Scholar]
- Tamnes CK. Ostby Y. Fjell AM. Westlye LT. Due-Tonnessen P. Walhovd KB. Brain maturation in adolescence and young adulthood: regional age-related changes in cortical thickness and white matter volume and microstructure. Cereb Cortex. 2010;20:534–548. doi: 10.1093/cercor/bhp118. [DOI] [PubMed] [Google Scholar]
- Tang Y. Nyengaard JR. Pakkenberg B. Gundersen HJ. Age-induced white matter changes in the human brain: a stereological investigation. Neurobiol Aging. 1997;18:609–615. doi: 10.1016/s0197-4580(97)00155-3. [DOI] [PubMed] [Google Scholar]
- Thiebaut de Schotten M. Ffytche DH. Bizzi A. Dell'Acqua F. Allin M. Walshe M, et al. Atlasing location, asymmetry and inter-subject variability of white matter tracts in the human brain with MR diffusion tractography. Neuroimage. 2011;54:49–59. doi: 10.1016/j.neuroimage.2010.07.055. [DOI] [PubMed] [Google Scholar]
- Thompson PM. Vidal C. Giedd JN. Gochman P. Blumenthal J. Nicolson R, et al. Mapping adolescent brain change reveals dynamic wave of accelerated gray matter loss in very early-onset schizophrenia. Proc Natl Acad Sci U S A. 2001;98:11650–11655. doi: 10.1073/pnas.201243998. [DOI] [PMC free article] [PubMed] [Google Scholar]
- Toga AW. Thompson PM. Mapping brain asymmetry. Nat Rev Neurosci. 2003;4:37–48. doi: 10.1038/nrn1009. [DOI] [PubMed] [Google Scholar]
- Westerhausen R. Luders E. Specht K. Ofte SH. Toga AW. Thompson PM, et al. Structural and functional reorganization of the corpus callosum between the age of 6 and 8 years. Cereb Cortex. 2011;21:1012–1017. doi: 10.1093/cercor/bhq165. [DOI] [PMC free article] [PubMed] [Google Scholar]
- Westlye LT. Walhovd KB. Dale AM. Bjornerud A. Due-Tonnessen P. Engvig A, et al. Life-span changes of the human brain white matter: diffusion tensor imaging (DTI) and volumetry. Cereb Cortex. 2010;20:2055–2068. doi: 10.1093/cercor/bhp280. [DOI] [PubMed] [Google Scholar]
- Wheeler-Kingshott CA. Cercignani M. About “axial” and “radial” diffusivities. Magn Reson Med. 2009;61:1255–1260. doi: 10.1002/mrm.21965. [DOI] [PubMed] [Google Scholar]
- Woods RP. Grafton ST. Holmes CJ. Cherry SR. Mazziotta JC. Automated image registration: I. General methods and intrasubject, intramodality validation. J Comput Assist Tomogr. 1998a;22:139–152. doi: 10.1097/00004728-199801000-00027. [DOI] [PubMed] [Google Scholar]
- Woods RP. Grafton ST. Watson JD. Sicotte NL. Mazziotta JC. Automated image registration: II. Intersubject validation of linear and nonlinear models. J Comput Assist Tomogr. 1998b;22:153–165. doi: 10.1097/00004728-199801000-00028. [DOI] [PubMed] [Google Scholar]
- Wu YC. Field AS. Whalen PJ. Alexander AL. Age- and gender-related changes in the normal human brain using hybrid diffusion imaging (HYDI) Neuroimage. 2011;54:1840–1853. doi: 10.1016/j.neuroimage.2010.09.067. [DOI] [PMC free article] [PubMed] [Google Scholar]
- Zaidel E. Iacoboni M. The Parallel Brain: The Cognitive Neuroscience of the Corpus Callosum. Cambridge, MA: MIT Press; 2003. [Google Scholar]