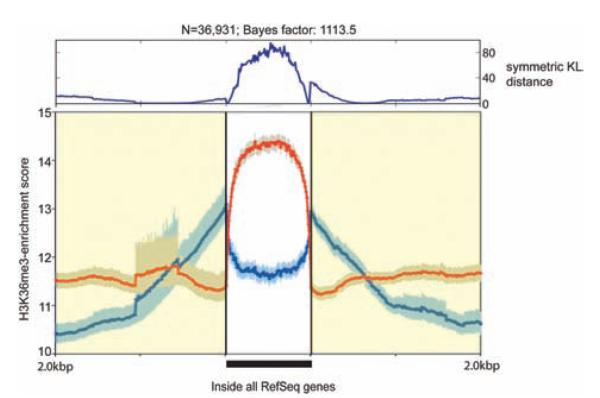
Figure 5.
H3K36me3 enrichment profiles within regions of annotated Reference Sequence (RefSeq) genes were significantly different between control (CTR) and end-stage cardiomyopathy (EsCM). Composite H3K36me3 enrichment profiles were generated for control (blue) and EsCM (red) from 2 pooled sequencing libraries comprising 4 normal and 3 EsCM hearts, respectively (see Table I in the online-only Data Supplement for details of samples). Enrichment scores were determined as tag counts per 500 bp per 1 million reads for each sequencing library and analyzed for all 36 109 RefSeq genes (as annotated on the UCSC Genome Browser) and 3 kb upstream and downstream of these regions.

