Abstract
Background:
Neurological deterioration in acute spontaneous intra cerebral hemorrhage (ICH) may depend on hematoma volume, electrolyte imbalances, hydration status and other physiological parameters. Plasma osmolality is a marker of hydration. This study has examined the relationship of plasma osmolality with hematoma volume and clinical outcome.
Materials and Methods:
This is a prospective observational study included 75 patients with non-traumatic acute spontaneous ICH. Plasma osmolality, hematoma volume and clinical outcome in National Institute Health stroke scale (NIHSS) were measured on admission and on day 7 after treatment. Mean plasma osmolality was compared between those who died before day 7 and those who died after day 7. Plasma osmolality was also compared between patients with NIHSS score >20 and patients with NIHSS score ≤20. Paired t test, Pearson correlation coefficient and independent sample t test were done using SPSS software (version 17 for Windows).
Result:
There is no significant correlation between hematoma volume and plasma osmolality. Higher admission plasma osmolality was associated with early death [312.0 (±16.0) mOsm/kg for those who died before day 7 versus 297.0 (±14.7) mOsm/kg for those who died after day 7, P value =0.031]. Higher admission plasma osmolality was associated with very severe stroke [311.5 (±14.1) mOsm/Kg for patients with NIHSS score >20 versus 293.6 (±11.3) mOsm/kg for patients with NIHSS score ≤20, P value =0.000).
Conclusion:
High plasma osmolality is a predictor of early mortality. Hematoma volume is not influenced by plasma osmolality.
Keywords: Clinical outcome, hematoma volume, intra cerebral hemorrhage, osmolality
INTRODUCTION
For last few decades, considerable number of researches has been done with drug therapy and treatment strategy in respect to management of acute onset stroke. Development of stroke unit is the landmark in reducing mortality and morbidity of acute stroke patients.[1] Monitoring and stabilizing the acute physiological parameters such as blood pressure, temperature, blood sugar, oxygen saturation, hydration status, and electrolyte imbalance have become a part of standard stroke management.[2,3] Study in respect to hydration status of the patients is not so extensive. The exact mechanism of how it affects clinical outcome in acute stroke patients is not clear. Whether there is any actual relationship of hydration status and mortality and morbidity remains controversial.[4] Plasma osmolality may be a good bio-marker of hydration status of the patients.[5] Moreover, with the course of the disease, there may be significant change of serum electrolytes by numerous factors like fluid therapy, diuretic use, presence of diabetes mellitus, stress hyperglycemia, etc. This electrolyte misbalances also affects plasma osmolality. For management of stroke patients with raised intracranial tension, mannitol is used widely as an osmotic agent.[6] The most common complications of mannitol therapy are fluid and electrolyte imbalances.[7] Thus, with mannitol therapy there may be some change in plasma osmolality. That's why, monitoring of plasma osmolality in stroke unit may be a useful bio-marker which will reflect the hydration status, electrolyte imbalances and any disturbances done by mannitol therapy. There are only few studies which investigated the relationship of plasma osmolality and clinical outcome in acute intra cerebral hemorrhage (ICH), but none of them used hematoma volume as a parameter influenced by plasma osmolality. This study has examined the relationship of plasma osmolality with hematoma volume and clinical outcome. The aim of our study is to measure the change of plasma osmolality with the course of the disease and how it affects the hematoma volume and short term (7 days) in-hospital clinical outcome after acute spontaneous intra cerebral hemorrhage.
MATERIALS AND METHODS
It is a prospective observational study which includes 75 patients with acute non-traumatic intra cerebral hemorrhage (ICH)-all were CT scan proved. Study was conducted among the patients admitted in Medicine and Neurology ward of Burdwan Medical College and Hospital, Burdwan, WB, India during the period January 2010-January 2011. This study was approved by the institution ethics committee. All patients were randomly selected irrespective of age and sex, presence or absence of risk factors (diabetes mellitus, hypertension, etc.)
The inclusion criteria were (a) acute onset hemorrhagic stroke presented in the hospital within 24 hour of stroke onset, (b) Non contrast CT scan of brain showed supra-tentorial hemorrhage, (c) No history of head injury and prior established neuro-deficit.
These patients were excluded from study (a) Time gap from onset of stroke to the presentation to our hospital more than 24 hour, (b) Hemorrhagic stroke due to trauma, sub-arachnoids hemorrhage, rupture aneurysm, (c) patients with brainstem and cerebellar hemorrhage (d) Patients who has prior stroke with established neuro-deficit.
After admission, clinical assessment of the patient was done in prescribed format of National Institute Health stroke scale (NIHSS). Total stroke score was taken. This NIHSS score is the most useful predictor of mortality and it provides reliable information on patient's short term mortality risk.[8] Non contrast CT scan was done. The volume of hematoma was measured by CT scan using in built software, (This procedure involved to define a zone of interest of ICH and to define the zone of edema at multiple CT sections. Then the Analyze software provided the area in square millimeters and volume in cubic millimeters. The volume of ICH was calculated by multiplying the section thickness of the acquisition by the area). Blood samples were taken on day 1 of admission and with immediate effect these were centrifuged. Routine biochemical parameters like sodium, potassium, glucose, urea, etc. were measured by Vitros 950 (J and J). Calculated plasma osmolality was measured using the formula: 2*(Na++K+)+[blood sugar/18]+[BUN/2.8].[9]
From day 1 onwards patients were kept in standard treatment protocol. At the end of day 7, the patient was again put in CT scan and volume of hematoma was measured as before. All the above mentioned biochemical parameters were again measured in same protocol. Patient was given stroke score at day 7 by clinical assessment using NIH stroke scale. Obviously some data are missing at day 7 because few patients died before completion of day 7. They were followed up till they are in condition of discharge from hospital. So, at the end of the study we have 75 cases on day 1 and 53 cases on day 7 with acute non-traumatic ICH with their plasma osmolality, NIHSS score and hematoma volume.
Statistical method
The quantitative data were expressed as mean (±SD) and qualitative data as frequency (%). For comparing the plasma osmolality, hematoma volume and NIHSS score at the day 1 and day 7, paired t-test was applied to test the change of studied variables. For investigating the correlation between plasma osmolality (both at the day 1 and day 7) and clinical outcome parameters (NIHSS score and hematoma volume), Pearson correlation coefficient was calculated and tested. To compare the plasma osmolality between patients died before day 7 and died after day 7, independent samples t-test was done and P value was calculated. Same test (independent samples t-test) was also used to compare plasma osmolality of the patients with high stroke score (NIHSS >20) and low stroke score (NIHSS ≤20) both on day 1 and day 7. Statistical analysis was performed using SPSS software version 17 for Windows. Statistical significance was accepted at P <0.05 (two-tailed).
RESULTS
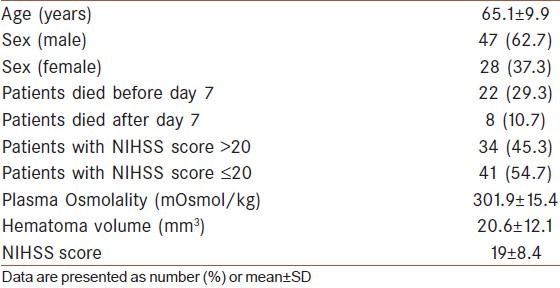
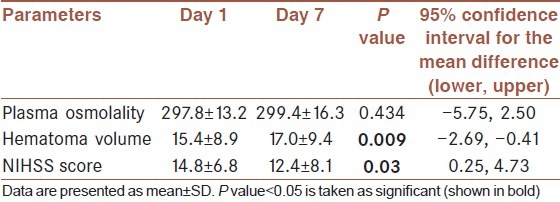
Total 75 patients were investigated after meeting inclusion and exclusion criteria. 47 (62.7%) patients were male and 28 (37.3%) were female. Their demographic and baseline characteristics are given in Table 1. Mean age of presentation was 65.1 (±9.9) years. Their mean plasma osmolality was 301.9 (±15.4) mOsm/Kg, mean hematoma volume was 20.6 (±12.1) cm3 and mean NIHSS score on admission was 19 (±8.4). Total 22 (29.3%) patients died before completion of day 7 and 8 (10.7%) patients died after day 7 within the period of follow up. 34 (45.3%) patients had high admission NIHSS (>20) and 41 (54.7%) patients had admission NIHSS score ≤20 on. Among the survived 53 patients, changes of plasma osmolality, hematoma volume and NIHSS score from day 1 to day 7 were estimated. Osmolality was increased from 297.8 (±13.2) mOsm/Kg of day 1 to 299.4 (±16.3) mOsm/Kg of day 7. But this change was not significant (P value=0.434). Mean hematoma volume was increased from 15.4 (±8.9) cm3 of day 1 to 17.0 (±9.4) cm3 of day 7, this change became significant (P value=0.009). Mean NIHSS score was decreased from 14.8 (±6.8) on admission to 12.4 (±8.1) on day 7, this change was also significant (P value=0.03) [Table 2].
Table 1.
Patient demographic and baseline characteristics on admission (n=75)

Table 2.
Paired sample parameters of the patients who survived on and after day 7 (n=53)

In correlation study, none of the hematoma volume (neither on day 1 nor on day 7) was dependent on plasma osmolality of day 1 and day 7, all P value and calculated Pearson correlation were insignificant statistically. Admission plasma osmolality highly influenced the clinical outcome in term of NIHSS score both on day 1 and day 7 (P value=0.000 and 0.024, respectively) [Table 3]. Outcome in NIHSS score on day 7 was highly influenced by four factors – (i) plasma osmolality on day 1 (P value=0.024), (ii) plasma osmolality on day 7 (P value=0.001), (iii) initial hematoma volume on day 1 (P value=0.049) and (iv) hematoma volume on day 7 (P value=0.01).
Table 3.
Correlation study among the parameters measured on day 1 and day 7

Though none of the hematoma volume was dependent on plasma osmolality, initial hematoma volume (on day 1) had great influences on admission NIHSS score (P value=0.000), final NIHSS score (P value=0.049) and final hematoma volume (P value=0.000).
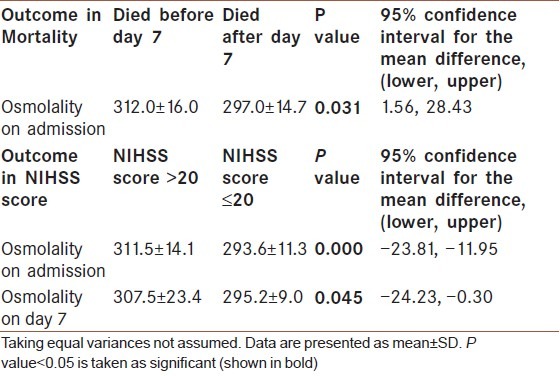
High plasma osmolality on admission was associated with very poor outcome. Mean admission plasma osmolality was 312.0 (±16.0) mOsm/kg for those who died before day 7 compare to 297.0 (±14.7) mOsm/kg for those who died after day 7 (P value=0.031). Mean admission plasma osmolality was 311.5 (±14.1) mOsm/Kg for patients with NIHSS score >20 compare to 293.6 (±11.3) mOsm/kg for patients with NIHSS score ≤20 (P value=0.000) [Table 4]. Higher plasma osmolality on day 7 with mean value 307.5 (±23.4) mOsm/ Kg was also associated with higher NIHSS >20 on day 7 (very severe stroke).
Table 4.
Mean value of plasma osmolality as an outcome predictor

DISCUSSION
Study on plasma osmolality in acute stroke patients is limited. This study found that admission plasma osmolality 312 mOsm/kg is associated with early death (less than 7 days) and very severe stroke. Those having plasma osmolality around 293-295 mOsm/kg have better survival. Electrolyte disturbances like hyponatremia, which affects osmolality, can lead to severe complication like convulsion and death.[10] Dehydration, which is very common among acute stroke patients, increases blood viscosity by affecting plasma osmolality, thus affects cerebral hemodynamic and alters cerebral blood flow.[11,12] So plasma osmolality is a good predictor of stroke outcome which will encompasses all these parameters into account. NIHSS score is widely used in assessing the functional status and outcome of the stroke patients.[13] We found a significant relationship between admission plasma osmolality and NIHSS score. Admission plasma osmolality is significantly higher in those patients who have NIHSS score >20 (near 311 mOsm/kg) than those having NIHSS score ≤20 (293 mOsm/kg). This is also true for day 7. So, it can be concluded that higher plasma osmolality on admission is associated with bad outcome in acute ICH (very severe stroke) and admission plasma osmolality at least below 295 mOsm/kg is a predictor of good outcome in respect to mortality and morbidity.
There are few studies which shows that raised plasma osmolality have increased mortality and poor functional outcome. Bhalla et al. demonstrated that raised plasma osmolality above 296 mOsm/kg on admission was independently associated with high mortality over the period of 3 months.[14] Our study found that raised plasma osmolality above 312 mOsm/kg is a predictor of high in-hospital mortality within 7 days in acute ICH. We also found that plasma osmolality below 295 mOsm/kg on admission safe. This is equivalent to the findings by Bhalla et al. On the other hand, in two different studies by Seo W and Oh H, plasma osmolality on admission were measured, but they have not found osmolality as physiologic predictors of hemorrhagic stroke in terms of mortality, functional disability or cognitive ability.[15,16] O’Neil and his colleagues also found no significant differences in plasma osmolality between mortality and survival.[17] This is supported by Joynt et al. who found no significant difference in plasma osmolality on admission between stroke patients and control subjects.[18]
But none of these studies involved hematoma volume as a parameter to see the enlargement or regression of hematoma volume with changing pattern of plasma osmolality, which is counted in this study. Mass effect of hematoma and peri-hematomal edema are commonly responsible for neurological deterioration after ICH. But exact relation between plasma osmolality and hematoma volume is yet to be established. This study found no significant relation between plasma osmolality and hematoma volume-both on admission and after treatment. But hematoma volume has significant influence on clinical outcome. Though both of the parameters e.g. hematoma volume and plasma osmolality have great influence on clinical outcome (both of these hypothesis is proved in our study), their complex interaction is not yet established. According to our study, they are not influenced by each other.
One of the major limitations of this study is discrepancy between calculated plasma osmolality and actual plasma osmolality. There may be significant difference between the two values which may prevent to reflect the actual situation.[7] This is a short term in-hospital observational study. So, more number of studies on plasma osmolality and hematoma volume in ICH with long term follow up is necessary to come in a conclusion about the effect of plasma osmolality on hematoma volume. In spite of all these, from this study we can say that by measuring plasma osmolality we can predict short term in-hospital mortality and morbidity of patients with acute hemorrhagic stroke.
Footnotes
Source of Support: Nil
Conflict of Interest: None declared.
REFERENCES
- 1.Stroke Unit Trialists’ Collaboration. Organised inpatient (stroke unit) care for stroke. Cochrane Database Syst Rev. 2007 doi: 10.1002/14651858.CD000197.pub2. Art. No.: CD000197. [DOI] [PubMed] [Google Scholar]
- 2.Evans A, Perez I, Harraf F, Melbourn A, Steadman J, Donaldson N, et al. Can differences in management processes explain different outcomes between stroke unit and stroke-team care? Lancet. 2001;358:1586–92. doi: 10.1016/S0140-6736(01)06652-1. [DOI] [PubMed] [Google Scholar]
- 3.Bhalla A, Wolfe CD, Rudd AG. Management of acute physiological parameters after stroke. QJM. 2001;94:167–72. doi: 10.1093/qjmed/94.3.167. [DOI] [PubMed] [Google Scholar]
- 4.Manz F. Hydration and disease. J Am Coll Nutr. 2007;26:535S–41S. doi: 10.1080/07315724.2007.10719655. [DOI] [PubMed] [Google Scholar]
- 5.O’Neill PA. Aging and salt and water balance. Rev Clin Gerontol. 1996;6:305–13. [Google Scholar]
- 6.Bereczki D, Liu M, Fernandes do Prado G, Fekete I. Mannitol for acute stroke. Cochrane Database Syst Rev. 2001 doi: 10.1002/14651858.CD001153. Art. No.: CD001153. [DOI] [PubMed] [Google Scholar]
- 7.Oken DE. Renal and extrarenal considerations in high-dose mannitol therapy. Ren Fail. 1994;16:147–59. doi: 10.3109/08860229409044856. [DOI] [PubMed] [Google Scholar]
- 8.Schlegel D, Kolb SJ, Luciano JM, Tovar JM, Cucchiara BL, Liebeskind DS, et al. Utility of the NIH Stroke Scale as a predictor of hospital disposition. Stroke. 2003;34:134–7. doi: 10.1161/01.str.0000048217.44714.02. [DOI] [PubMed] [Google Scholar]
- 9.Rasouli M, Kalantari KR. Comparison of methods for calculating serum osmolality: multivariate linear regression analysis. Clin Chem Lab Med. 2005;43:635–40. doi: 10.1515/CCLM.2005.109. [DOI] [PubMed] [Google Scholar]
- 10.Verbalis JG. Brain volume regulation in response to changes in osmolality. Neuroscience. 2010;168:862–70. doi: 10.1016/j.neuroscience.2010.03.042. [DOI] [PubMed] [Google Scholar]
- 11.Allport LE, Parsons MW, Butcher KS, MacGregor L, Desmond PM, Tress BM, et al. Elevated hematocrit is associated with reduced reperfusion and tissue survival in acute stroke. Neurology. 2005;65:1382–7. doi: 10.1212/01.wnl.0000183057.96792.a8. [DOI] [PubMed] [Google Scholar]
- 12.Stookey JD. High prevalence of plasma hypertonicity among community-dwelling older adults: results from NHANES III. J Am Diet Assoc. 2005;105:1231–9. doi: 10.1016/j.jada.2005.05.003. [DOI] [PubMed] [Google Scholar]
- 13.Glymour MM, Berkman LF, Ertel KA, Fay ME, Glass TA, Furie KL. Lesion characteristics, NIH stroke scale, and functional recovery after stroke. Am J Phys Med Rehabil. 2007;86:725–33. doi: 10.1097/PHM.0b013e31813e0a32. [DOI] [PubMed] [Google Scholar]
- 14.Bhalla A, Sankaralingam S, Dundas R, Swaminathan R, Wolfe CD, Rudd AG. Influence of raised plasma osmolality on clinical outcome after acute stroke. Stroke. 2000;31:2043–8. doi: 10.1161/01.str.31.9.2043. [DOI] [PubMed] [Google Scholar]
- 15.Seo W, Oh H. Acute physiologic predictors of mortality and functional and cognitive recovery in hemorrhagic stroke: 1-, 3-, and 6-month assessments. J Stroke Cerebrovasc Dis. 2007;16:57–63. doi: 10.1016/j.jstrokecerebrovasdis.2006.10.005. [DOI] [PubMed] [Google Scholar]
- 16.Seo W, Oh H. Comparisons of acute physiological parameters influencing outcome in patients with traumatic brain injury and hemorrhagic stroke. Worldviews Evid Based Nurs. 2009;6:36–43. doi: 10.1111/j.1741-6787.2008.00139.x. [DOI] [PubMed] [Google Scholar]
- 17.O’Neill PA, Davies I, Fullerton KJ, Bennett D. Fluid balance in elderly patients following acute stroke. Age Ageing. 1992;21:280–5. doi: 10.1093/ageing/21.4.280. [DOI] [PubMed] [Google Scholar]
- 18.Joynt RJ, Feibel JH, Sladek CM. Antidiuretic hormone levels in stroke patients. Ann Neurol. 1981;9:182–4. doi: 10.1002/ana.410090212. [DOI] [PubMed] [Google Scholar]


